


Custom alerts and data visualization let you quickly identify and prevent all kinds of network issues.
Ethereal primarily serves as packet capture and packet analyzer solution. PRTG, however, offers all-in-one flow monitoring and packet sniffing, as well as:
With PRTG, you don't need separate modules or add-ons for features like infrastructure monitoring, performance monitoring, router monitoring, bandwidth management, or an integrated port scanner. PRTG comes with more than 250 preconfigured sensors, allowing you to set up and get started with your monitoring in no time.

Quick installation with automatic network discovery and smart setup for instant monitoring
Custom dashboard creation via drag & drop with easy-to-read visualized overviews
Different user interfaces for web, desktop, and mobile apps for monitoring on the go
Network of qualified implementation partners to support you with a smooth migration to PRTG
Diagnose network issues by continuously tracking the health, availability, and performance of your entire IT infrastructure. Show hardware parameters, application performance, network traffic, bandwidth usage, and other key metrics in real time. Visualize data in clear graphs and dashboards to identify problems more easily. Gain the overview you need to troubleshoot all kinds of issues in your network.

Device tree view of the complete monitoring setup

Custom PRTG dashboard for keeping an eye on the entire IT infrastructure

Live traffic data graph in PRTG
FEATURE | PRTG PRTG | Ethereal (Wireshark) Ethereal (Wireshark) |
|---|---|---|
One tool for your entire network | PRTG All monitoring features included | Ethereal (Wireshark) Focused specifically on packet capture and analysis rather than comprehensive network monitoring |
Easy setup, intuitive monitoring | PRTG User-friendly interfaces for web, desktop, and mobile | Ethereal (Wireshark) Relatively easy to install, but requires technical knowledge to effectively use and interpret packet data |
Automatic network discover | PRTG Included | Ethereal (Wireshark) Does not automatically discover network devices; primarily captures packets on selected interfaces |
Real-time alerts & notifications | PRTG Advanced, highly customizable alerting via different notification methods | Ethereal (Wireshark) No built-in alerting system; primarily an analysis tool rather than a monitoring solution |
Custom maps & dashboards | PRTG Custom dashboard creation via drag & drop | Ethereal (Wireshark) Offers statistical visualizations but lacks customizable dashboards for network overview |
Agentless monitoring | PRTG No need to install agents on the monitored systems | Ethereal (Wireshark) Operates without agents, capturing packets directly from network interfaces |
On-premises or cloud-based | PRTG Flexible deployment options available | Ethereal (Wireshark) Primarily desktop-based application, but can be used to analyze cloud traffic captured locally |
Enterprise version | PRTG Available | Ethereal (Wireshark) Only one version available (open-source) |
Freeware version | PRTG Available for up to 100 sensors, free for life | Ethereal (Wireshark) Completely free and open-source software |
Distributed network monitoring | PRTG Monitoring an unlimited number of remote locations included | Ethereal (Wireshark) Primarily designed for local packet capture; requires additional setup for distributed monitoring |
Server & application monitoring | PRTG Out-of-the-box integration, no extra cost | Ethereal (Wireshark) Limited to network traffic analysis; not designed for server or application performance monitoring |
Network performance monitoring | PRTG Out-of-the-box integration, no extra cost | Ethereal (Wireshark) Provides detailed packet-level analysis for network troubleshooting, but lacks long-term performance monitoring |
Bandwidth monitoring | PRTG Out-of-the-box integration, no extra cost | Ethereal (Wireshark) Can analyze bandwidth usage at the packet level but not designed for continuous bandwidth monitoring |
Network traffic analyzer | PRTG Out-of-the-box integration, no extra costs | Ethereal (Wireshark) Deep packet inspection and protocol analysis capabilities; core strength of the tool |
Cloud services monitoring | PRTG Out-of-the-box integration, no extra cost | Ethereal (Wireshark) Not designed for cloud service monitoring; limited to analyzing captured network traffic |
Virtual infrastructure monitoring | PRTG Out-of-the-box integration, no extra cost | Ethereal (Wireshark) Not designed for virtual infrastructure monitoring |
Storage resource monitoring | PRTG Out-of-the-box integration, no extra cost | Ethereal (Wireshark) Not designed for storage resource monitoring |
Database monitoring | PRTG Out-of-the-box integration, no extra cost | Ethereal (Wireshark) Not designed for database monitoring; can only analyze database network traffic |
Web performance monitoring | PRTG Out-of-the-box integration, no extra cost | Ethereal (Wireshark) Can analyze HTTP/HTTPS traffic in detail, but not designed for continuous web performance monitoring |
Supports leading technologies | PRTG SNMP, flow protocols, packet sniffing, WMI, HTTP, ping, SQL, and much more | Ethereal (Wireshark) Supports analysis of hundreds of network protocols with deep packet inspection capabilities |
Create your own scripts | PRTG Own PRTG API included for custom sensors and scripts | Ethereal (Wireshark) Supports custom protocol dissectors and can be extended with Lua scripts |
Includes technical support | PRTG Expert support included, no extra costs | Ethereal (Wireshark) Community support only through forums and documentation |
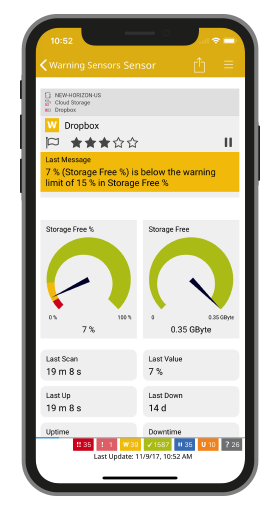
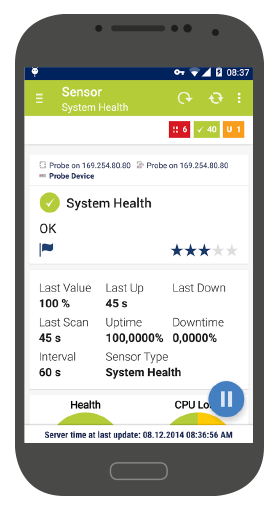
PRTG mobile apps let you monitor your network while on the go. With Ethereal and many other monitoring tools, you can only monitor by way of the web interface. PRTG apps run on smartphones, tablets, and smartwatches with an iOS or Android operating system. Push notifications can be sent directly to your smartphone in the event of warning messages or errors in your network.
You are interested to know if PRTG could be an alternative to your Ethereal implementation?

PRTG is set up in a matter of minutes and can be used on a wide variety of mobile devices.

We also compared PRTG with other monitoring tools:
The basic version of the open-source tool Nagios is free of charge. But most users spent many hours to set up and customize the tool. In case of problems, browsing through forums is often the only solution.
SolarWinds might be interesting for extremely complex network environments. But it also means you need to invest in higher costs for a platform made up of different modules and add-ons (that cost extra).
Zabbix is open-source software with a strong community support. But it requires lots of manual configuration work to install and set it up. You also need to install agents on the monitored systems.
PRTG and ManageEngine might seem similar at first. However, with ManageEngine, you have to choose between individual functions and purchase several modules to access the full range of features.
Real-time notifications mean faster troubleshooting so that you can act before more serious issues occur.
Partnering with innovative IT vendors, Paessler unleashes synergies to create
new and additional benefits for joined customers.
Paessler and Plixer provide a complete solution adding flow and metadata analysis to a powerful network monitoring tool.
IT that works constitutes a business-critical basis for a company's success. Availability and security must be defined for the respective purpose and closely monitored – by OT and IT alike.
Siemon and Paessler bring together intelligent building technology and advanced monitoring and make your vision of intelligent buildings and data centers become reality.
Network Monitoring Software – Version 26.1.116.1532 (February 9th, 2026)
Download for Windows and cloud-based version PRTG Hosted Monitor available
English, German, Spanish, French, Portuguese, Dutch, Russian, Japanese, and Simplified Chinese
Network devices, bandwidth, servers, applications, virtual environments, remote systems, IoT, and more
Choose the PRTG Network Monitor subscription that's best for you
Choosing between Paessler PRTG and Ethereal depends on several factors, such as your specific network monitoring needs, budget, and technical resources available in your organization.
PRTG is ideal:
Ethereal might be your choice:
At first glance, free software like Ethereal seems like a good deal compared to PRTG. However, it will likely cost you more in the long run in terms of wasted hours, effort, and negative impact on your business.
Especially in the case of frequently used software that’s vital for smooth business operations, the purchasing price is only one part of the cost. PRTG saves you time and helps keep your business running with easy-to-use software, superior daily usability, expert tech support, and faster, more intuitive operation and setup.
In PRTG, “sensors” are the basic monitoring elements. One sensor usually monitors one measured value in your network, for example the traffic of a switch port, the CPU load of a server, or the free space on a disk drive. On average, you need about 5-10 sensors per device or one sensor per switch port.
Paessler conducted trials in over 600 IT departments worldwide to tune its network monitoring software closer to the needs of sysadmins. The result of the survey: over 95% of the participants would recommend PRTG – or already have.

You are interested to know if PRTG could be an alternative to your Ethereal implementation?
