• Company
    • About Us
    • Case Studies
    • Press Center
    • Careers
    • Blog
    • Contact us
  • Contact us
  • Login
 
  • English
    • Deutsch
    • Español
    • Français
    • Italiano
    • Português
Paessler
                    - The Monitoring Experts
  • Products
    • Paessler PRTG
      Paessler PRTGMonitor your whole IT infrastructure
      • PRTG Network Monitor
      • PRTG Enterprise Monitor
      • PRTG Hosted Monitor
      • PRTG UVexplorer
      • PRTG extensionsExtensions for Paessler PRTGExtend your monitoring to a new level
    • Icon Features
      FeaturesExplore all monitoring features
      • Maps & dashboards
      • Alerts & notifications
      • Multiple user interfaces
      • Distributed monitoring
      • Customizable reporting
  • Solutions
    • By TeamFor your organization size
      • Small Business IT
      • Mid-Market IT
      • Enterprise IT
      • MSP Network Monitoring
    • Industries
      By IndustryFor your business sector
      • Industrial
      • Healthcare
      • Government
      • Education
      • Data Center
      • Finance
    • IT Topics
      By Use CaseFor every technical scenario
      • Network Monitoring
      • Server Monitoring
      • OT Monitoring
      • Distributed Monitoring
      • Network Topology Mapping
      • SNMP Monitoring
      • Bandwidth Monitoring
  • Pricing
  • Resources
    • Getting Started
      Getting StartedModules for self-paced learning
    • How-to Guides
      How-to GuidesGet the most out of PRTG
    • Videos & Webinars
      Videos & WebinarsLearn from Paessler experts
    • IT  Knowledge
      IT KnowledgeExpand your IT knowledge
    • PRTG Manual
      PRTG ManualFull documentation
    • Knowledge Base
      Knowledge BaseShare community knowledge
    • PRTG Sensor Hub
      PRTG Sensor HubGet sensors, scripts & templates
    • Trainings
      PRTG TrainingLearn how to work with PRTG
  • Partners
    • Icon Handshake
      Become a PartnerFor resellers and channel partners
    • Icon MSP
      Become an MSPDeliver monitoring as a managed service
    • icon partner
      Partner PortalLog in to your partner account
    • Deal Registration
      Deal RegistrationRegister your sales opportunities
    • icon search
      Find a PartnerFind partners selling Paessler products
    • icon technology
      Technology AlliancesSee Paessler technology partnerships
    • Partner HubTools for Your Success
  • Company
    • About Us
    • Case Studies
    • Press Center
    • Careers
    • Blog
    • Contact us
  • Contact us
  • Login
  • English
    • Deutsch
    • Español
    • Français
    • Italiano
    • Português
  • Get a quote
  • Free trial
  1. Home>
  2. Company>
  3. Case Studies>
  4. Tübingen University Hospital

No More 3 a.m. Calls: Tübingen University Hospital Automates IT Monitoring with PRTG 

Challenge: Replacing an overstretched monitoring setup that required specialist expertise, left most systems unmonitored, and kept on-call staff up at night 

download PDF
Logo Tübingen University Hospital

COMPANY
Tübingen University Hospital

INDUSTRY
Healthcare and IT & Telecommunication

COMPANY SIZE
Enterprise

COUNTRY
Germany

SCALE
1,600+ beds, PRTG Enterprise Monitor

Icon Sensor

18,000+ sensors covering IT and clinical systems

Icon time

On-call workload significantly reduced through automation and redundancy logic

Icon user group

Departments self-configure monitoring without touching core infrastructure

Icon boost

Expansion underway for medical devices, building technology, DICOM, and HL7

The problem

At Tübingen University Hospital, IT runs around the clock. When something fails, it must be caught and fixed immediately. The previous tools, HostMonitor and OpenNMS, required deep expertise and more resources than the team had.  

The result: only the most critical systems were monitored. New systems were left out entirely. Automation was stalled. When a malfunction occurred outside business hours, the on-call team was paged, sometimes at 3 a.m. on a Sunday, just to reboot a print server.  

The situation was no longer sustainable. 

What changed with PRTG

After testing several tools, the hospital selected PRTG for its usability, automation capabilities, and scalability. Today, more than 18,000 sensors cover VMware, NetApp, SAN storage, Windows and Linux servers, Citrix, SQL and Oracle databases, SAP, and clinical applications. 

Department staff configure their own monitoring in PRTG without accessing core infrastructure. Role-based permissions keep each team within their area of expertise. Core systems stay protected. Departments get the visibility they need without central IT setting it up for them. 

Automation handles what used to wake people up. If one of three redundant servers fails, an email goes to the relevant team. The on-call team is not disturbed. For non-redundant systems, PRTG restarts services or reboots servers automatically and only escalates if the issue persists. 

Many employees in our departments have specific ideas about how their devices and services should be monitored. Thanks to the intuitive design and outstanding usability of PRTG, they can set up their own monitoring themselves without much training.

Torsten Schoen, PRTG Service Owner
Tübingen University Hospital
PRTG Logo

PRTG monitors hospital IT and clinical infrastructure from one platform.

CONTACT SALES
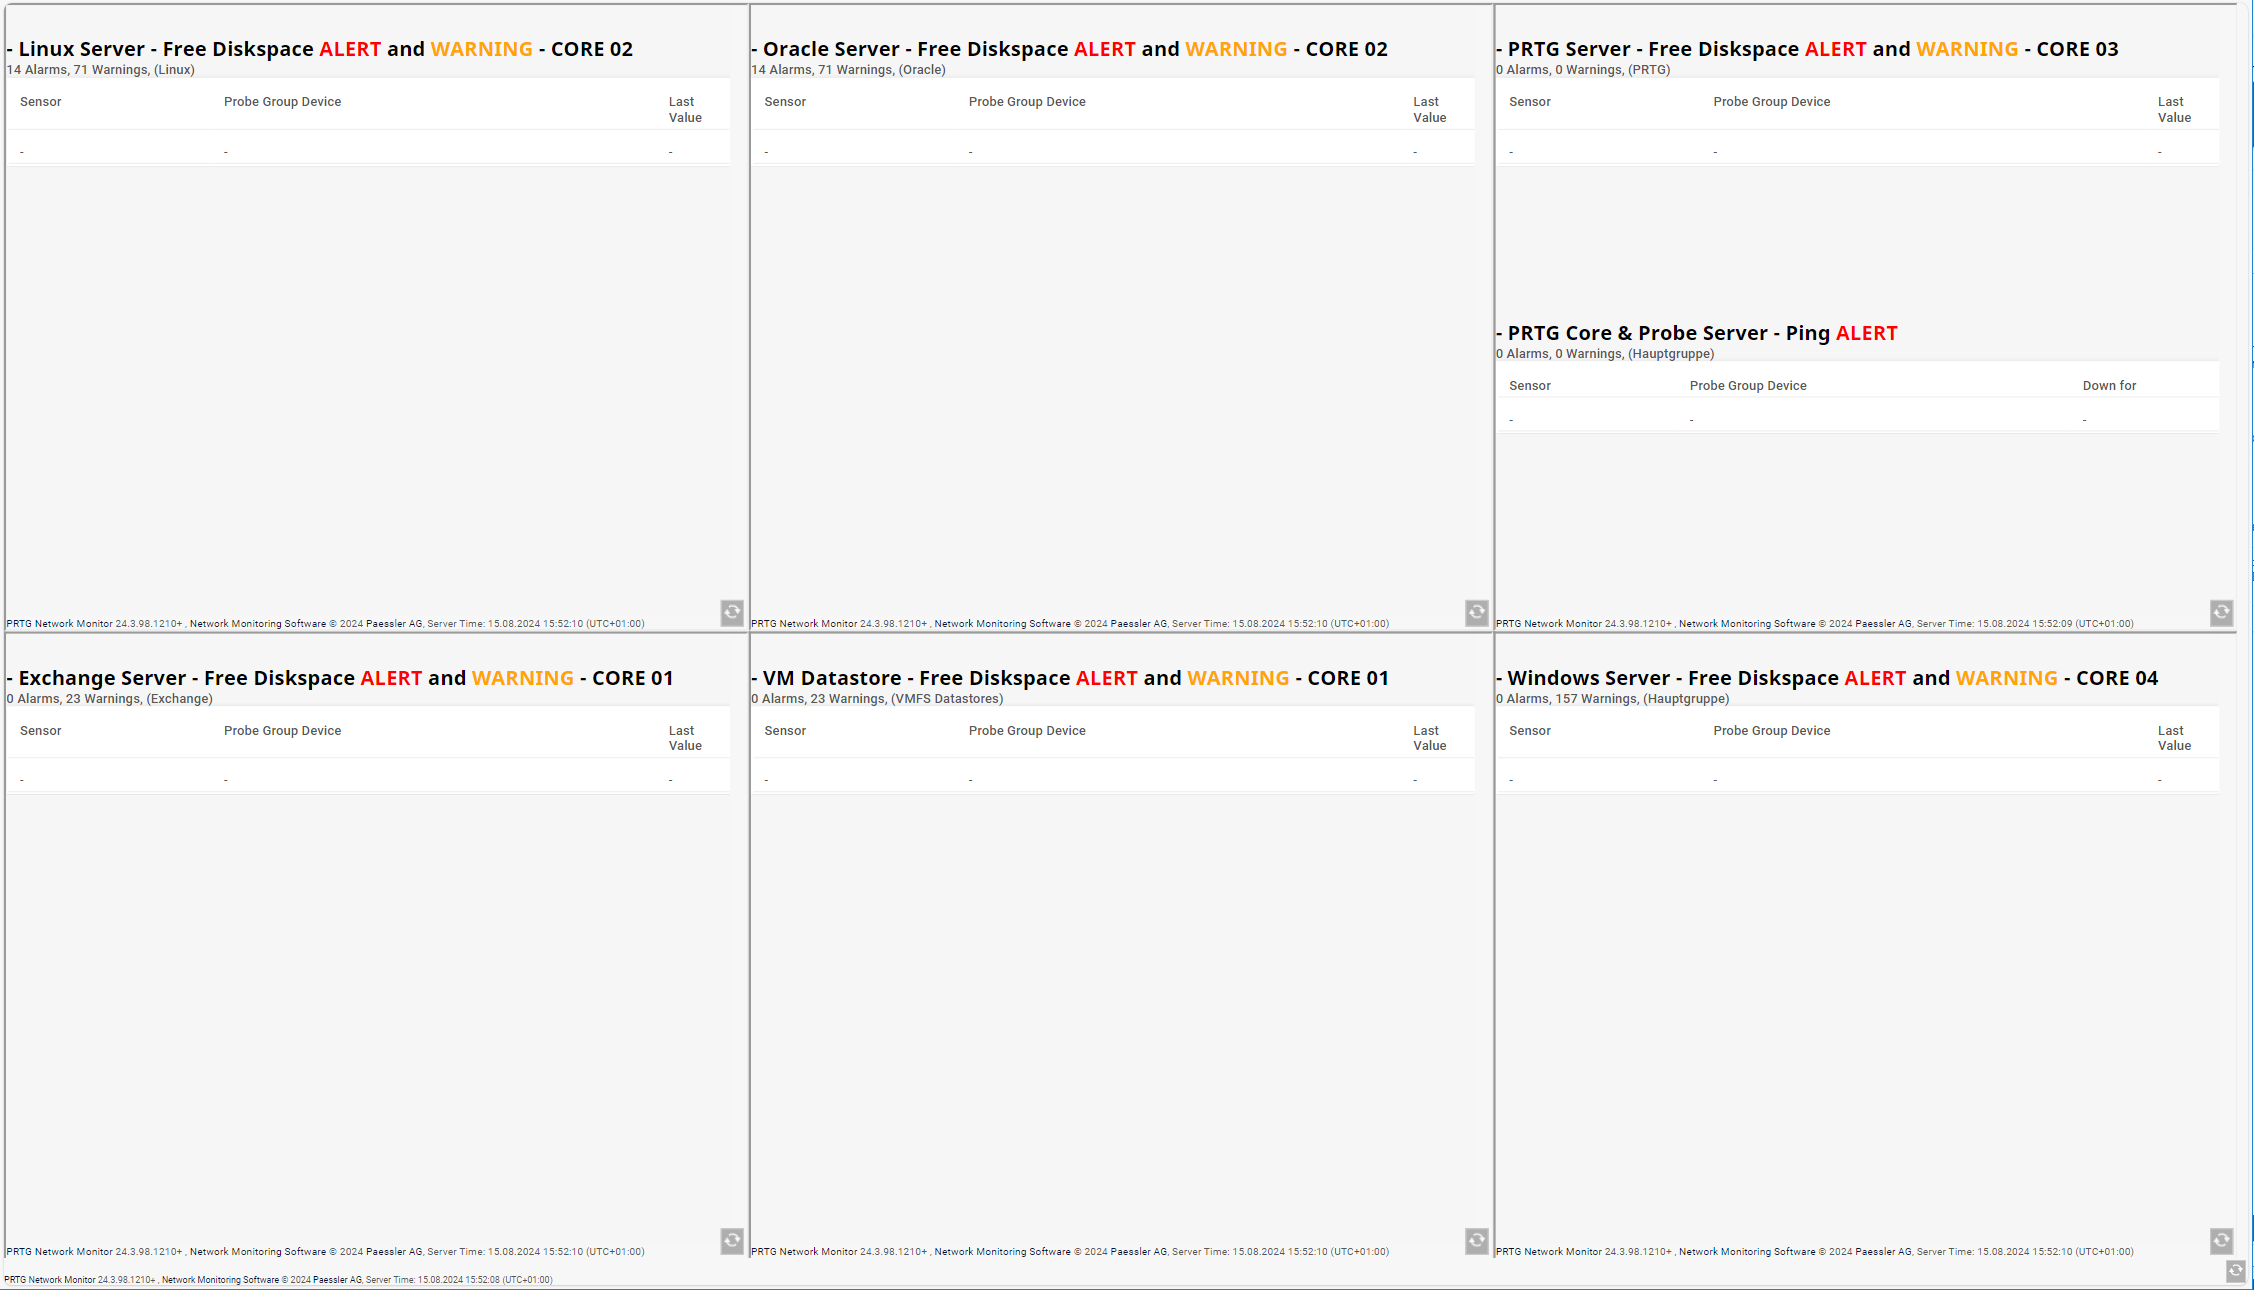
case study tübingen hospital server overview
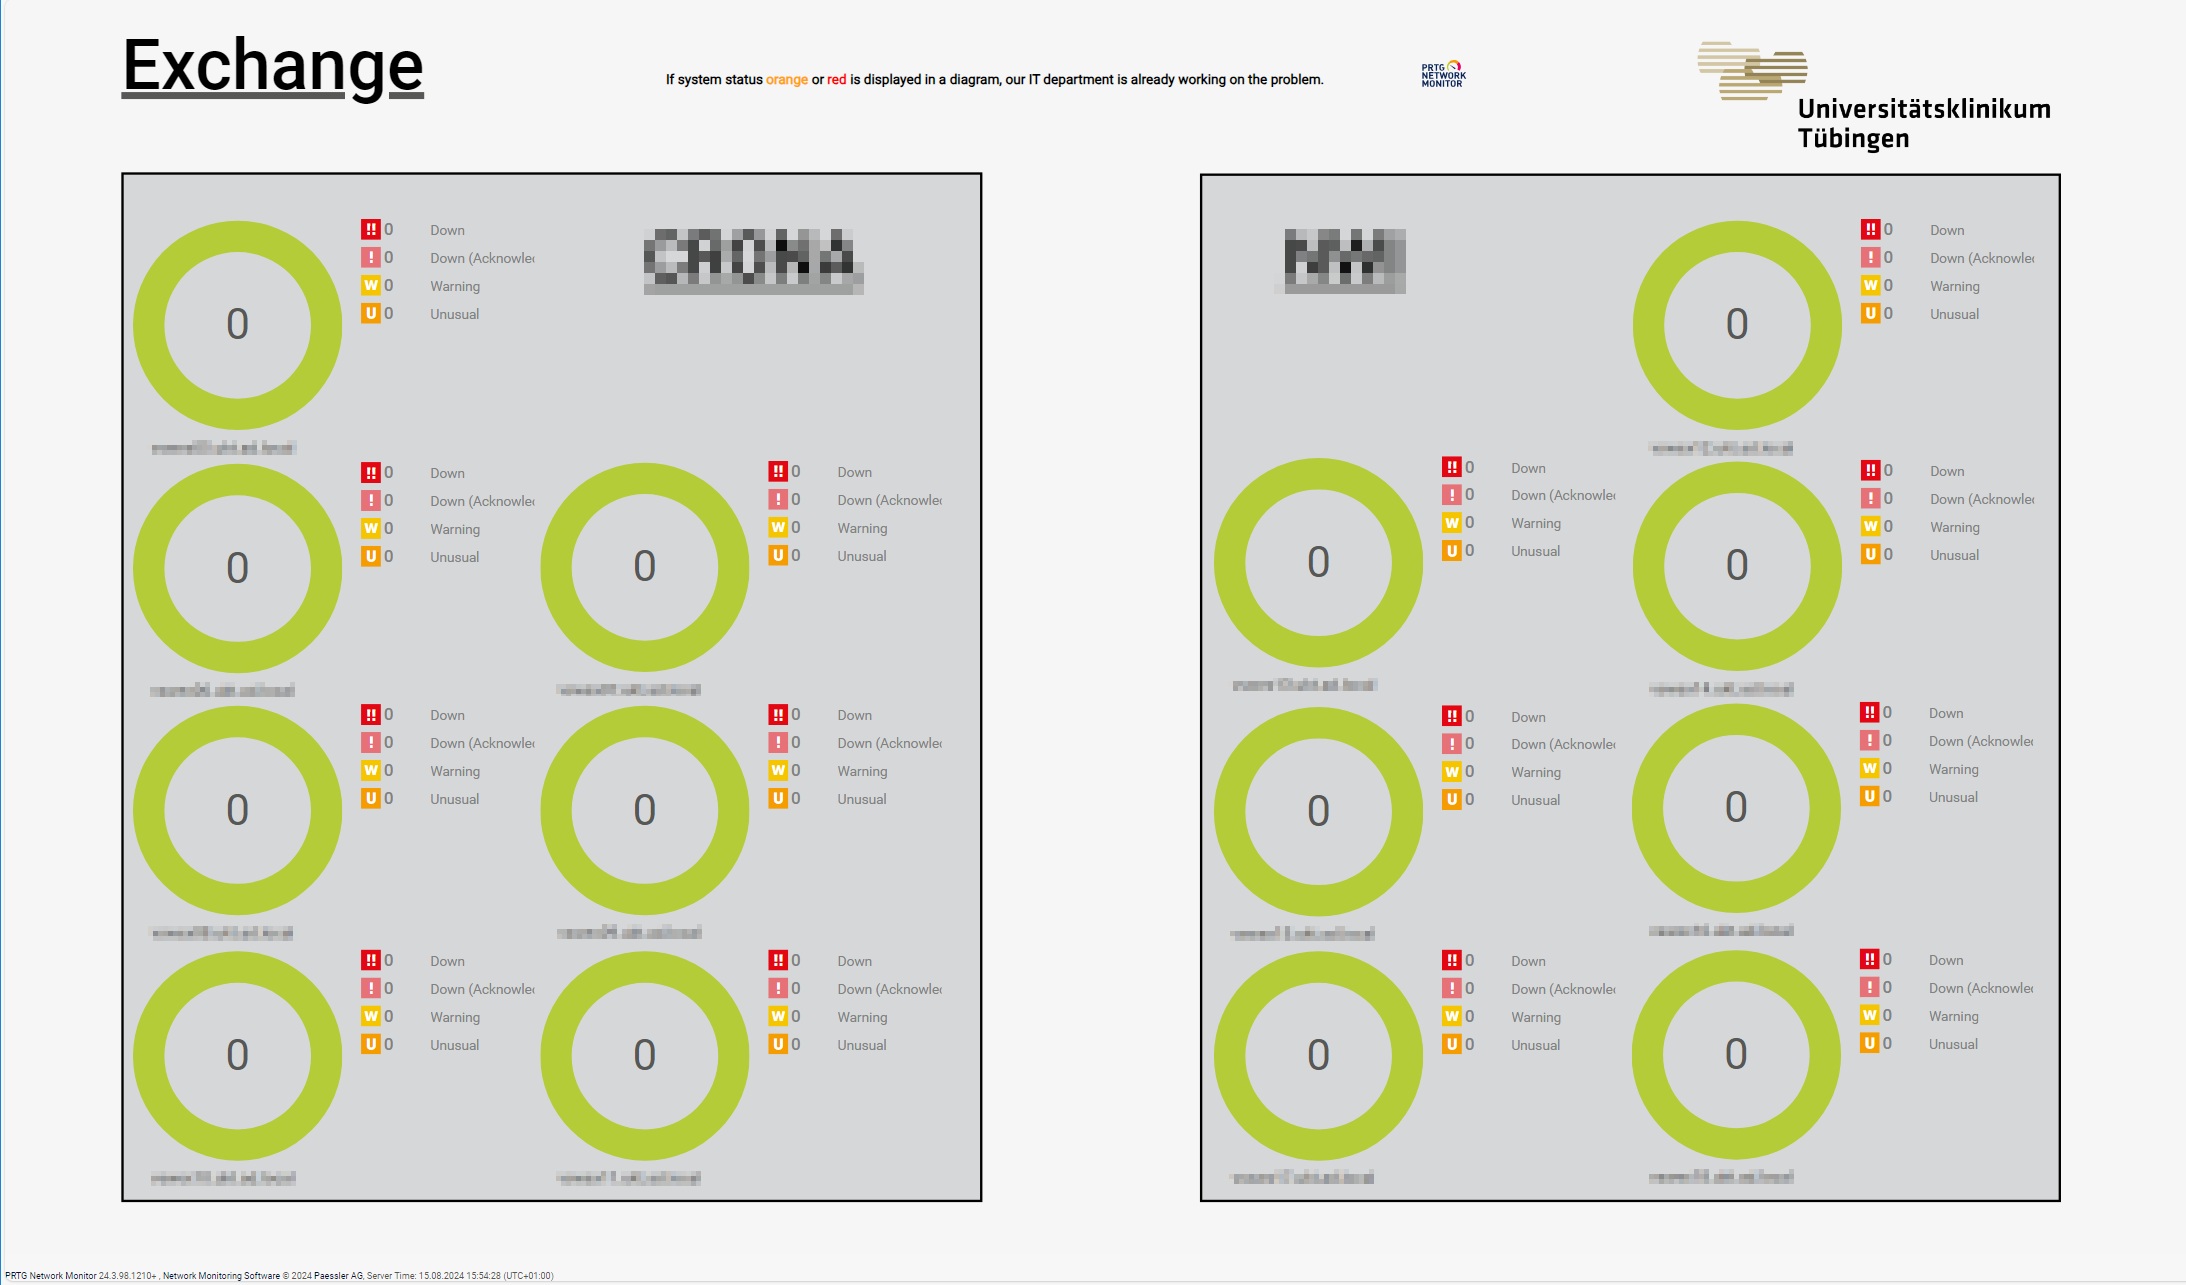
case study tübingen hospital exchange
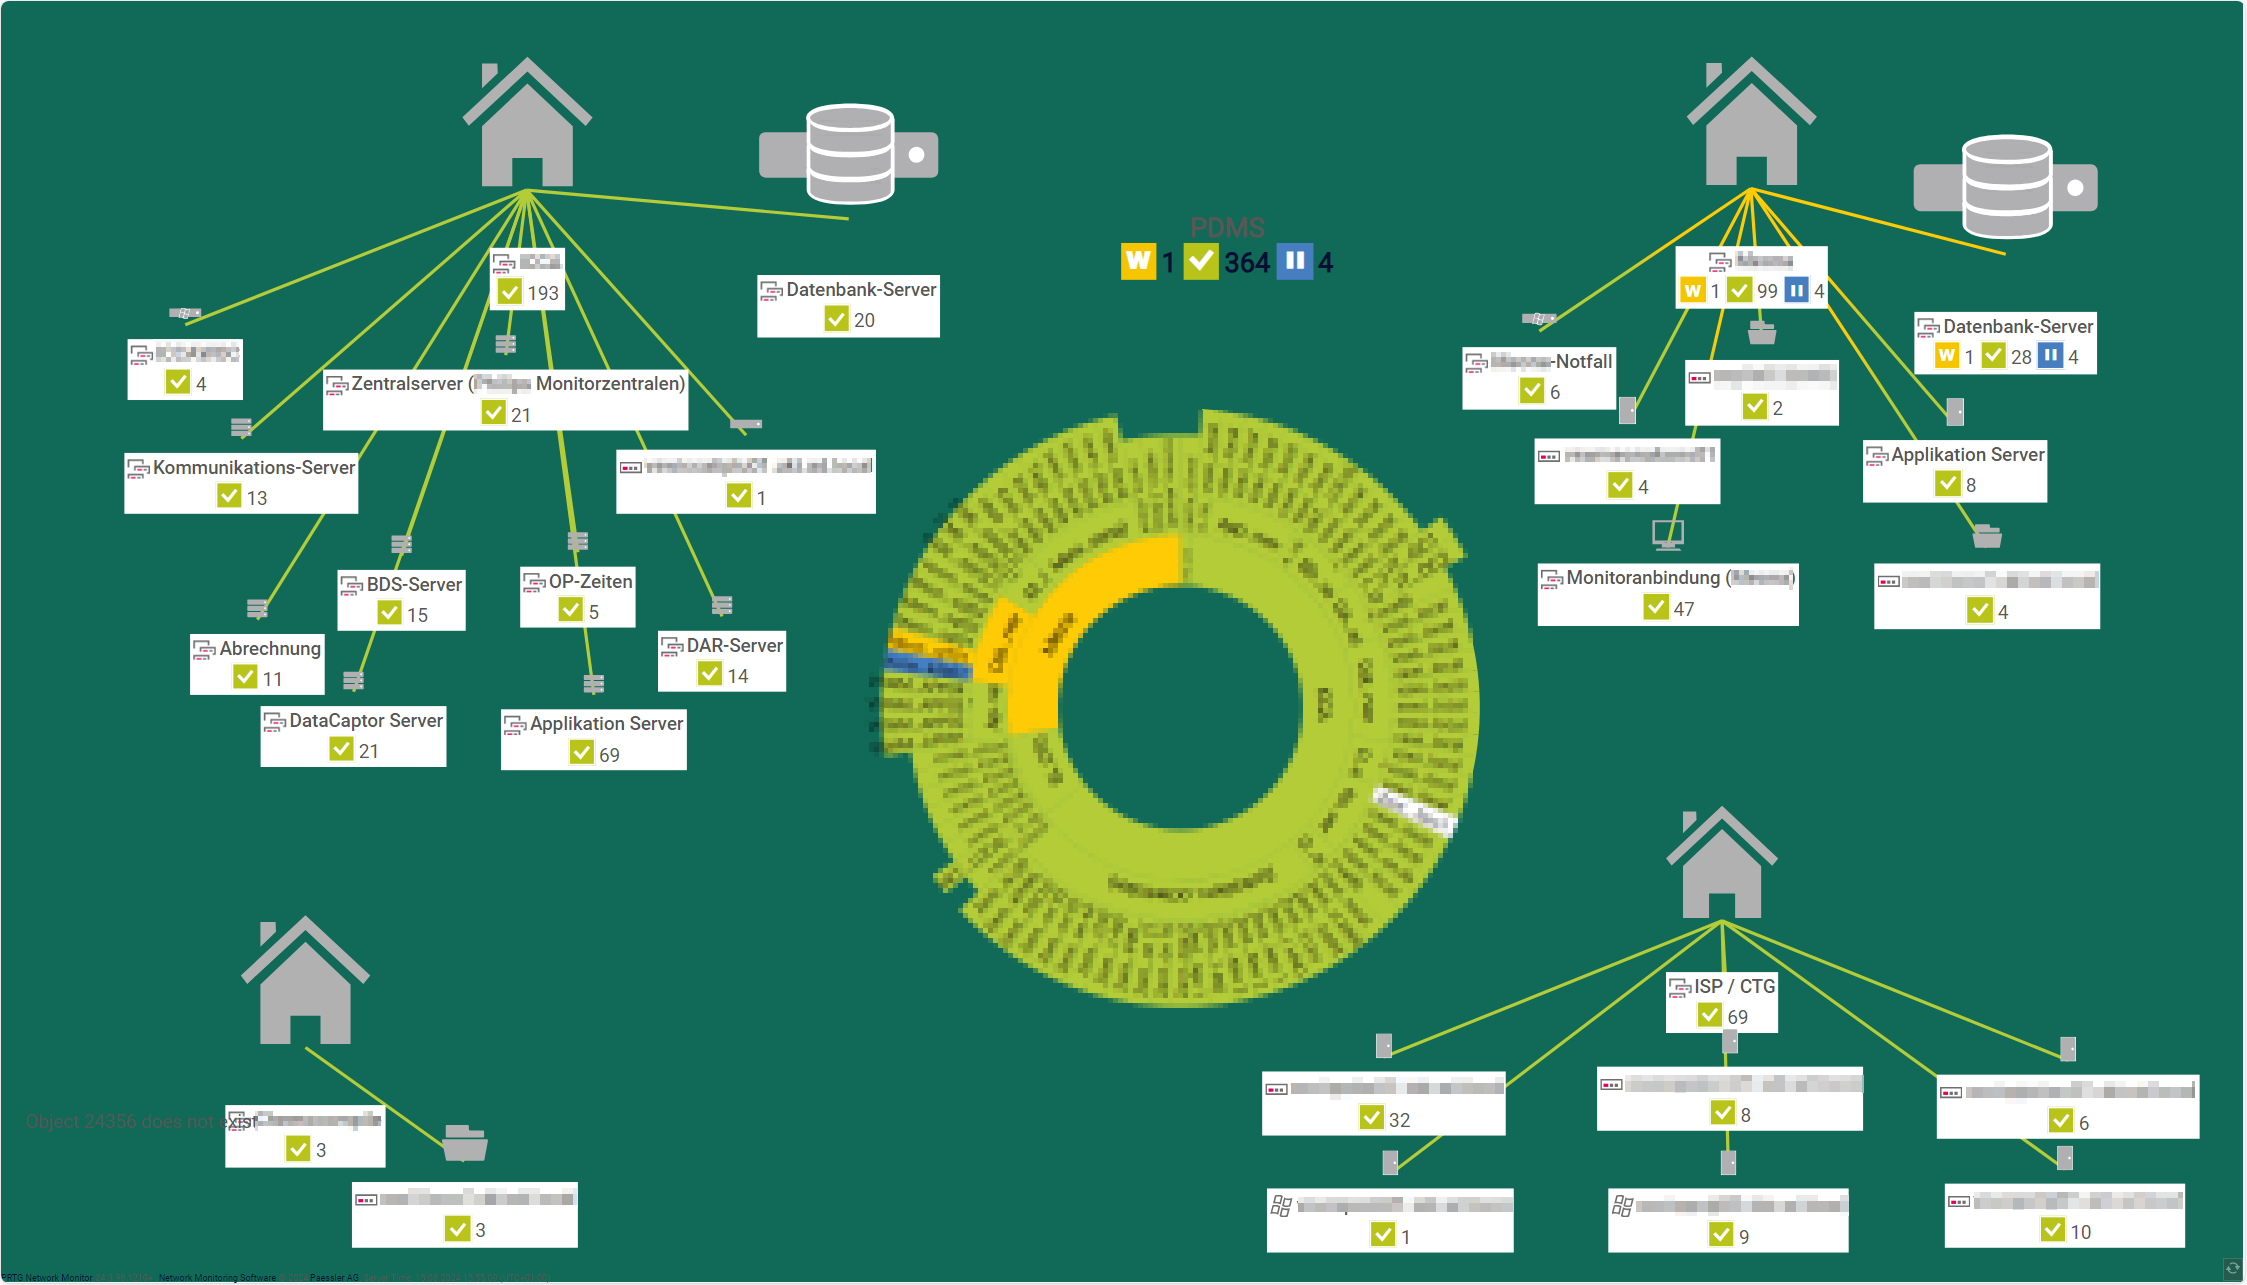
case study tübingen hospital network map
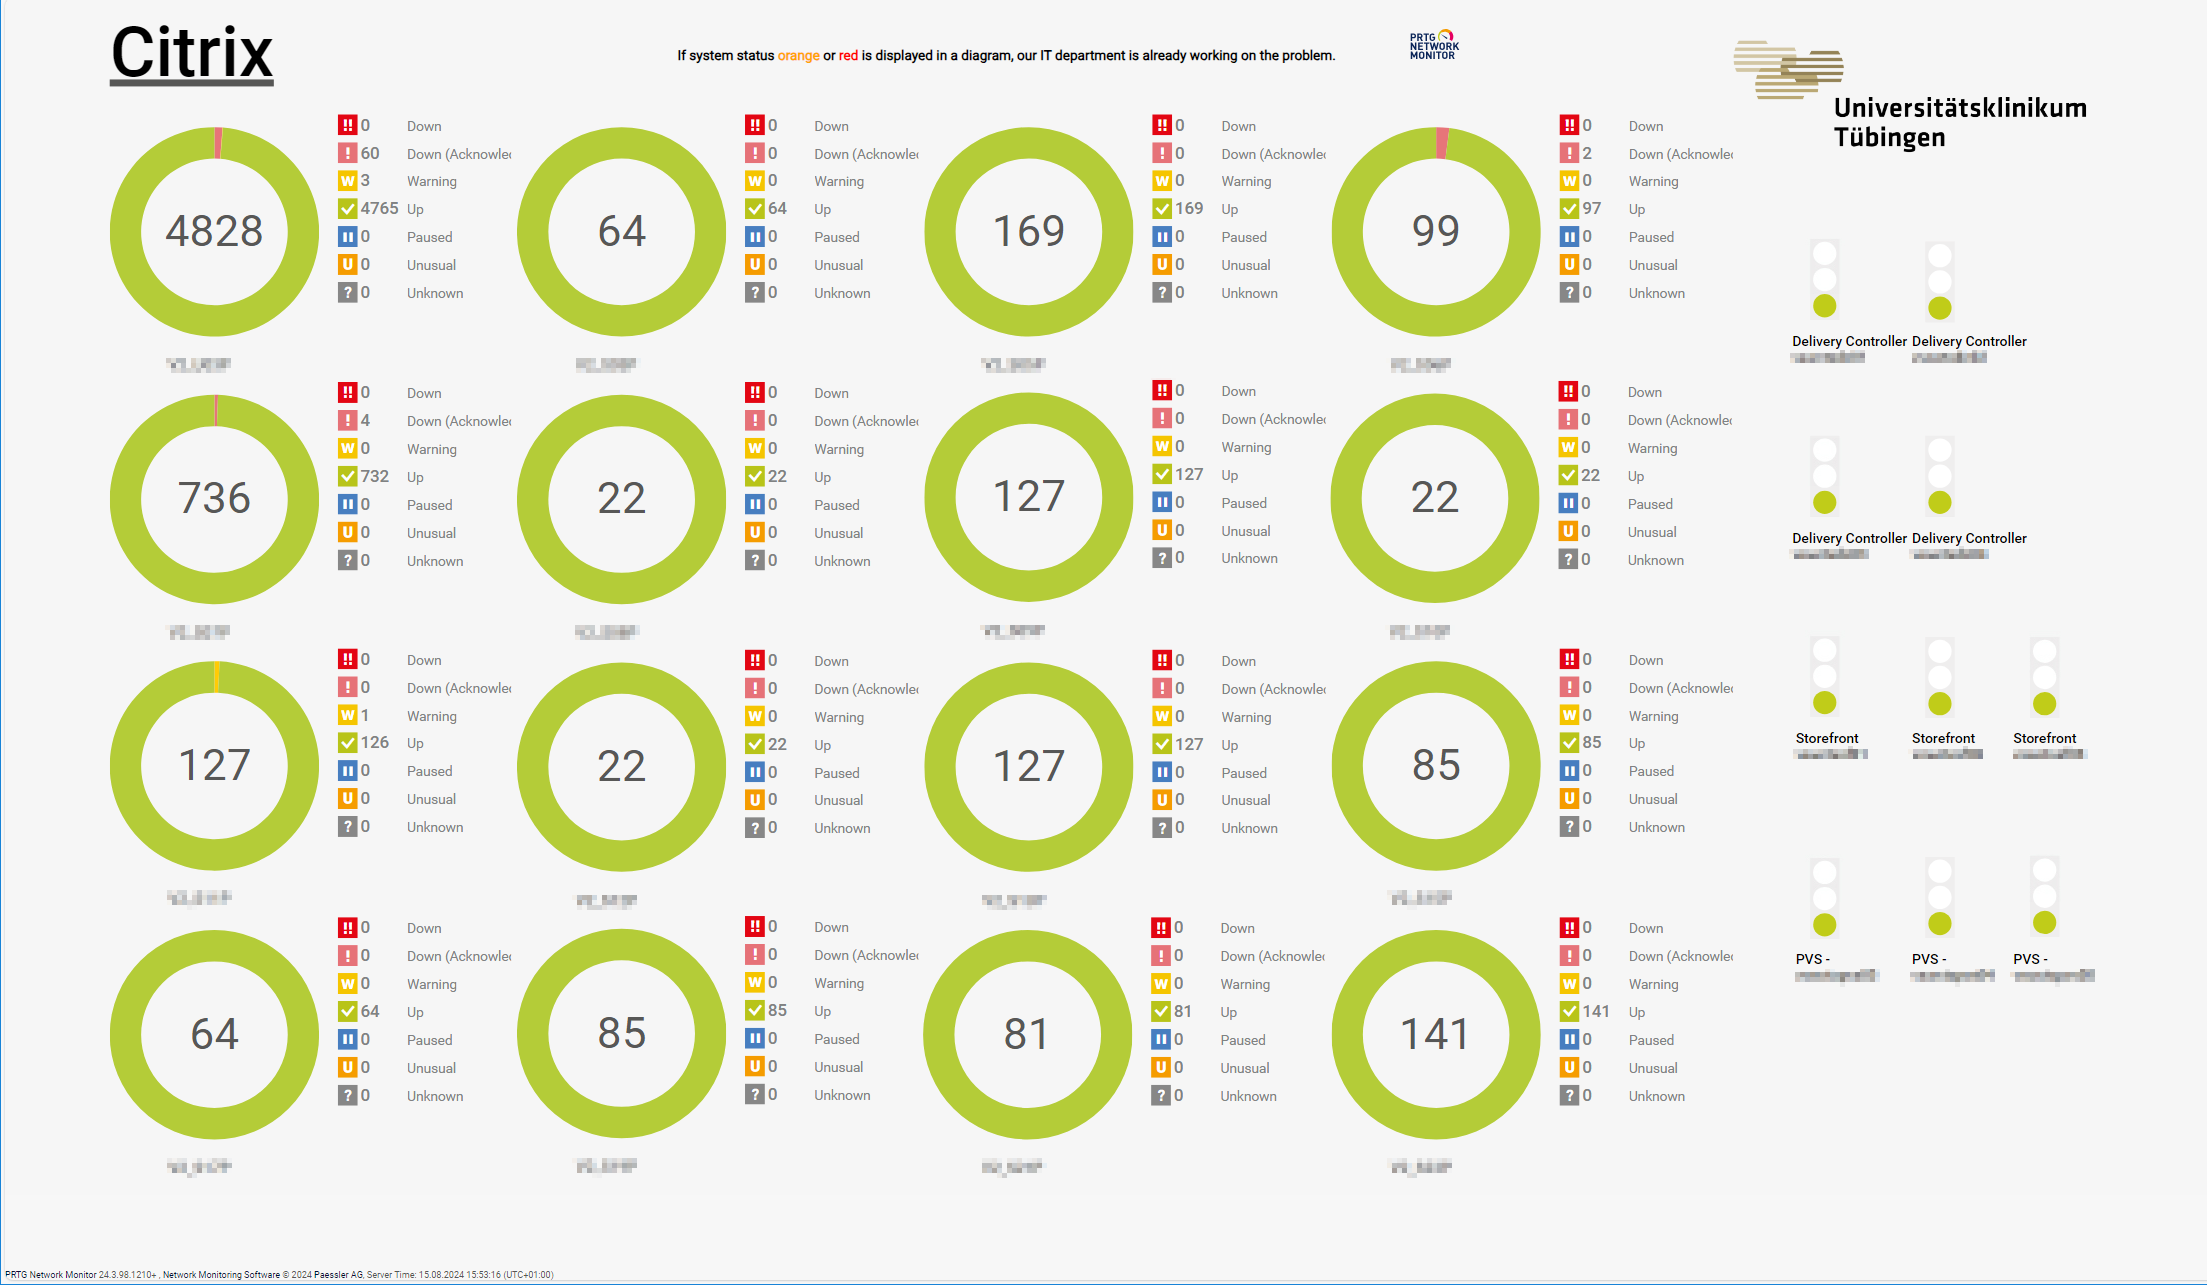
case study tübingen hospital citrix

Discover more monitoring insights and stories

Solution illustration

Solutions for all your monitoring needs

  • Network Monitoring Tool
  • Bandwidth Monitoring
  • SNMP Monitoring
Content illustration

Powerful stories from the monitoring world

  • Customer success stories - Paessler
  • Video: PRTG Network Monitor – Smart Setup
  • Customer success story: Riverford & PRTG
Support illustration

Resources to master your monitoring challenges

  • How can I use the PRTG Application Programming Interface (API)?
  • Understanding Basic Concepts
  • PRTG Apps for Mobile Network Monitoring
Explore All Case Studies

Products

  • Paessler PRTG
    Paessler PRTGMonitor your whole IT infrastructure
    • PRTG Network Monitor
    • PRTG Enterprise Monitor
    • PRTG Hosted Monitor
    • PRTG UVexplorer
    • PRTG extensions
      Extensions for Paessler PRTGExtend your monitoring to a new level
  • Icon Features
    FeaturesExplore all monitoring features

Monitoring with PRTG

  • Network monitoring
  • Bandwidth monitoring
  • SNMP monitoring
  • Network mapping
  • Wi-Fi monitoring
  • Server monitoring
  • Network traffic analyzer
  • NetFlow monitoring
  • Syslog server

Useful Links

  • PRTG Manual
  • Knowledge Base
  • Customer Success Stories
  • About Paessler
  • Subscribe to newsletter
  • PRTG Support
  • PRTG Consulting
  • PRTG Feedback & Roadmap

Contact

Paessler GmbH
Thurn-und-Taxis-Str. 14, 
90411 Nuremberg 
Germany

[email protected]

+49 911 93775-0

  • Contact us
©2026 Paessler GmbHTerms & ConditionsPrivacy PolicyImprintReport VulnerabilityDownload & InstallSitemap
How to buy How to buy How to buy