- English
- Deutsch
- Español
- Français
- Italiano
- Português
A real uptime monitoring tool polls devices and services continuously using the right protocols, delivers alerts the moment something drops, and keeps historical data so you can report on it later. The full stack needs coverage: servers, network devices, VMs, and web-facing endpoints, all in one place. Paessler PRTG does exactly that, from one install, with one dashboard.
Supported technologies: Servers (Windows/Linux) · Routers · Switches · Firewalls · VMs (VMware/Hyper-V) · Cloud services (AWS, Azure) · DNS · SMTP · TCP endpoints · HTTP/HTTPS · SSL certificates

PRTG continuously polls your devices and services and sends a notification the moment something stops responding, so the right person gets alerted before anyone else notices. Alert routing is configurable per device, group, or severity level, which means the network team gets network alerts and the server team gets server alerts, not everyone gets everything. If the first notification doesn't reach anyone, escalation contacts can be set to kick in after a defined delay. The result is a structured alert chain that works without manual coordination.
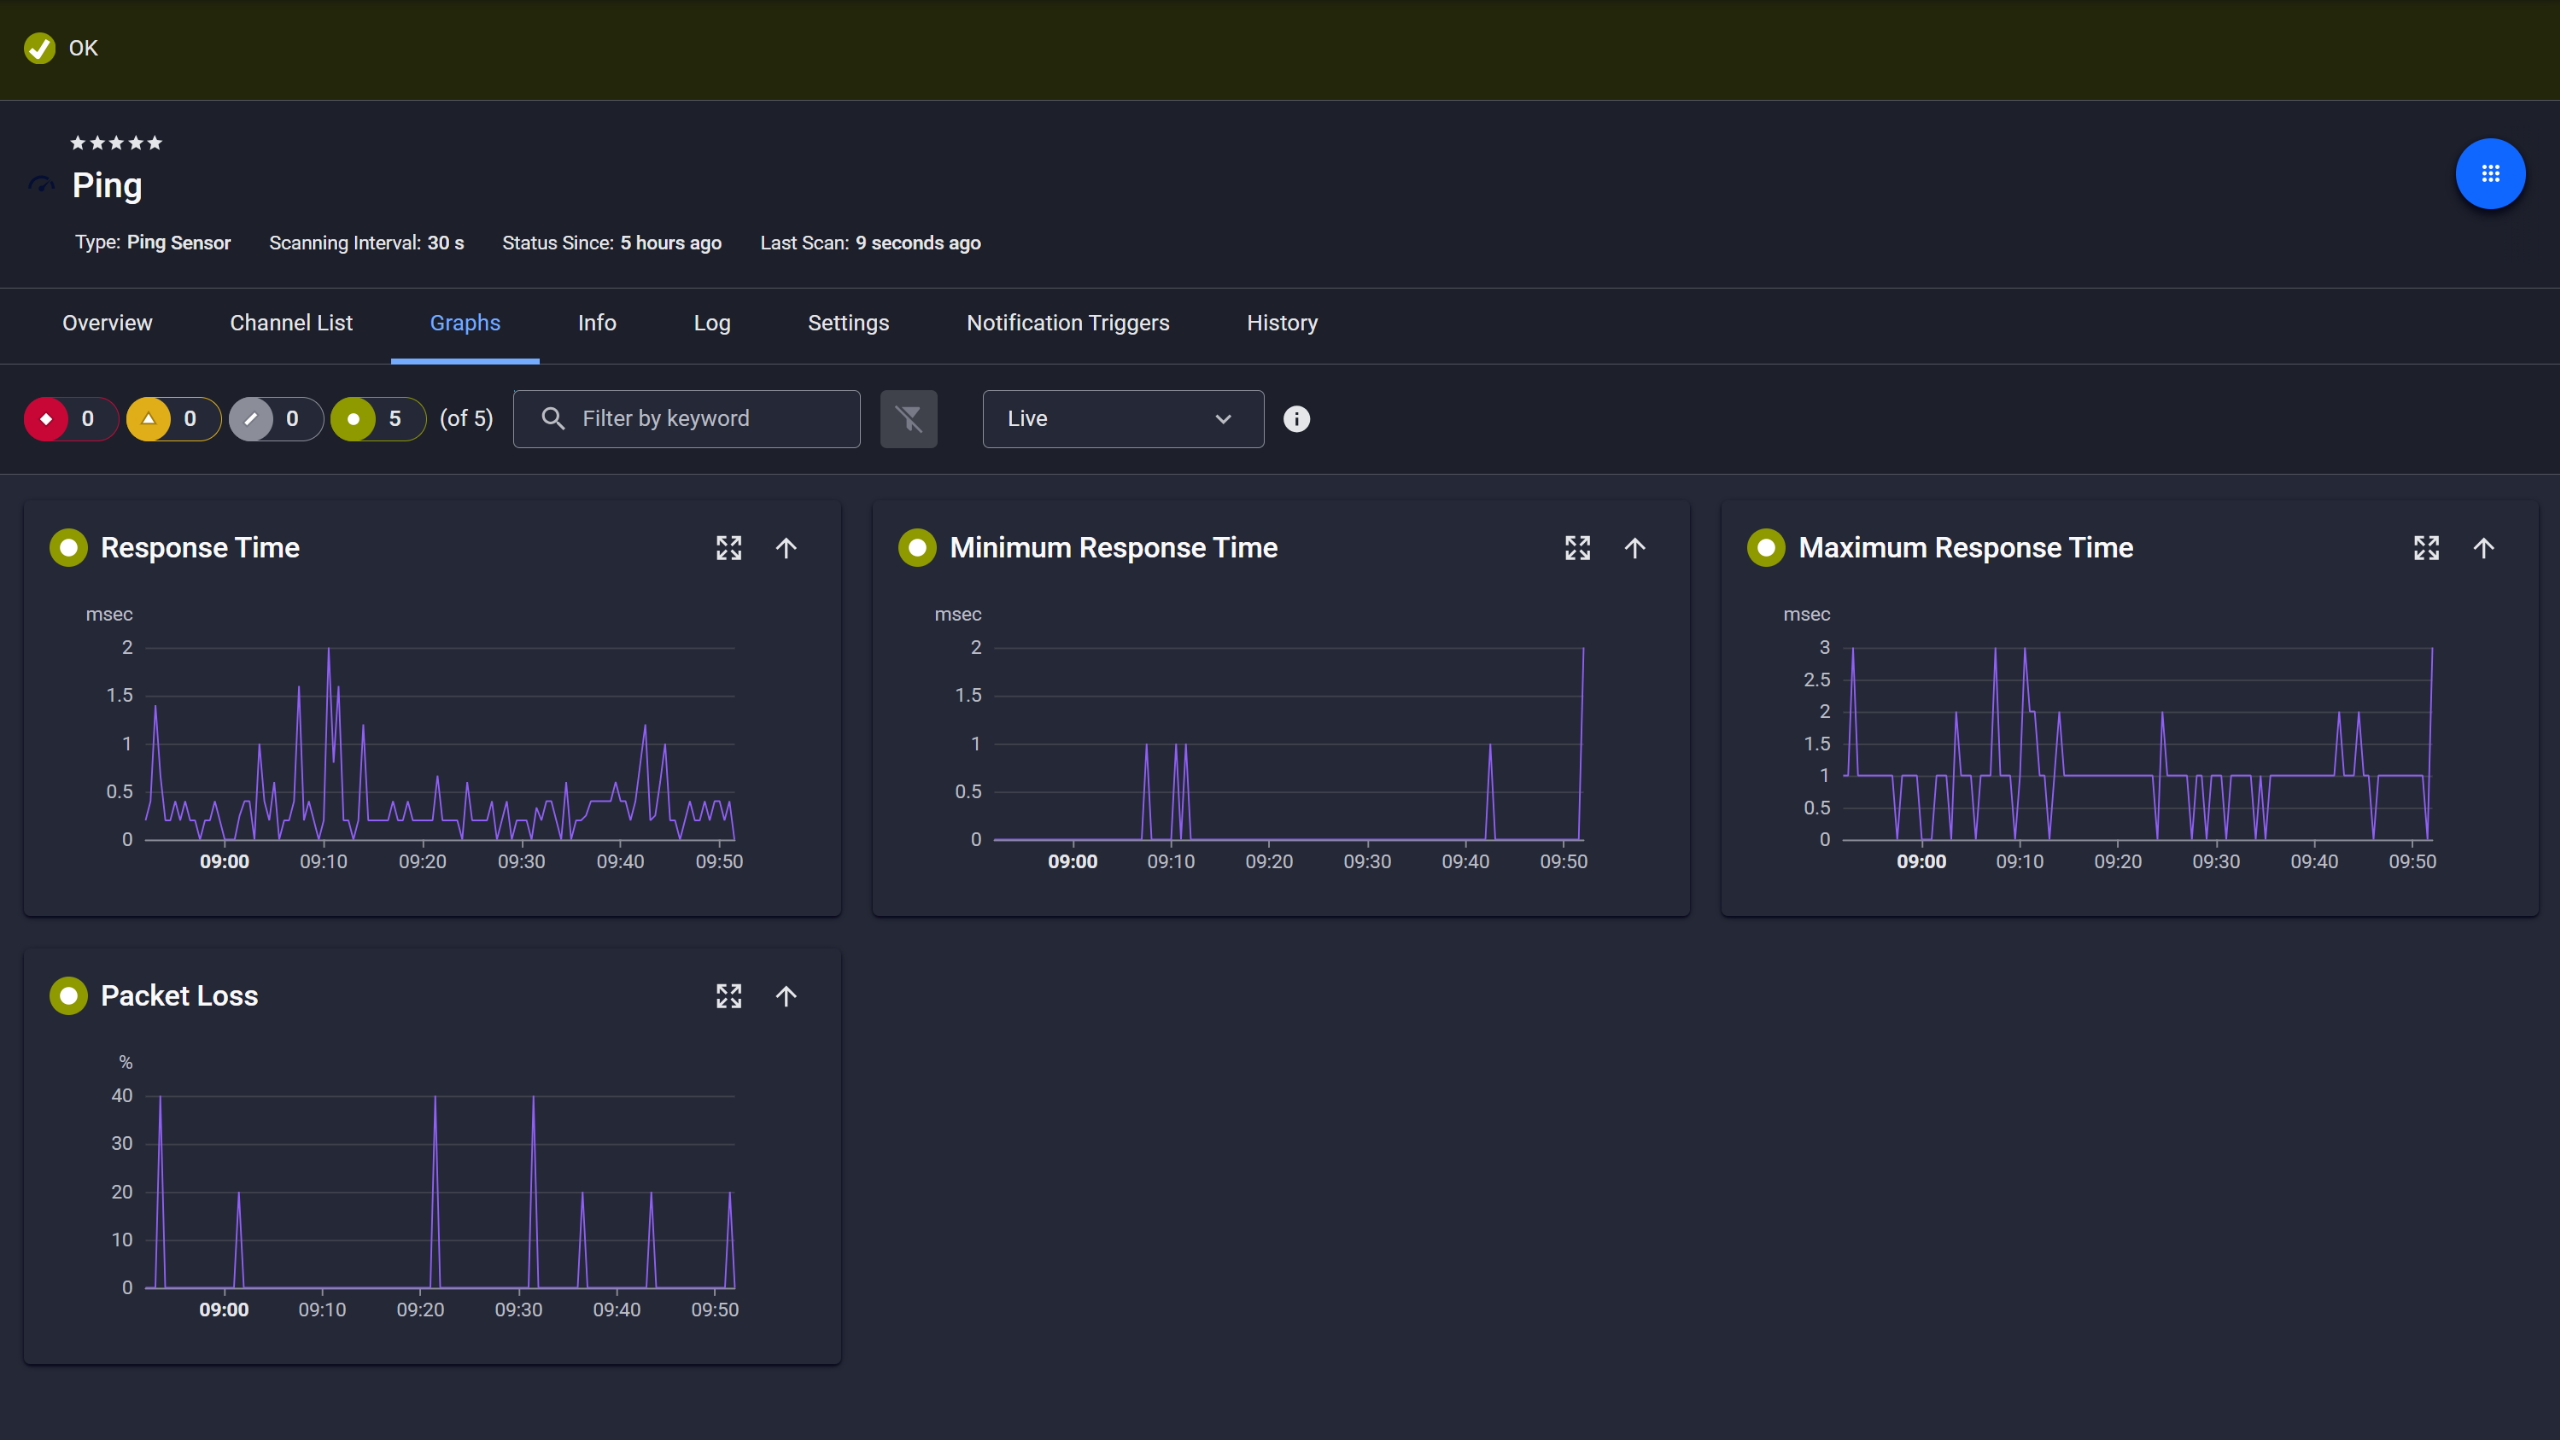
Ping response and packet loss
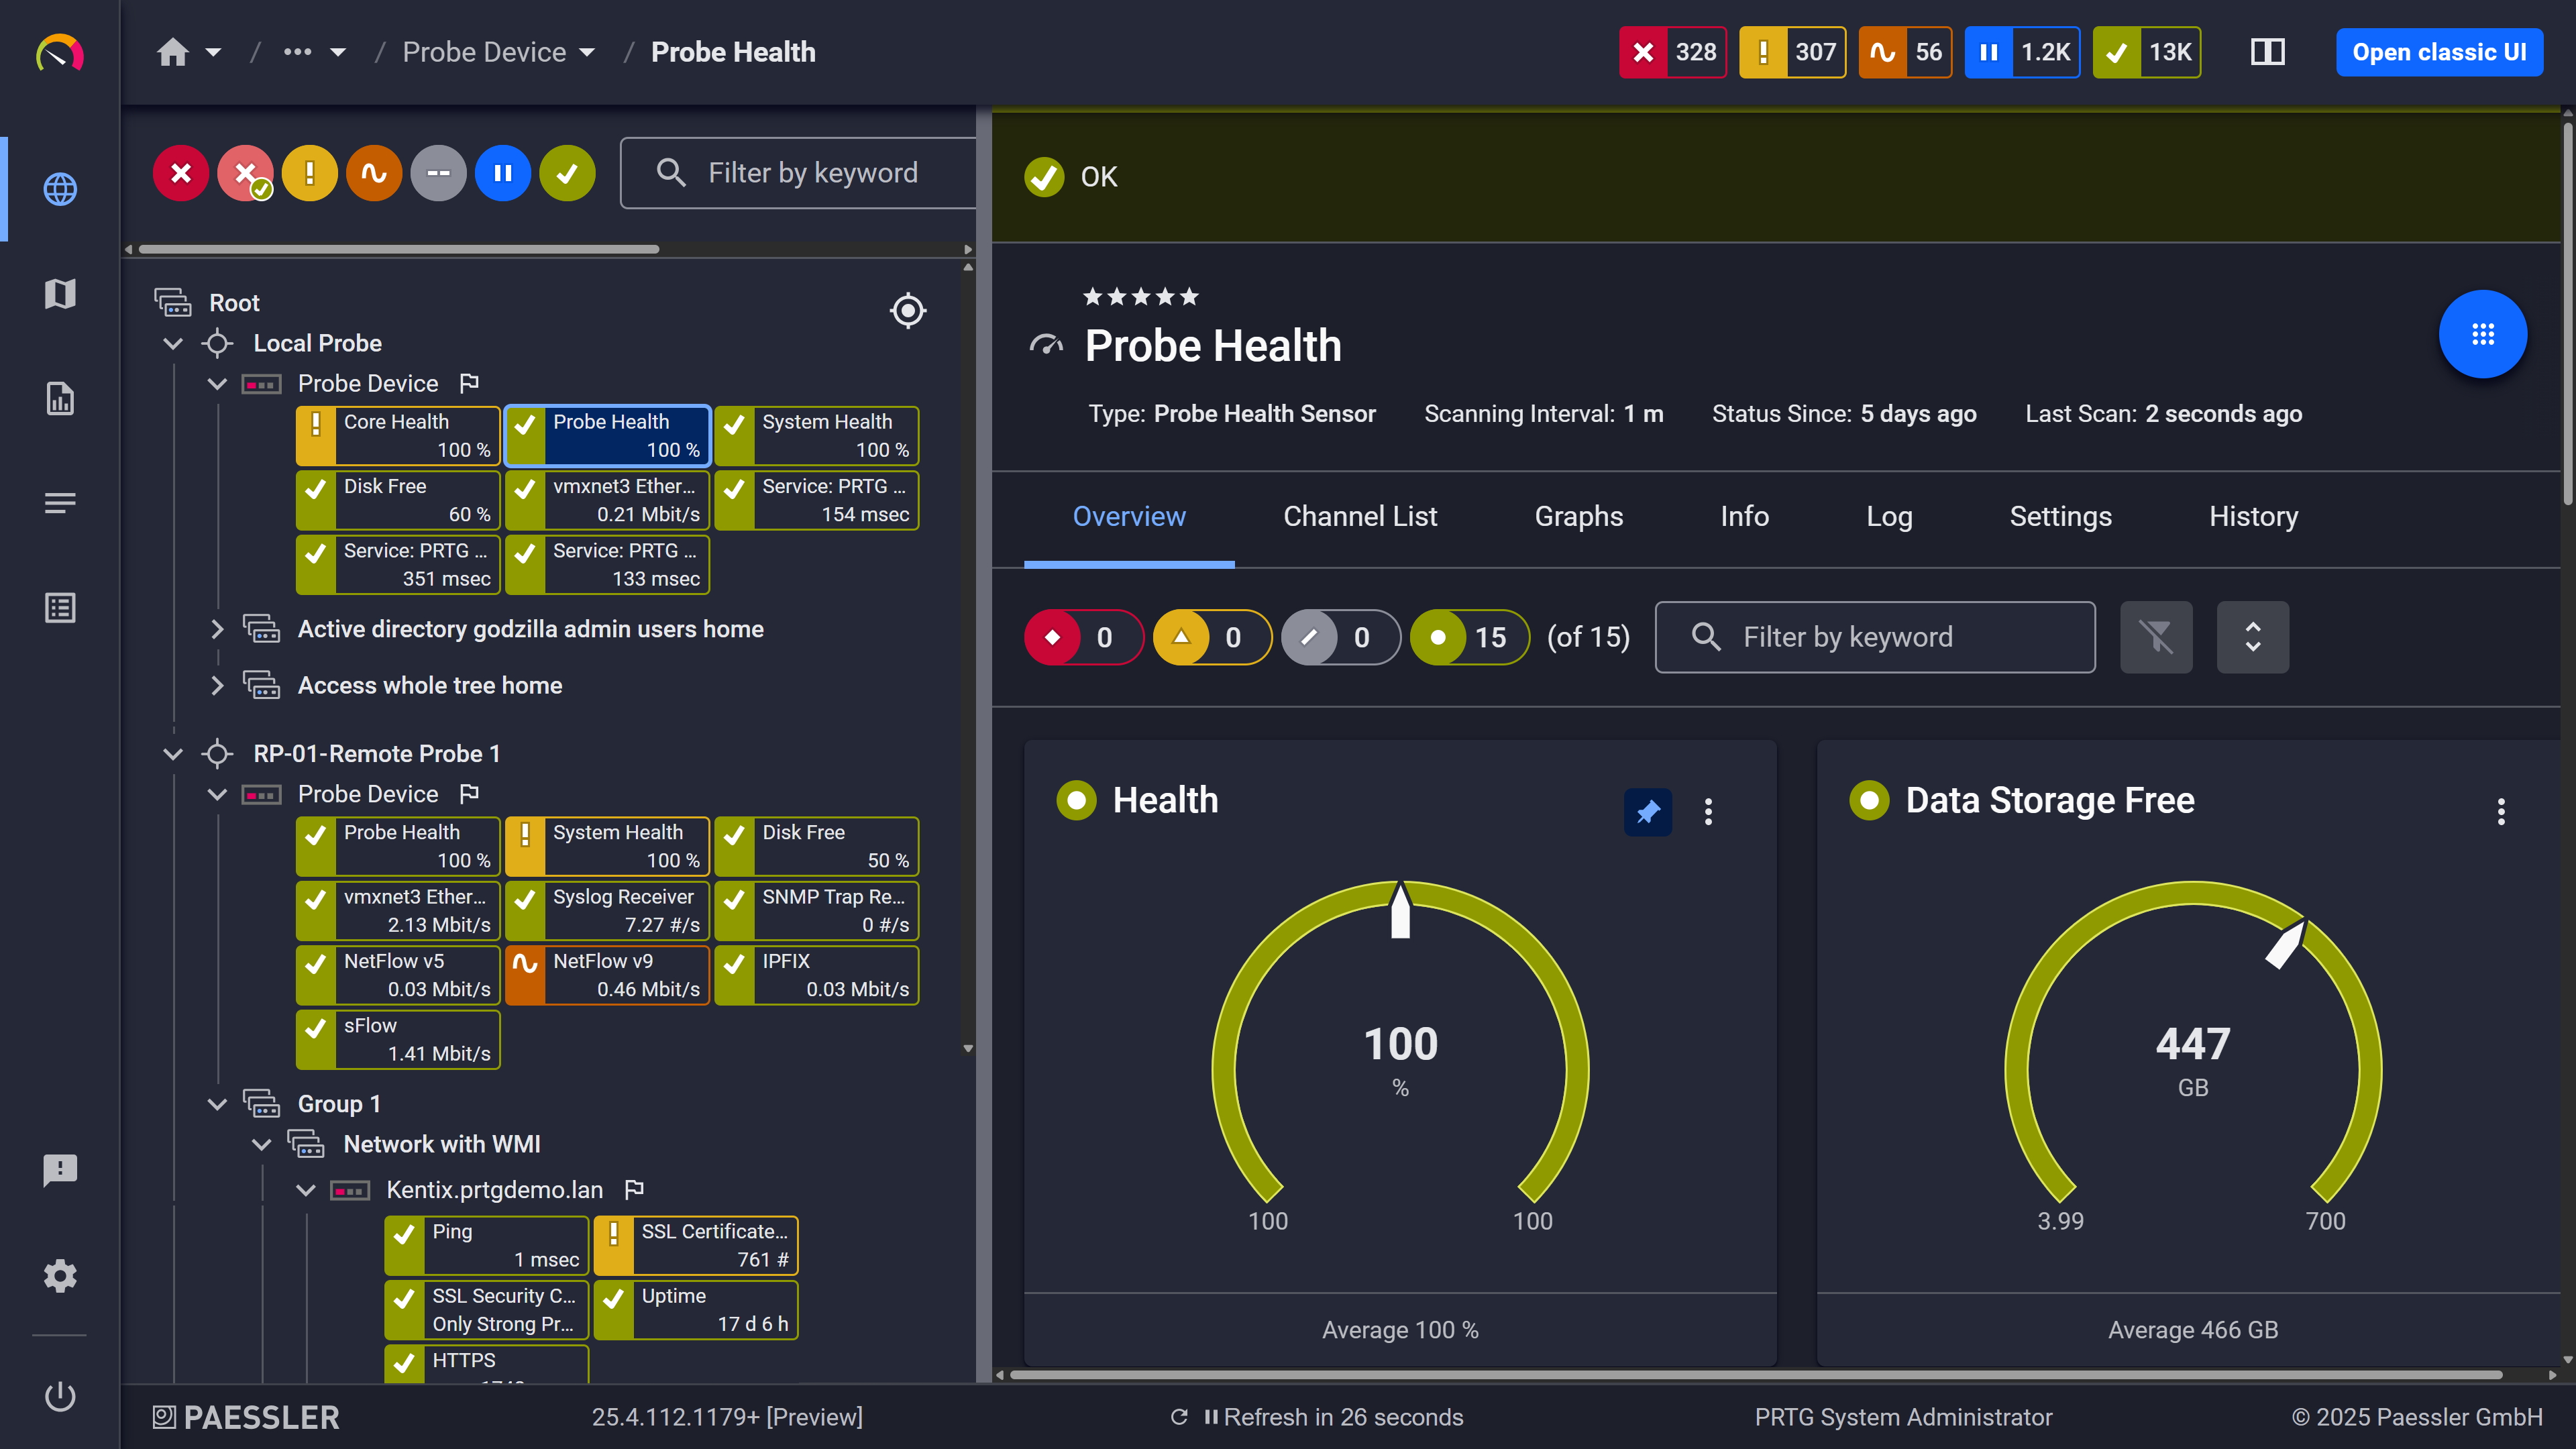
Probe health at a glance

Live graphs, real-time performance data
Windows servers, Cisco switches, Linux systems, VMware, a few things in Azure. Keeping all of that in a single monitoring solution is the hard part. PRTG handles it through auto-discovery and device templates for major vendors. No extra software to install on monitored devices, minimal manual entry. Also auto-discovery runs on a schedule, so devices added to a monitored IP range get picked up automatically without anyone touching the configuration. One dashboard, no blind spots from tool fragmentation.
Start monitoring your infrastructure in minutes. No professional services, no complex configuration, no risk.
PRTG logs sensor states over time with timestamps, based on configured scanning intervals, starting when a sensor becomes active. No separate logging configuration, no manual export schedule. That gives you the raw data for post-mortems, SLA documentation, troubleshooting, and incident management without anyone manually tracking anything. Availability records are there on demand, whether for a routine management review, an audit, or an incident debrief. The data is structured, timestamped, and ready whenever it's needed.

Scheduled reports, always on time
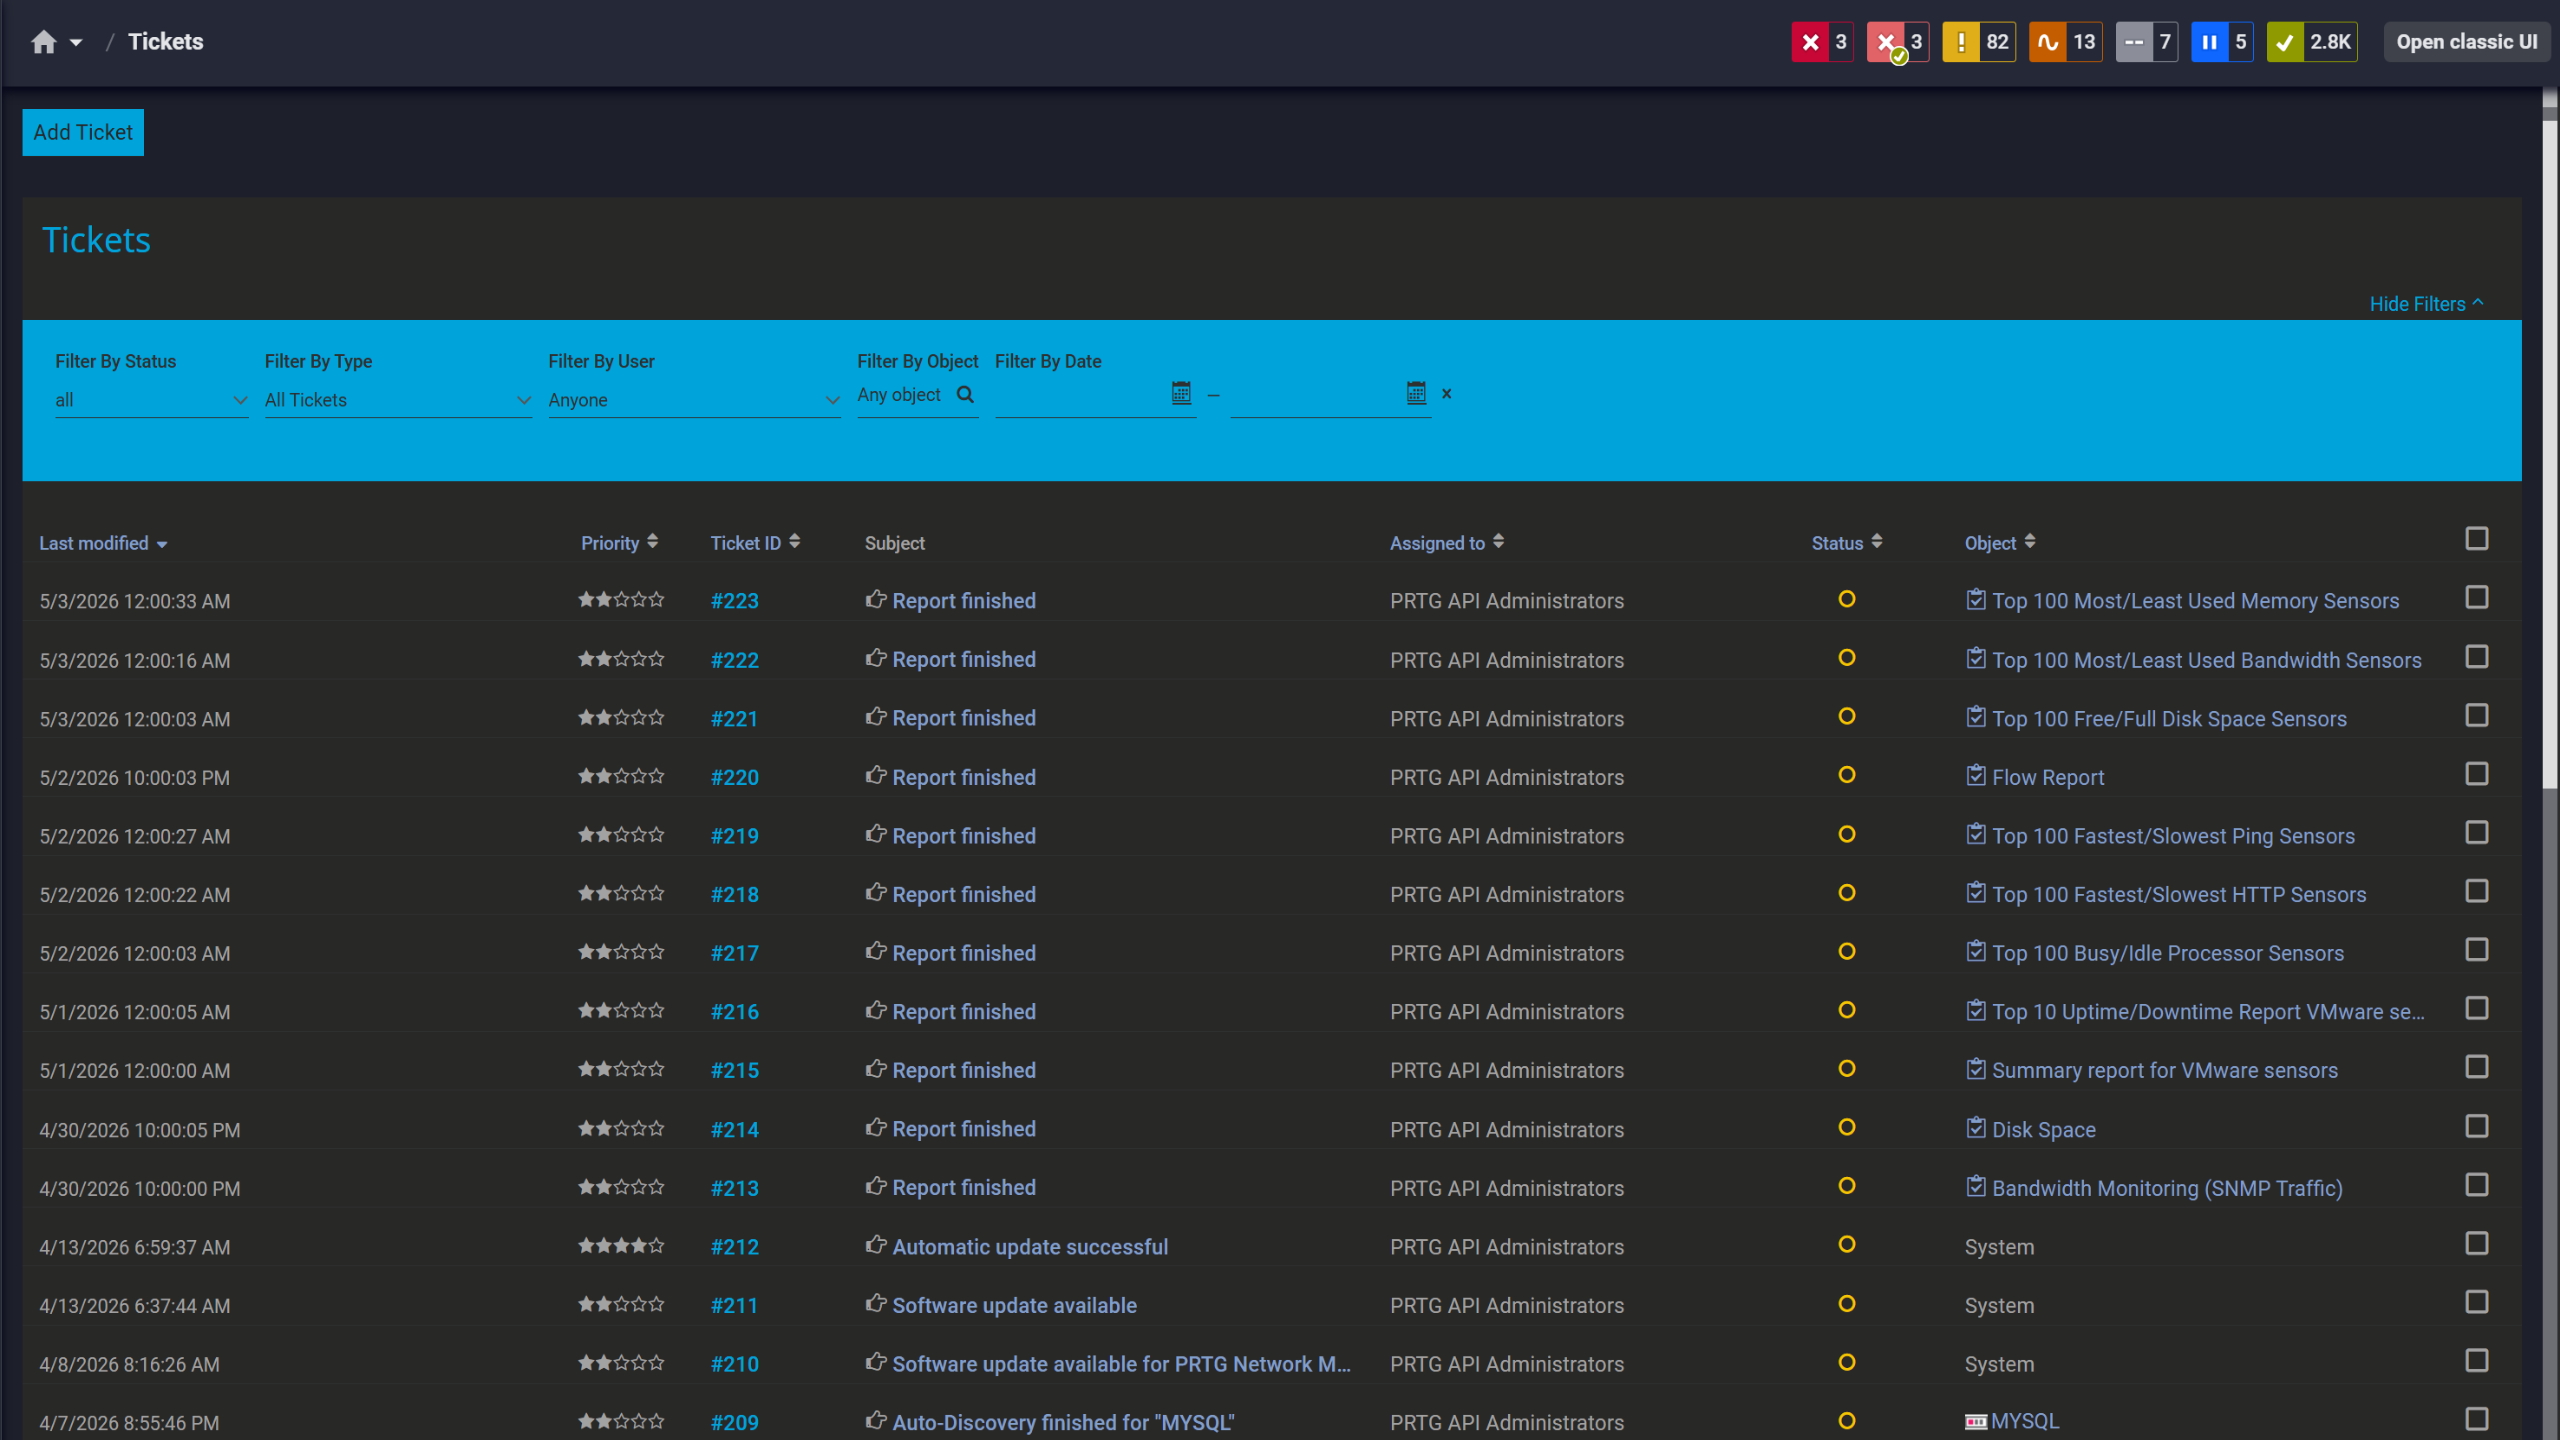
Tickets keep your team aligned
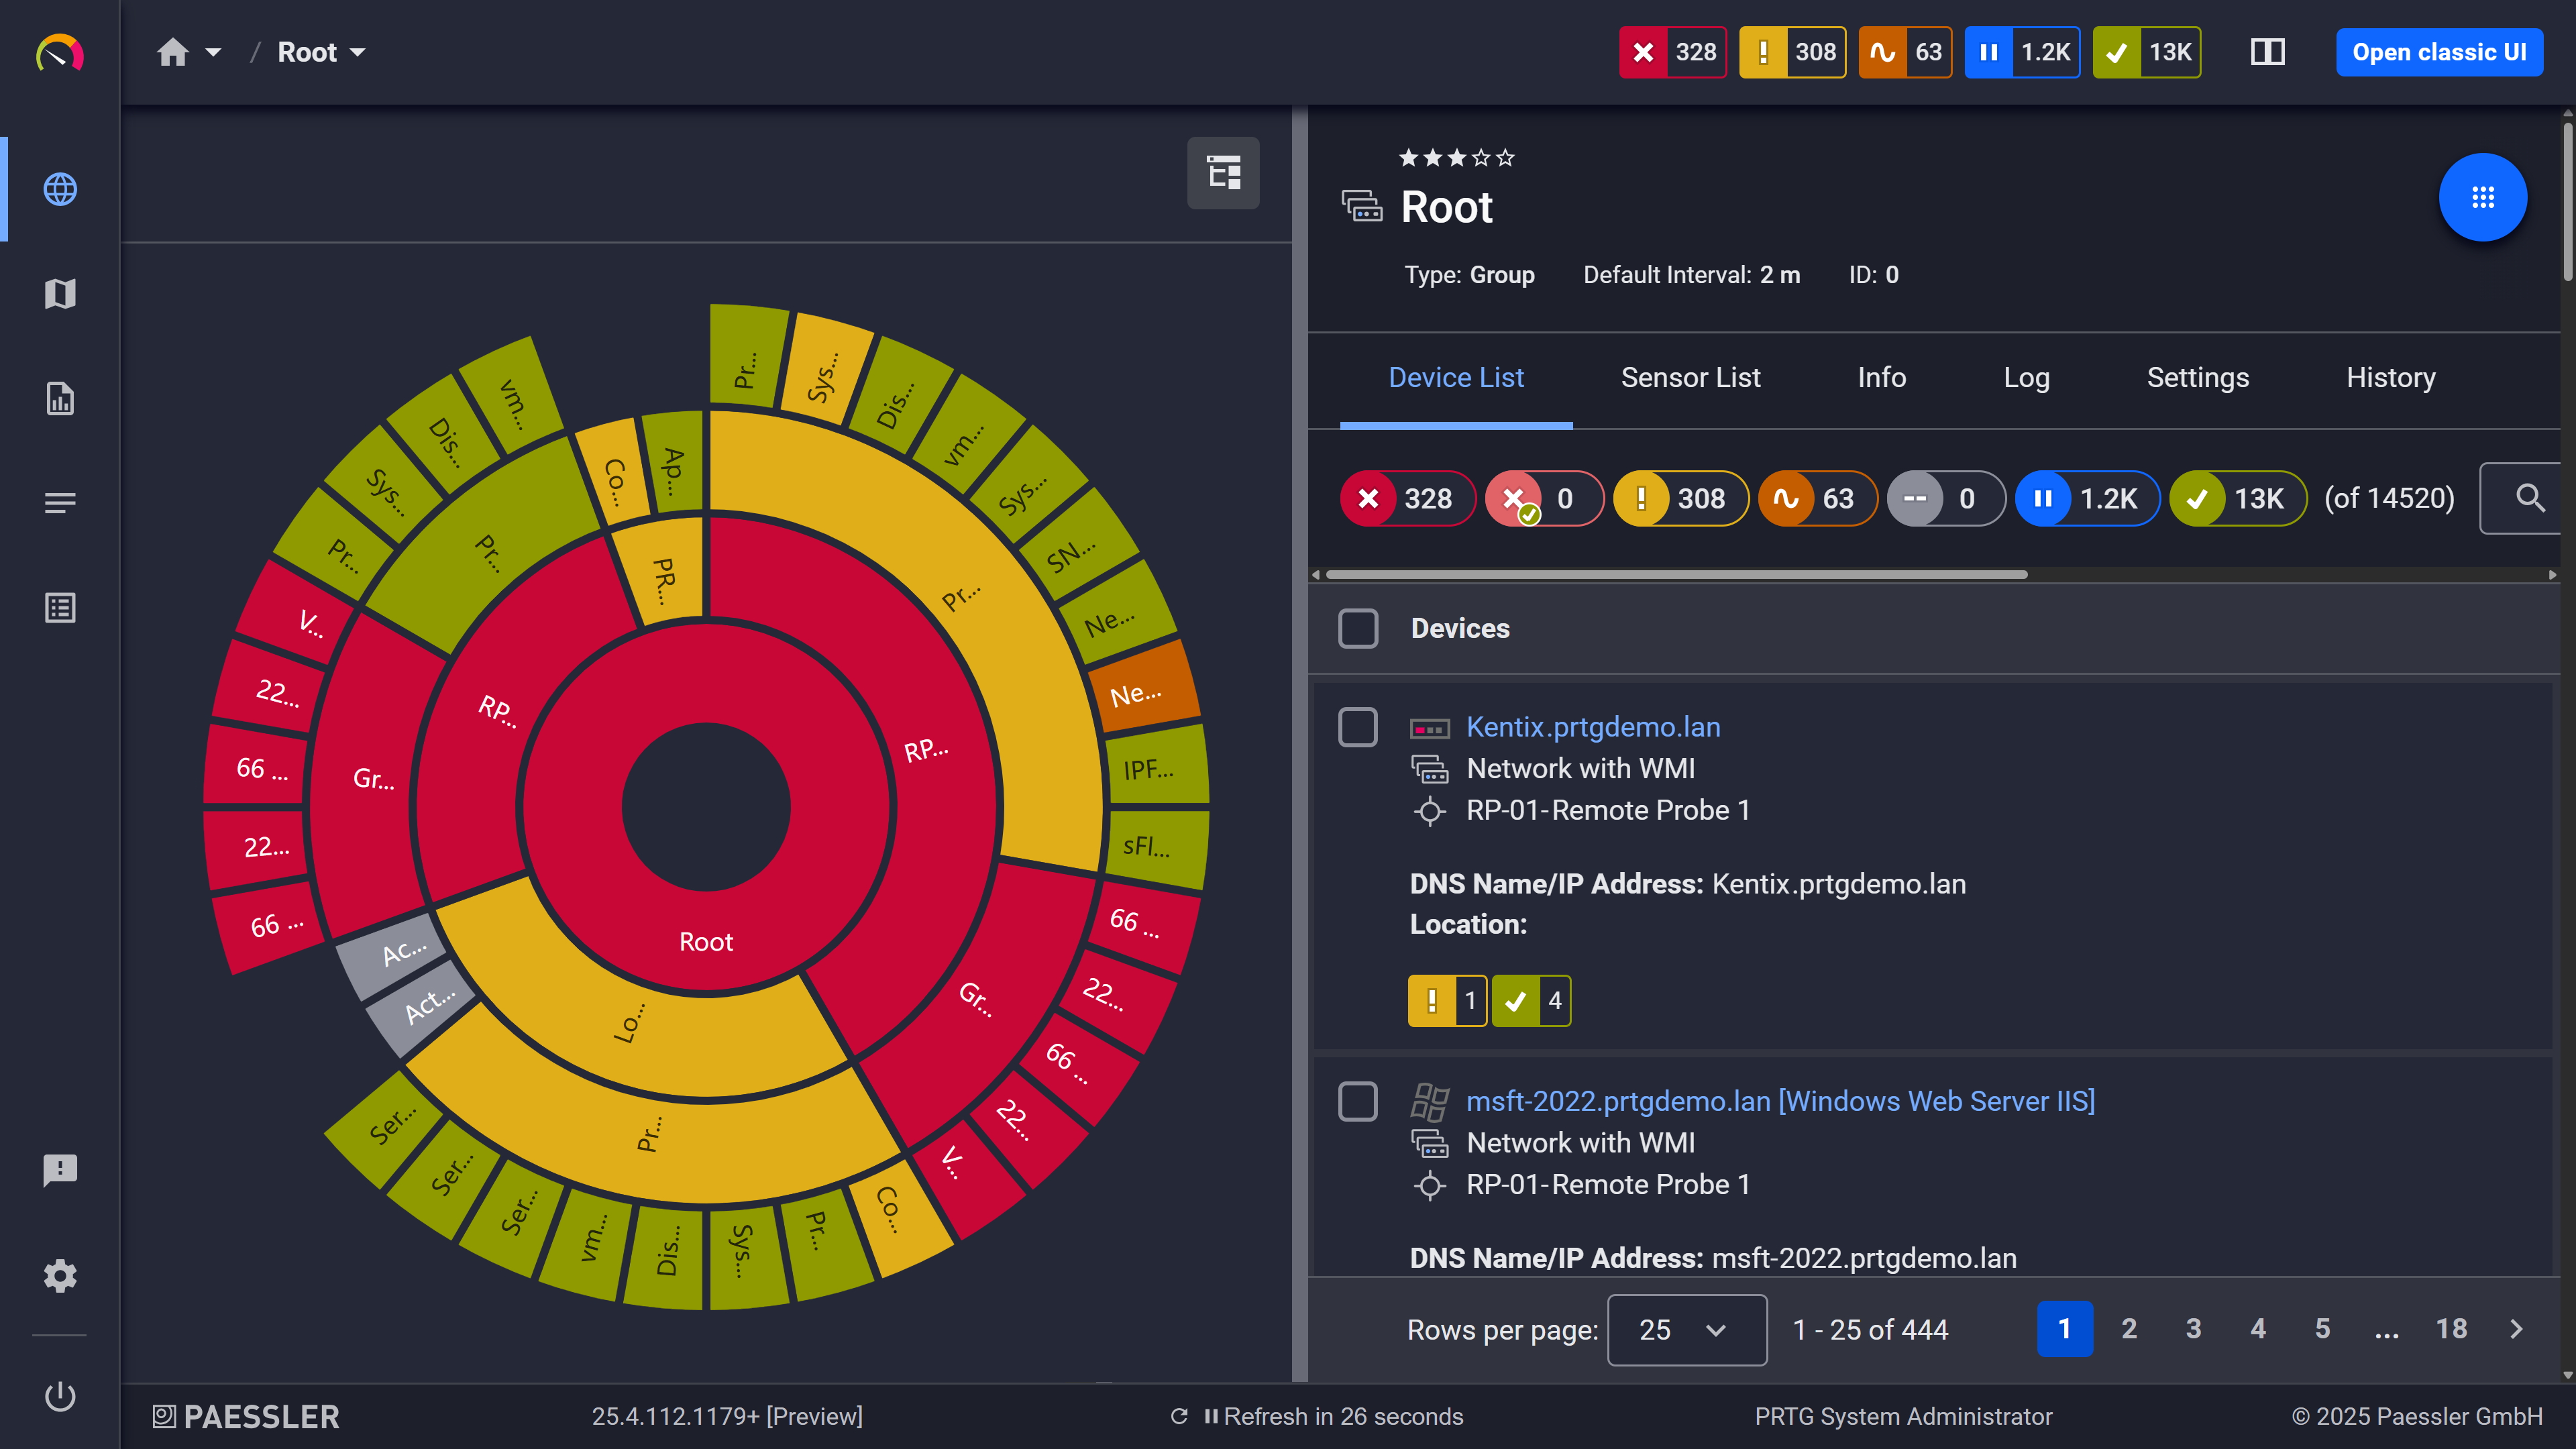
Your entire network, visualized instantly
A device that reboots every three weeks looks like a one-off until you have the trend data. PRTG stores response times, latency, packet loss, and availability continuously. Thresholds work in two tiers: a warning level fires before the metric hits the error level, giving you an early signal while there's still time to act. That's how you catch a metric drifting consistently before it becomes an incident, with enough lead time to investigate and resolve it on your terms.
PRTG covers device reachability, system uptime, service availability, and web health checks through purpose-built sensors. Learn more about how these sensors help you achieve your uptime goals.
Capability | Without PRTG Without PRTG | With PRTG With PRTG |
|---|---|---|
Downtime detection | Without PRTG User reports it via helpdesk | With PRTG Detected within one polling cycle, notification sent automatically |
Multi-protocol coverage | Without PRTG Separate tool per device type | With PRTG SNMP, WMI, ICMP, TCP: one installation |
Availability history | Without PRTG Manual extraction from logs or tickets | With PRTG Stored automatically, reportable per device or group |
Alert routing | Without PRTG Manual call/email chains | With PRTG Configured per device, severity, or schedule |
New device coverage | Without PRTG Manually added to each tool | With PRTG Auto-discovery scans IP range and adds sensors |
Reporting and workflows | Without PRTG Manual, disconnected | With PRTG Automate reports, export data, scheduled delivery |
Choose the PRTG Network Monitor subscription that's best for you.
| License Name | License description | Price | License Details | Get started | Pricing Details | |
|---|---|---|---|---|---|---|
| PRTG 500 | $200 | per month paid annually | Buy nowBuy now | Enough to monitor multiple aspects of 50 devices | ||
| PRTG 1000 | $358 | per month paid annually | Buy nowBuy now | Enough to monitor multiple aspects of 100 devices | ||
| PRTG 2500 | $742 | per month paid annually | Buy nowBuy now | Enough to monitor multiple aspects of 250 devices | ||
| PRTG 5000 | $1,300 | per month paid annually | Buy nowBuy now | Enough to monitor multiple aspects of 500 devices | ||
| PRTG 10000 | $1,642 | per month paid annually | Buy nowBuy now | Enough to monitor multiple aspects of 1000 devices |

Practically speaking, they mean the same thing: is this device, service, or endpoint reachable, or not? Uptime monitoring refers to continuous polling for status. Availability monitoring can extend to include uptime percentages, SLA reporting, and historical trends, and in PRTG, both run on the same sensor infrastructure. The uptime data feeds directly into availability reports, so there's no separate setup for that.
ICMP via the Ping v2 sensor, SNMP via the SNMP Uptime v2 sensor, WMI via the Windows System Uptime Sensor, and TCP via the Port and Port v2 sensors. Dedicated SMTP and DNS sensors handle service-level checks; HTTP and HTTPS sensors cover website availability. Most work out of the box once you add a device and configure the relevant credentials.
Yes, through remote probes, lightweight components installed at remote sites that report back to the central PRTG server. Each probe monitors local devices independently, so distributed monitoring works even across network boundaries or limited WAN connections. This is the standard approach for organizations running infrastructure across multiple offices, branches, or sites, and it works well for that.
PRTG has native sensors for AWS (via CloudWatch) and Azure. For other SaaS services and custom API endpoints, the REST Custom sensor can monitor REST APIs by querying an endpoint and mapping JSON/XML responses to channels. This typically requires a REST configuration file and may require additional setup depending on authentication and response structure. For simpler checks, HTTP and HTTPS sensors work against any web-accessible endpoint without additional configuration.
100 sensors, no time limit, no credit card required. That covers uptime monitoring across your most critical devices, services, and endpoints. Pricing scales by sensor count as your environment grows, with no feature gating between tiers.
UptimeRobot is a hosted uptime monitoring service built around external website checks from the cloud. PRTG installs in your own environment and covers servers, network devices, VMs, cloud services, and websites from a single platform. Where UptimeRobot tells you a URL is down, PRTG can tell you which device, service, or port caused it. SNMP, WMI, ICMP, TCP, HTTP, API monitoring, historical reporting: it's a broader infrastructure monitoring solution for teams who need visibility into what's affecting user experience, not just whether a URL responds.
Network Monitoring Software – Version 26.1.116.1532 (February 9th, 2026)
Download for Windows and cloud-based version PRTG Hosted Monitor available
English, German, Spanish, French, Portuguese, Dutch, Russian, Japanese, and Simplified Chinese
Network devices, bandwidth, servers, applications, virtual environments, remote systems, IoT, and more
Choose the PRTG Network Monitor subscription that's best for you


