• Company
    • About Us
    • Case Studies
    • Press Center
    • Careers
    • Blog
    • Contact us
  • Contact us
  • Login
 
  • English
    • Deutsch
    • Español
    • Français
    • Italiano
    • Português
Paessler
                    - The Monitoring Experts
  • Products
    • Paessler PRTG
      Paessler PRTGMonitor your whole IT infrastructure
      • PRTG Network Monitor
      • PRTG Enterprise Monitor
      • PRTG Hosted Monitor
      • PRTG UVexplorer
      • PRTG extensionsExtensions for Paessler PRTGExtend your monitoring to a new level
    • Icon Features
      FeaturesExplore all monitoring features
      • Maps & dashboards
      • Alerts & notifications
      • Multiple user interfaces
      • Distributed monitoring
      • Customizable reporting
  • Solutions
    • Industries
      IndustriesMonitor various industry sectors
      • Industrial
      • Healthcare
      • Data Center
      • Education
      • Finance
      • Government
    • IT Topics
      IT TopicsMonitor all areas of IT
      • Network Monitoring
      • Bandwidth Monitoring
      • SNMP Monitor
      • Network Mapping
      • WiFi Monitoring
      • Server Monitoring
  • Pricing
  • Resources
    • Getting Started
      Getting StartedModules for self-paced learning
    • How-to Guides
      How-to GuidesGet the most out of PRTG
    • Videos & Webinars
      Videos & WebinarsLearn from Paessler experts
    • IT  Knowledge
      IT KnowledgeExpand your IT knowledge
    • PRTG Manual
      PRTG ManualFull documentation
    • Knowledge Base
      Knowledge BaseShare community knowledge
    • PRTG Sensor Hub
      PRTG Sensor HubGet sensors, scripts & templates
    • Trainings
      PRTG TrainingLearn how to work with PRTG
  • Partners
    • Icon Handshake
      Become a PartnerFor resellers and channel partners
    • Icon MSP
      Become an MSPDeliver monitoring as a managed service
    • icon partner
      Partner PortalLog in to your partner account
    • Deal Registration
      Deal RegistrationRegister your sales opportunities
    • icon search
      Find a PartnerFind partners selling Paessler products
    • icon technology
      Technology AlliancesSee Paessler technology partnerships
    • Partner HubTools for Your Success
  • Company
    • About Us
    • Case Studies
    • Press Center
    • Careers
    • Blog
    • Contact us
  • Contact us
  • Login
  • English
    • Deutsch
    • Español
    • Français
    • Italiano
    • Português
  • Get a quote
  • Free trial

Powerful Nutanix Monitoring

Monitor your Nutanix HCI environment end-to-end, alongside every other device in your infrastructure.

Free download
PRODUCT OVERVIEW

What does Nutanix monitoring cover beyond Prism?

Nutanix monitoring in a production environment goes beyond the HCI layer. Cluster health, AHV hypervisor performance, and storage I/O metrics are the starting point, but the switches, servers, WAN links, and cloud services your Nutanix infrastructure depends on need to be in the same view. PRTG covers all of this out-of-the-box with two dedicated SNMP v3 sensors for Nutanix and its full range of infrastructure monitoring alongside. No separate Nutanix monitoring tool required.  

PRTG monitors Nutanix AOS clusters, Nutanix AHV hypervisors, VMware ESX/vCenter, Microsoft Hyper-V, Windows, Linux, AWS, Azure, network devices, and more. Everything feeds into the same dashboards, alerts, and reporting system.

Download PRTG Trial

What you will find on this page

  • Monitor Your Nutanix Environment
  • How PRTG Monitors
  • Prism only vs. PRTG
  • FAQs

PRTG is compatible with all major vendors, products, and systems

compatible with all major vendors, products, and systems

What PRTG Monitors Across Your Nutanix Environment

Full Infrastructure Visibility Including Your Nutanix HCI  

Nutanix Prism covers your HCI environment well. PRTG extends that view to the infrastructure your Nutanix clusters depend on: the switches handling their traffic, the physical servers sharing rack space, the WAN links between your sites. A complete picture means faster troubleshooting with full context across every layer.  

PRTG puts your Nutanix infrastructure in the same view as everything else in your environment. Whether you're running on-premises HCI, a hybrid cloud setup with AWS or Azure, or a mix of both, Nutanix monitoring fits into the same dashboard and alert stream as the rest of your stack. 

  • Nutanix clusters and hypervisors visible alongside routers, switches, firewalls, and physical servers
  • Hybrid environment support: on-premises Nutanix HCI and cloud infrastructure (AWS, Azure) in one place
  • No context-switching between Prism and another tool when tracing an issue, which adds up faster than you'd expect during an active incident
  • All Nutanix monitoring data in the same dashboard as the rest of your infrastructure monitoring setup

Hypervisor Performance Data for Every AHV Host  

The AHV hypervisor layer is where resource pressure tends to show up first. Tracking CPU usage, I/O latency, and packet drops on a Nutanix host gives you early visibility into how workloads on that node are performing, with enough lead time to act while everything still runs smoothly.  

PRTG tracks per-host performance metrics continuously across every hypervisor in your Nutanix environment: CPU usage, I/O read and write speed, bytes in and out, packet drop counts, and the active virtual machines count per host, all in real time.  

  • CPU usage tracked continuously per AHV hypervisor host
  • Bytes sent and received, plus I/O read and write speed, per host
  • Dropped packet counts, incoming and outgoing, for network health on each hypervisor
  • Active VM count per host. Straightforward, but useful when you're trying to figure out which host is carrying the most load
PRTG VMware Datastore sensor showing free space, capacity, and accessibility gauges

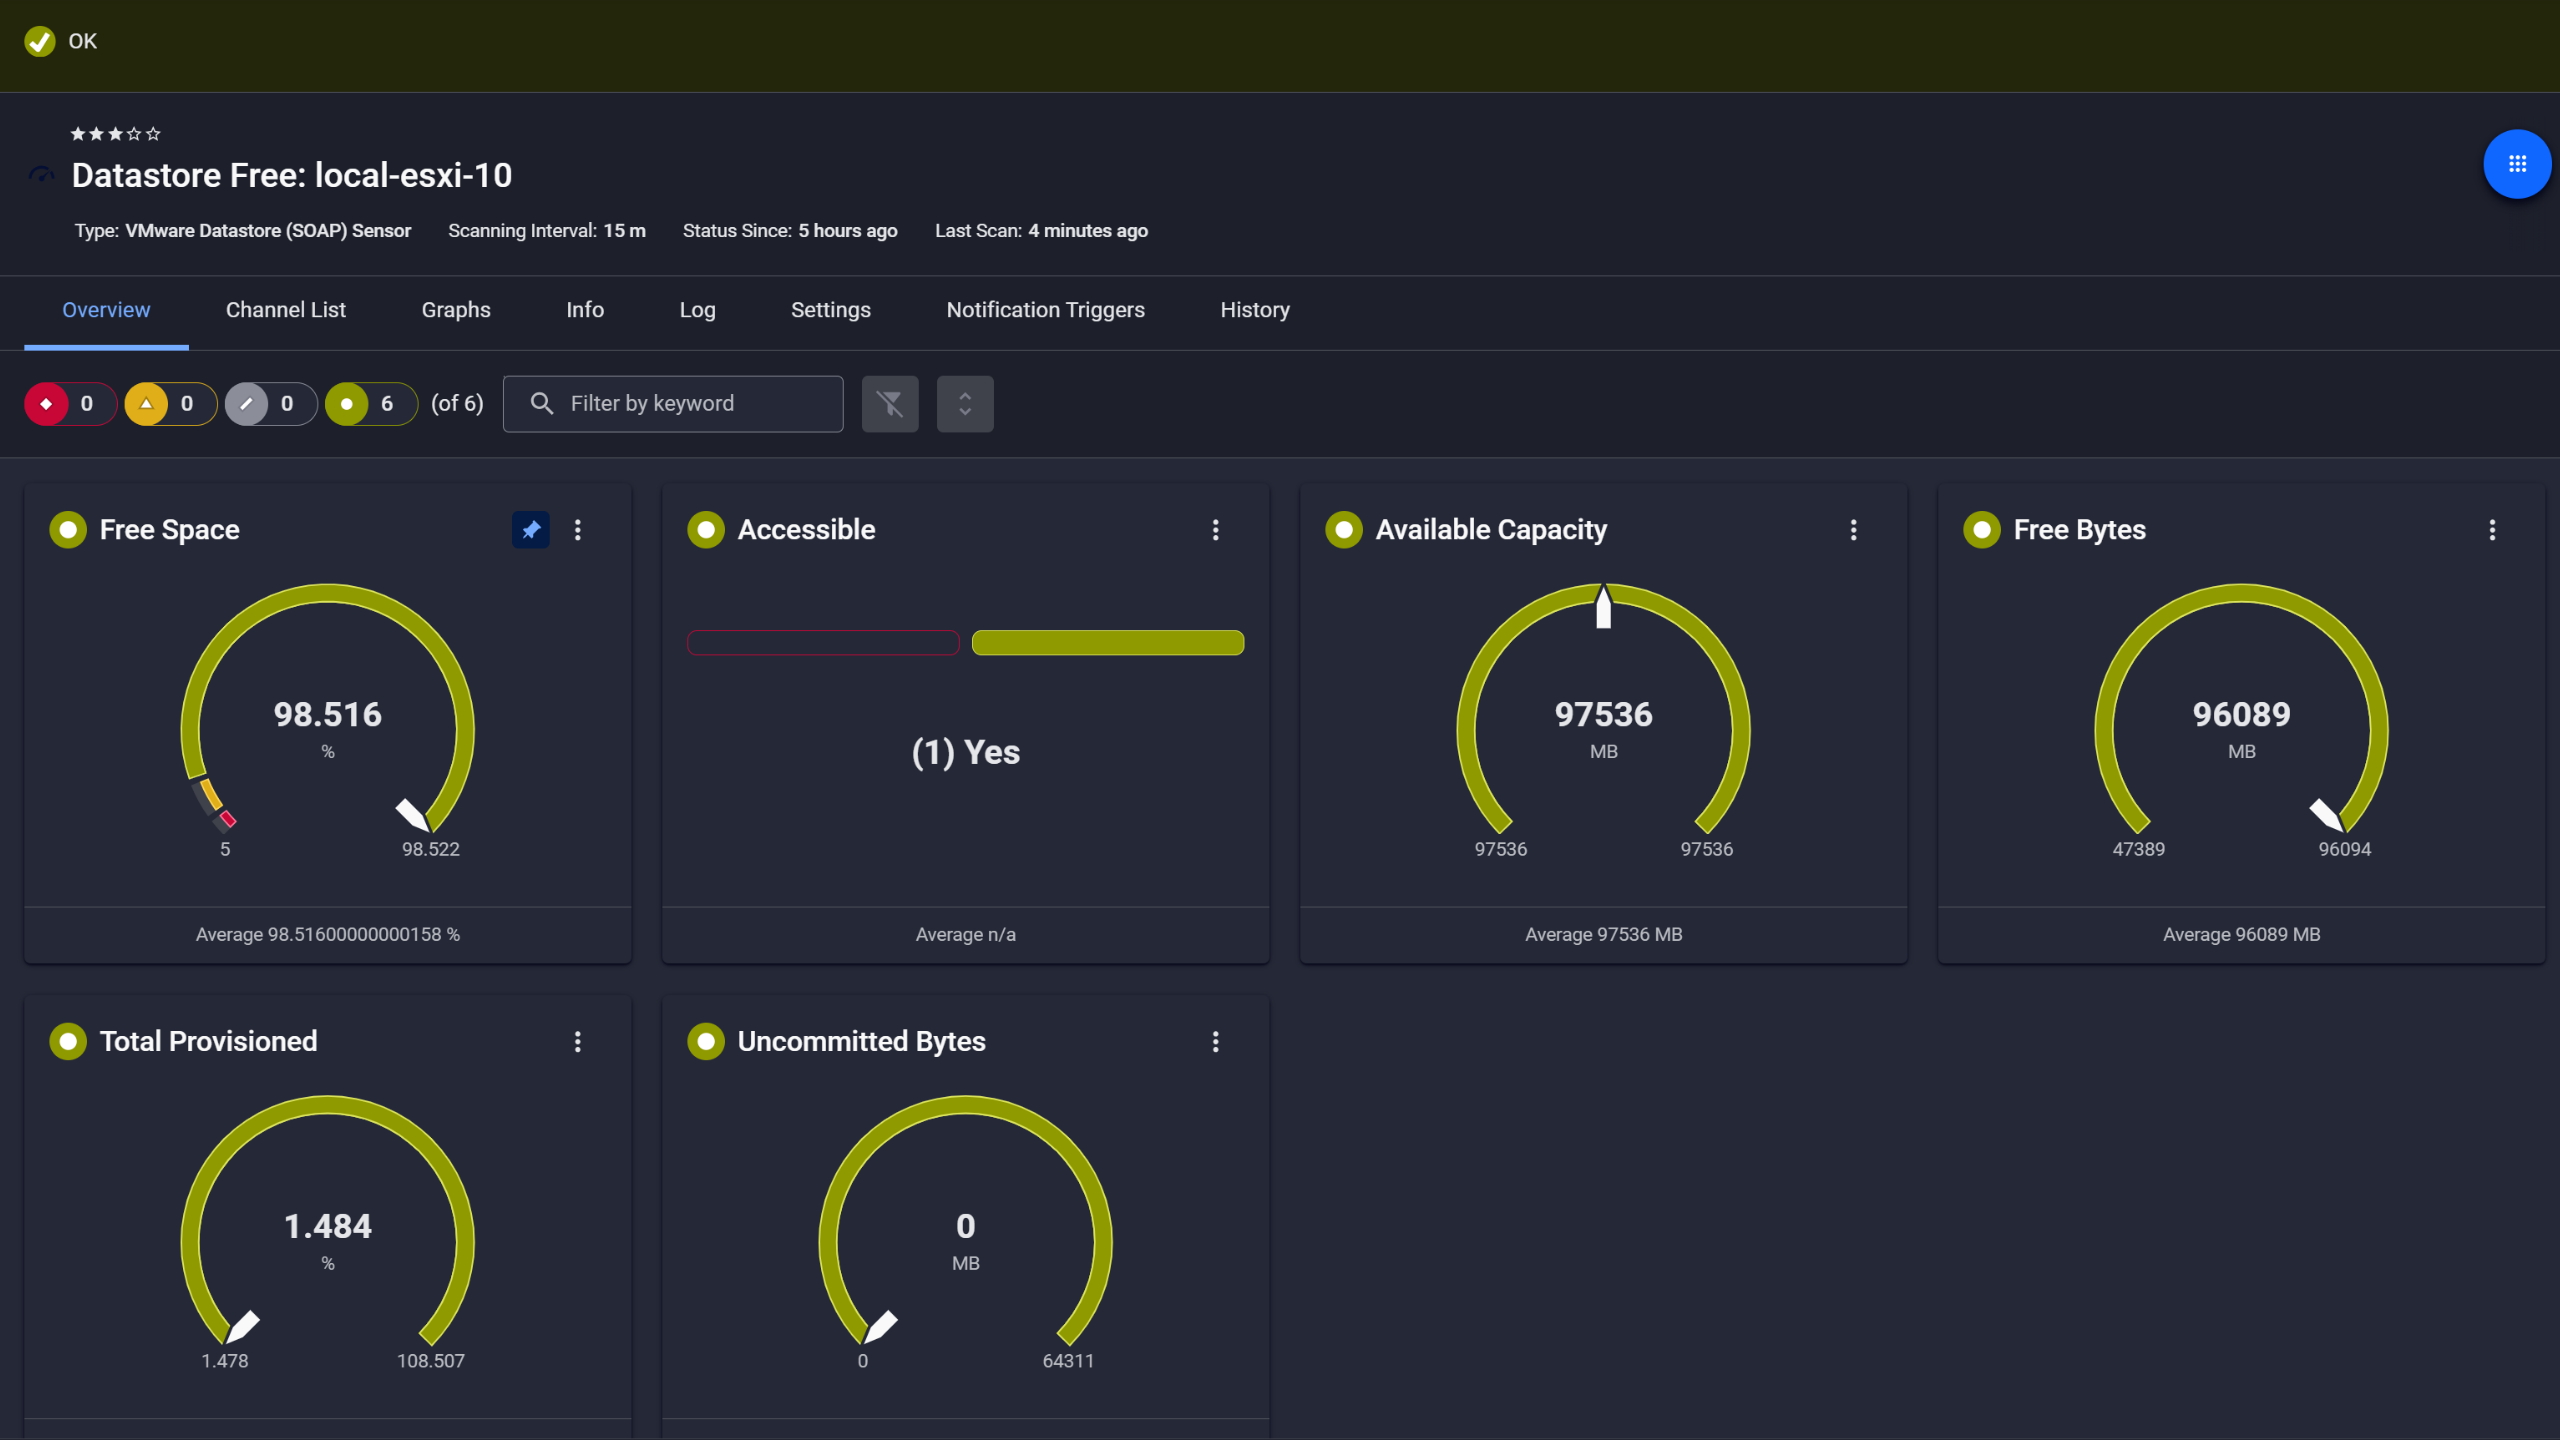
VMware datastore capacity, always visible

PRTG web interface showing Probe Health sensor with health and storage gauge widgets

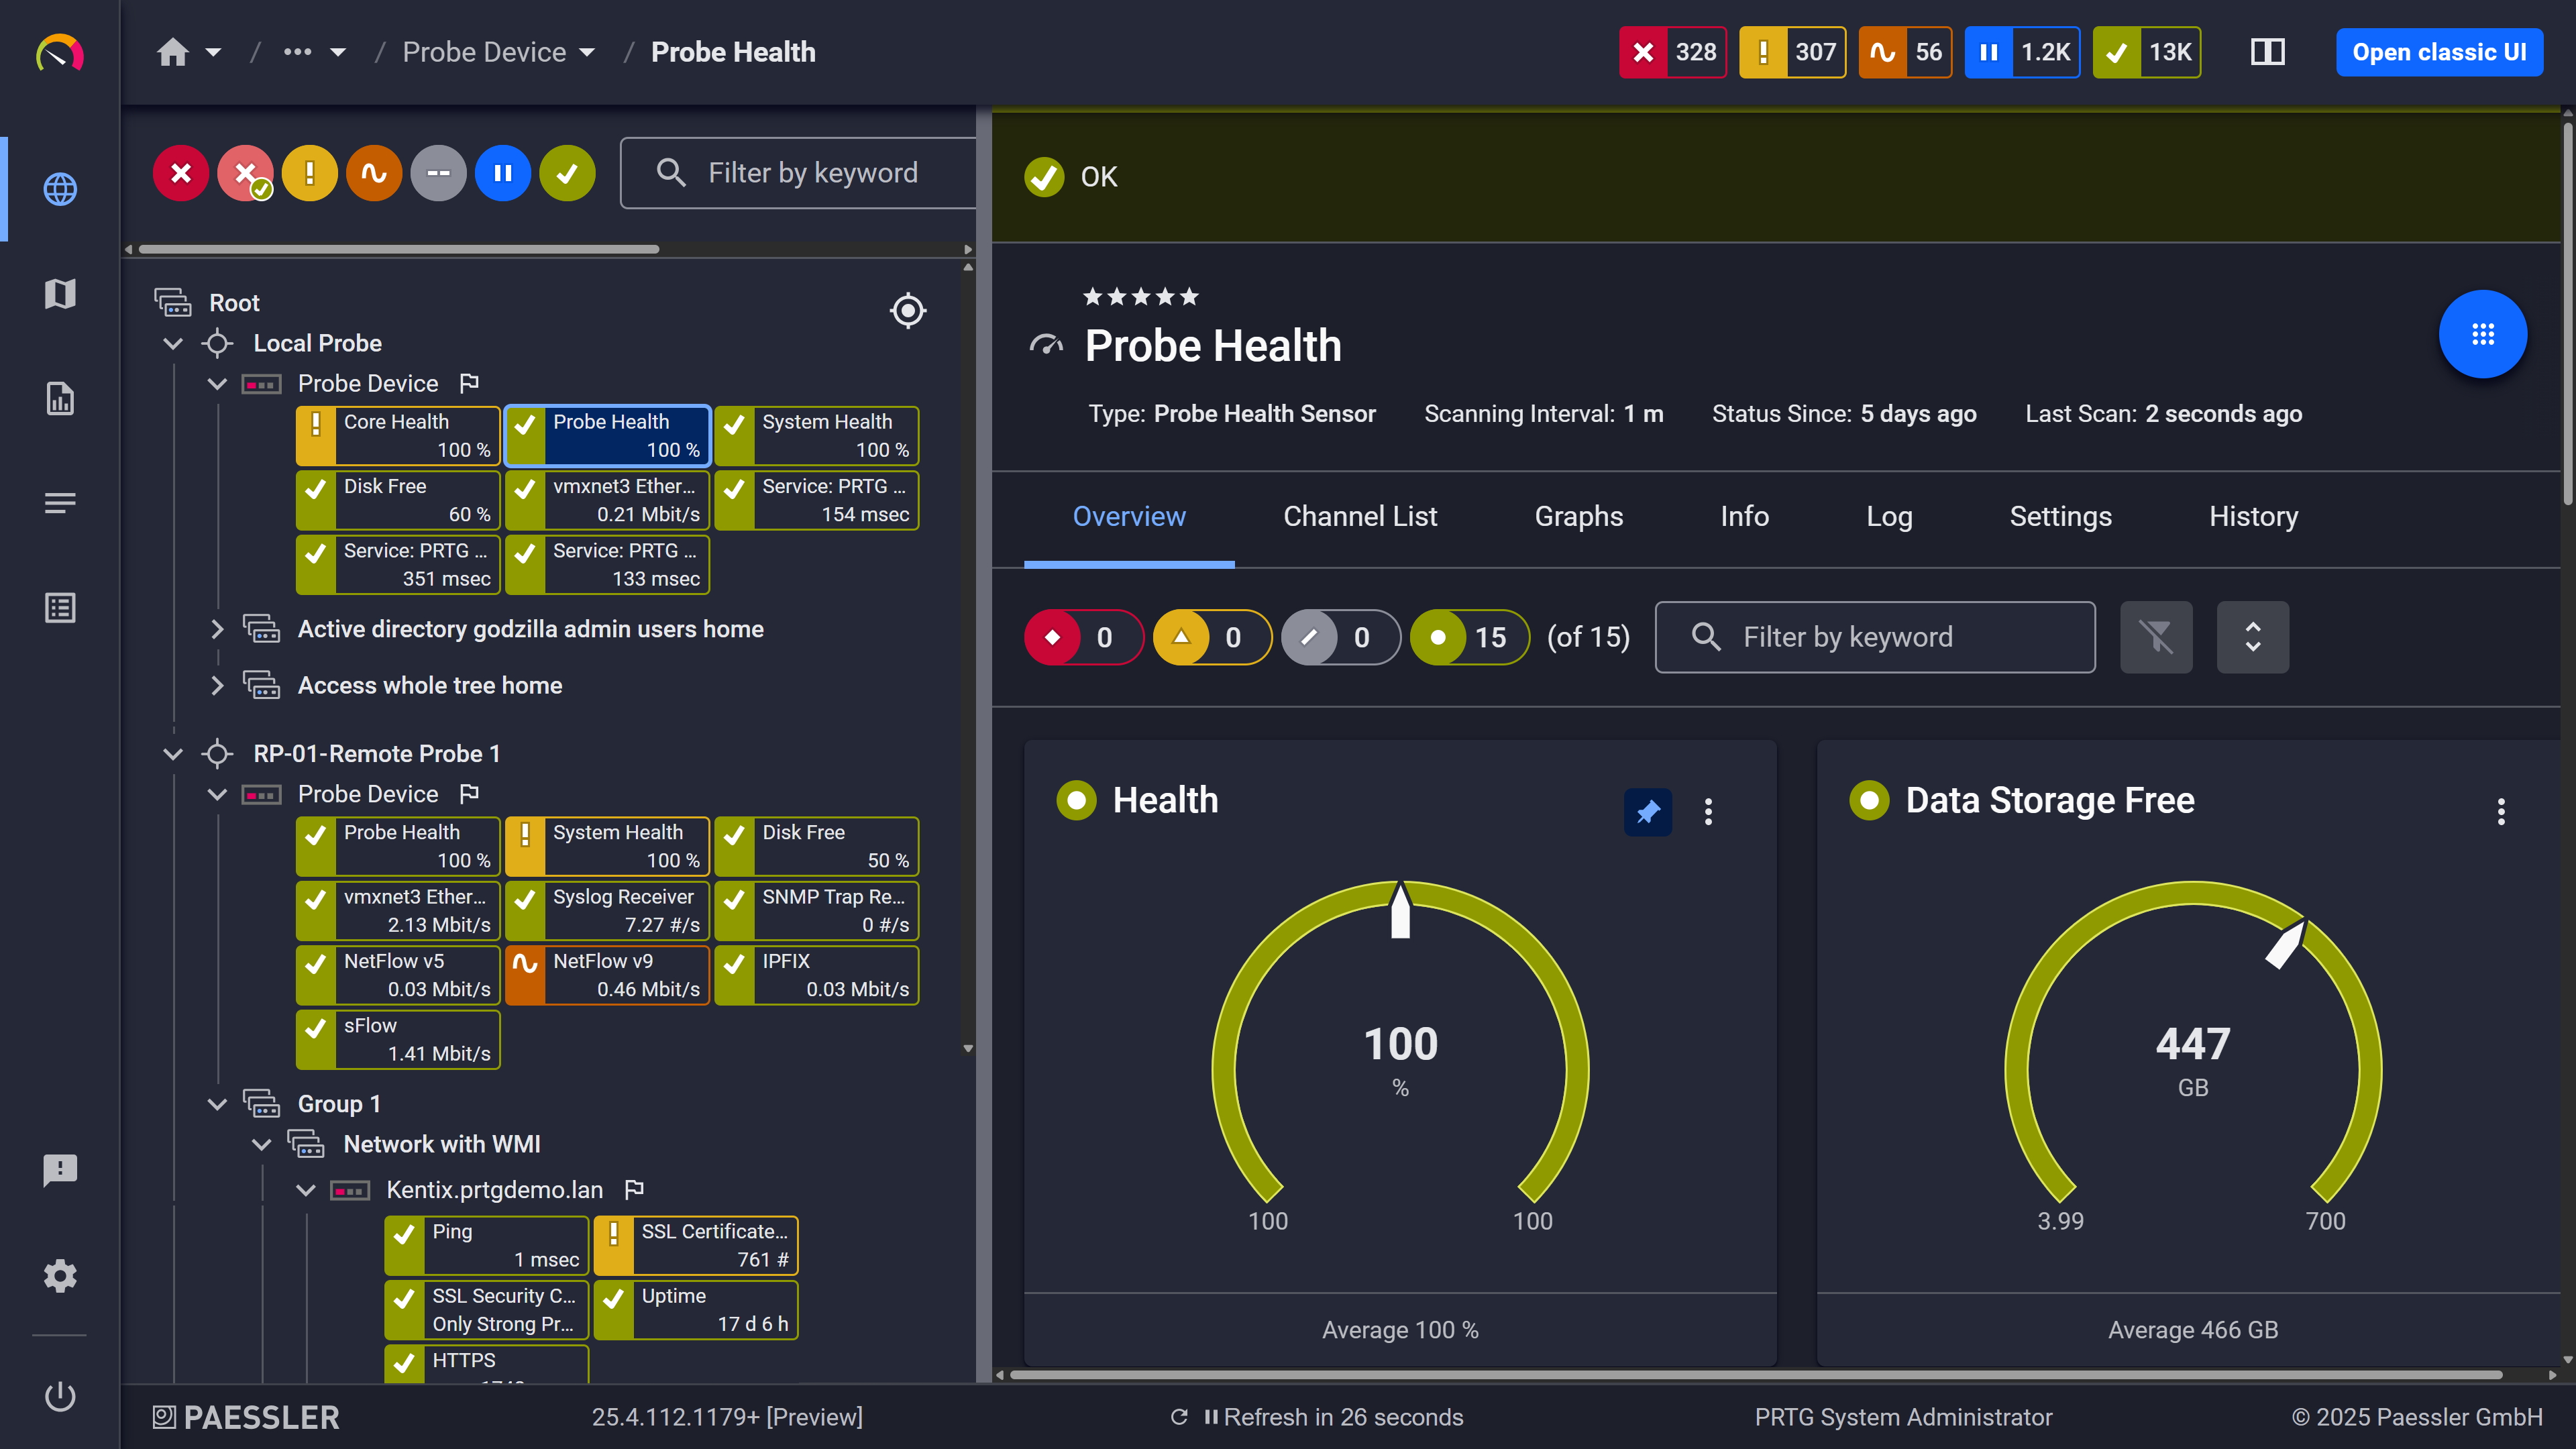
Probe health at a glance

PRTG web interface showing live performance graphs for a Probe Health sensor

Live graphs, real-time performance data

Cluster Health and Storage I/O Always in View

In hyperconverged infrastructure storage I/O affects every workload on the cluster. Continuous monitoring of bandwidth, IOPS, and latency at the cluster level shows you exactly how storage resources are distributed, whether the load comes from a workload spike, a backup job, or a node under pressure.  

PRTG monitors cluster status, I/O bandwidth, latency, and IOPS at the cluster level in real time. Configurable thresholds alert you when values cross defined limits. The historical data gives you the detailed diagnostics and trend visibility you need to troubleshoot faster after the fact and optimize storage capacity planning over time. Worth noting: thresholds are configured per sensor, not globally, so you can set tighter limits on production clusters without affecting dev or test environments.  

  • Cluster status monitored continuously with automatic state-change alerts
  • I/O bandwidth and IOPS tracked at the cluster level in real time
  • I/O latency measured continuously with configurable thresholds
  • Historical metric data for post-incident troubleshooting and storage usage planning

See Why IT Professionals Trust PRTG

Start monitoring your infrastructure in minutes. No professional services, no complex configuration, no risk.

Free download
PRODUCT OVERVIEW

Nutanix Alerts Integrated Into Your Monitoring Workflow  

Prism handles alerting within your HCI environment. PRTG extends that by routing Nutanix cluster and hypervisor alerts through the same notification system as your servers, network devices, and cloud services. One alert stream for everything means less overhead, especially when you need to trace an issue across the boundary between your HCI layer and the infrastructure around it.  

With PRTG, Nutanix cluster and hypervisor alerts run through the same notification system as every other device. Thresholds are set per sensor, delivery goes via email, SMS, or push notification, and escalation levels can be configured across recipient groups, all part of the same monitoring solution you use for the rest of your stack.  

  • Threshold and state alerts for Nutanix clusters and hypervisors routed through the same system as all other devices 
  • Alert delivery via email, SMS, push notification, and HTTP actions 
  • Per-sensor threshold configuration: set limits per cluster or per hypervisor host independently 
  • Escalation notifications configurable with multiple alert levels and recipient groups 
PRTG SNMP Disk Free sensor showing free space, free bytes, and total disk capacity gauges

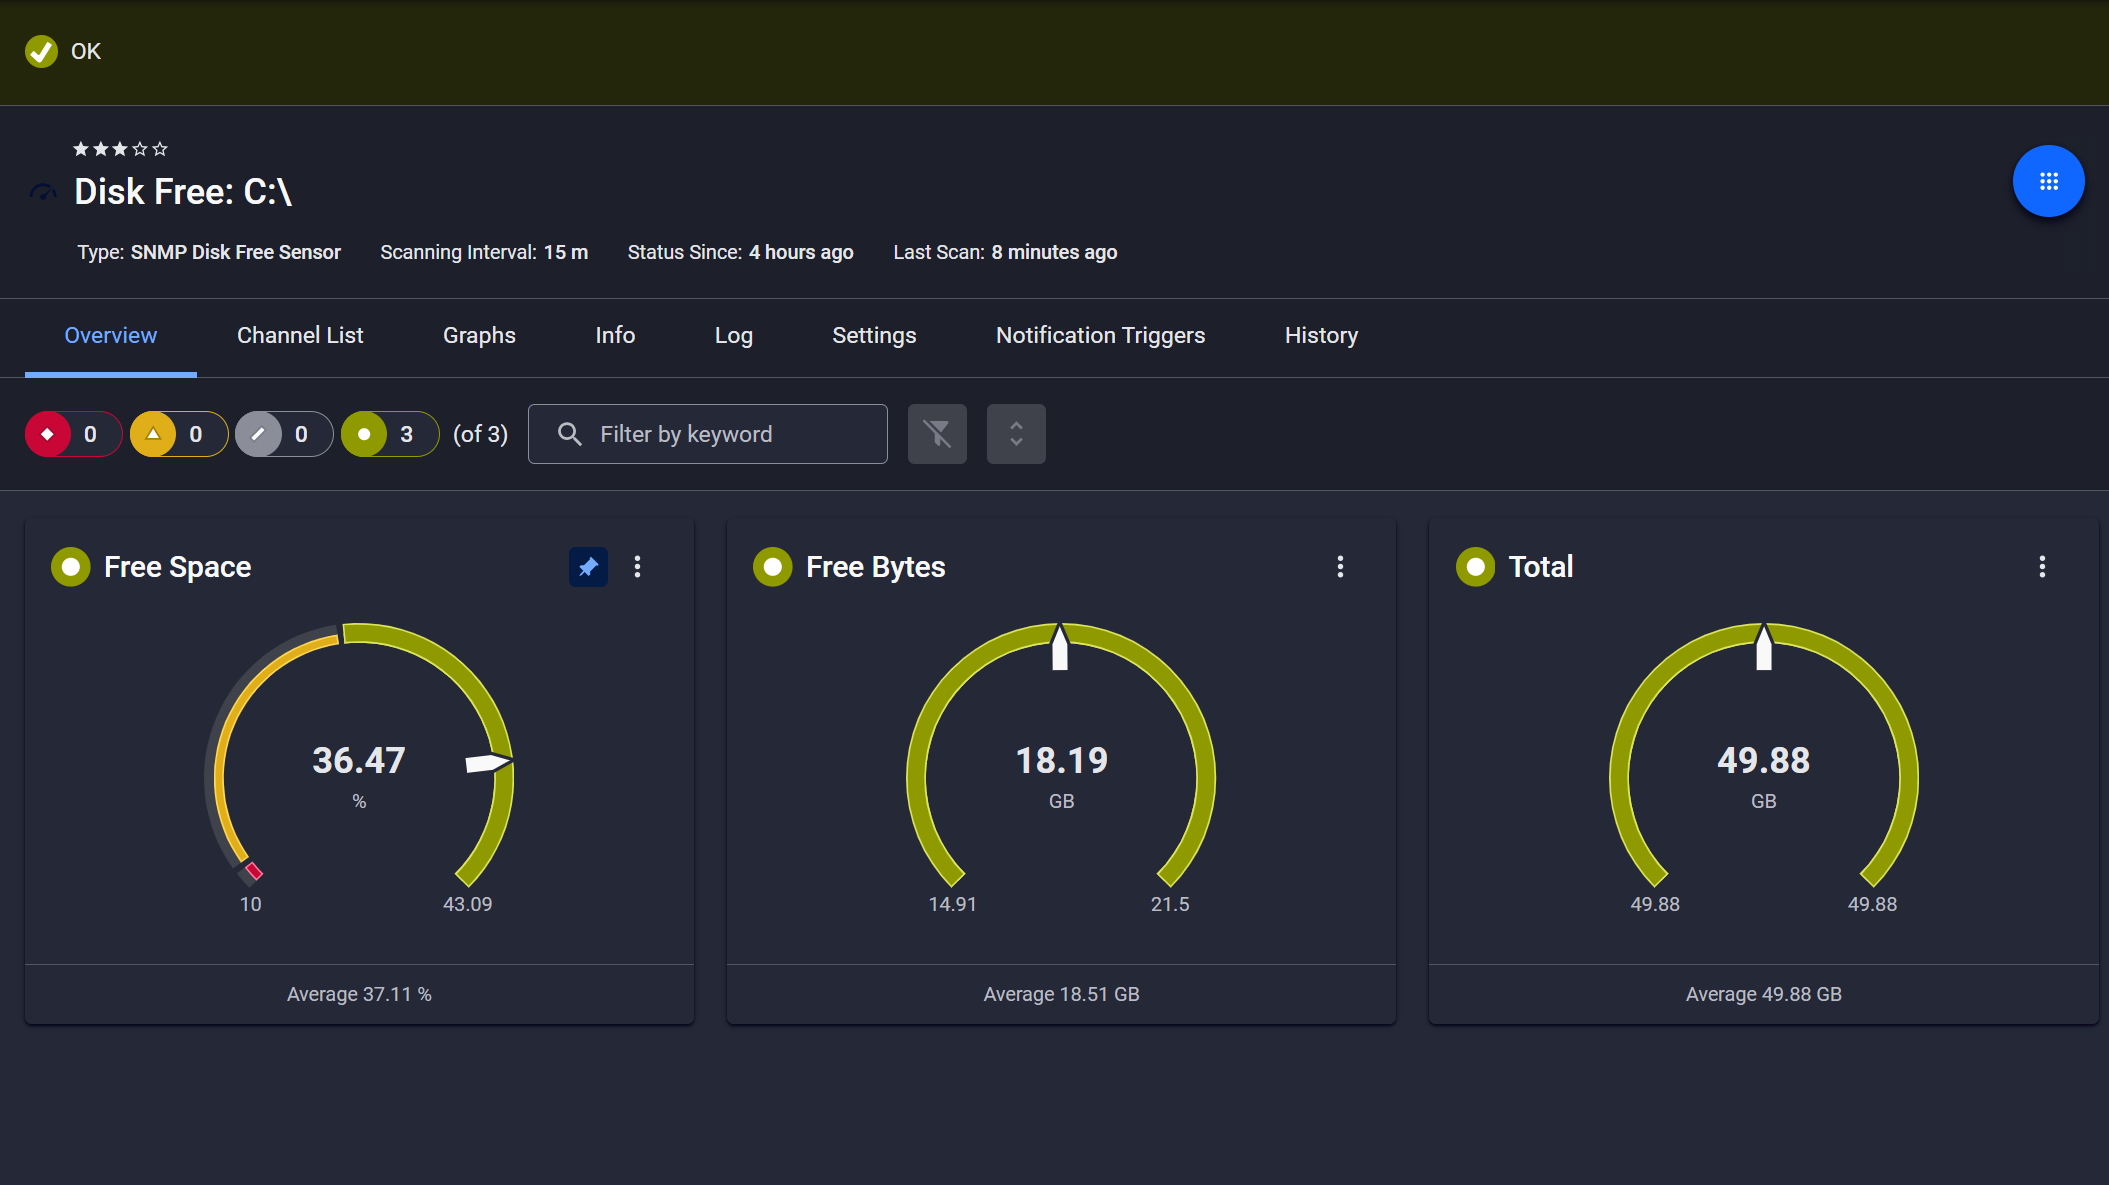
Disk space monitored, alerts ready

PRTG reports list showing scheduled monitoring reports with run times and sensor counts

Scheduled reports, always on time

PRTG web interface showing device tree and full device list with sensor status badges

Full device list, instant overview

How PRTG Monitors Nutanix

PRTG uses two dedicated sensors and SNMP v3 to collect monitoring data from Nutanix environments. Here is a breakdown of what each sensor covers, how setup works, and what the surrounding monitoring stack looks like.  

SNMP v3 Protocol  

Nutanix only supports SNMP v3, not v1 or v2. Before adding Nutanix devices in PRTG, SNMP v3 needs to be enabled and configured on the Nutanix side, and the credentials entered at the parent device level in PRTG. This approach works independently of Prism API versioning, so it's unaffected by the deprecation of older Prism Element REST API versions.  

Cluster Health Sensor  

The SNMP Nutanix Cluster Health sensor monitors a single Nutanix cluster and delivers four data channels: cluster status (state-based), I/O bandwidth, I/O latency, and number of I/O operations. The cluster status channel triggers an alert on any state change; the three numeric channels support threshold-based alerting with individually configurable upper and lower limits. One sensor per cluster. 

Nutanix Hypervisor Sensor

The SNMP Nutanix Hypervisor sensor covers a single AHV hypervisor host and tracks the following performance metrics: CPU usage, bytes sent, bytes received, I/O bandwidth, I/O latency, I/O read speed, I/O write speed, dropped incoming packets, dropped outgoing packets, and active VM count. All channels support threshold-based notification triggers. One sensor per Nutanix host. 

Setup & Discovery

PRTG scans your network and discovers devices automatically. For Nutanix specifically, SNMP v3 credentials need to be configured on the Nutanix side and set in PRTG first. Once that's done, Nutanix sensors are added using a device template. Clusters and hypervisors then sit in the same device tree as the rest of your data center infrastructure, and you can build custom dashboards that bring Nutanix data together with everything else in one view. 

Infrastructure Coverage

Nutanix HCI runs alongside physical servers, network switches, and WAN links that all influence its performance. PRTG covers that surrounding layer: IPMI sensors for physical server health, SNMP sensors for network switches, and availability sensors for WAN uplinks and cloud endpoints including AWS, Azure, and SaaS services. Linux and Microsoft environments are fully supported alongside your Nutanix infrastructure, as are VMware ESX/vCenter setups in mixed virtualization environments.

free downLoad

Nutanix Monitoring with Prism Alone vs. PRTG

FEATURE

Prism Only

Prism Only

With PRTG

With PRTG

Nutanix cluster health monitoring

Prism Only
not included

Available, isolated inside Prism with no view of surrounding infrastructure

With PRTG
included

Part of your full monitoring stack, visible alongside all other devices 

Hypervisor CPU, I/O, and packet metrics

Prism Only
not included

Available, but with no context from the network or server layer

With PRTG
included

Visible alongside servers, switches, and network data in one place

Alert routing via email, SMS, push

Prism Only
not included

Not available outside Prism; stays inside the HCI tool

With PRTG
included

Across your entire infrastructure in one notification system

Switches, servers, WAN link visibility

Prism Only
not included

Out of scope for Prism; requires a separate tool

With PRTG
included

All monitored in the same tool, same dashboards, same alerts

Historical data and trend graphs

Prism Only
not included

Nutanix-only data, not connected to the rest of your infrastructure 

With PRTG
included

Full history, graphs, and reporting across all devices in one view

Custom dashboards across full stack

Prism Only
not included

Prism dashboards cover HCI only; no cross-infrastructure view

With PRTG
included

Configurable maps and dashboards across all monitored infrastructure 

free downLoad

“With PRTG, you get a centralized, intuitive, all-in-one tool that monitors the entire infrastructure. In the event of an error, the software immediately informs you by email. If you don’t hear from PRTG, you can sit back and relax, knowing everything is in order. Shortly after implementing PRTG, we were able to identify and eliminate performance bottlenecks in our VMware environment and load problems in our network.”

Steffen Ille, Head of Infrastructure, Service Center for Computer Systems and Communication
Bauhaus University Weimar

“The demands on our entire IT infrastructure have grown steadily in recent years. An important step towards the optimization of this environment involved the virtualization of our digital landscape. In order to maintain the required transparency and the uninterrupted performance of all our systems, we needed a powerful network monitoring tool. For us, the most important selection criteria were price-performance ratio and ease of use. PRTG met all our expectations and has proven to be an indispensable part of our network management.”

Daniel Baumgartner, Network Administrator
Volkswind

Paessler PRTG Network Monitor licenses & pricing

Choose the PRTG Network Monitor subscription that's best for you.

License NameLicense descriptionPriceLicense DetailsGet startedPricing Details
PRTG 500$200per month paid annuallyBuy nowBuy now

Enough to monitor multiple aspects of 50 devices

PRTG 1000$358per month paid annuallyBuy nowBuy now

Enough to monitor multiple aspects of 100 devices

PRTG 2500$742per month paid annuallyBuy nowBuy now

Enough to monitor multiple aspects of 250 devices

PRTG 5000$1,300per month paid annuallyBuy nowBuy now

Enough to monitor multiple aspects of 500 devices

PRTG 10000$1,642per month paid annuallyBuy nowBuy now

Enough to monitor multiple aspects of 1000 devices

Over 100,000 Customers Worldwide Love Paessler  

customer success stories

Nutanix Monitoring: Frequently Asked Questions


What does a Nutanix monitoring setup cover in practice?

Two sensors, two layers. The SNMP Nutanix Cluster Health sensor tracks cluster status, I/O bandwidth, I/O latency, and IOPS. The SNMP Nutanix Hypervisor sensor covers CPU usage, I/O read and write speed, bytes in and out, packet drops, and active VM count per AHV host. Both run via SNMP v3 and feed into the same dashboards and alerting system as the rest of your infrastructure. 

Does a monitoring tool need Nutanix Prism Central or Prism Element to work?

No. PRTG communicates with Nutanix devices via SNMP v3 directly, independent of Prism Central or Prism Element. You don't need to configure anything in Prism beyond enabling SNMP v3 on the Nutanix side. Also means PRTG is unaffected by Prism API changes, including the deprecation of Prism Element REST API v1 and v2. 

Nutanix only supports SNMP v3, how is that configured?

Enable SNMP v3 on the Nutanix AOS side first, with authentication and privacy settings in place. In PRTG, those credentials go under the SNMP settings of the parent device representing the Nutanix host. Once that's done, both sensors (Cluster Health and Hypervisor) run against that device. Each additional Nutanix host or cluster gets its own device entry with the same credential setup. 

Can PRTG monitor Nutanix AHV and VMware ESX/vCenter in the same environment?

Yes. AHV hypervisors are monitored via the SNMP Nutanix Hypervisor sensor; VMware environments use PRTG's VMware sensors via the vSphere API. Both run in parallel within the same PRTG instance. Useful for teams running mixed virtualization setups or those migrating virtual machines from VMware to Nutanix AHV, since you get observability across both sides during the transition without standing up a second monitoring tool. 

What is the difference between the Cluster Health and Hypervisor sensors?

The Cluster Health sensor operates at the cluster level: overall status plus cluster-wide I/O metrics including bandwidth, latency, and IOPS. The Hypervisor sensor operates at the host level: per-hypervisor CPU usage, I/O throughput, packet drops, and active VM count. For complete Nutanix monitoring coverage you need one of each. One Cluster Health sensor per cluster, one Hypervisor sensor per AHV host. 

Does Nutanix monitoring work in hybrid or cloud environments?

PRTG monitors on-premises Nutanix infrastructure alongside AWS, Azure, and SaaS endpoints in the same instance. When workloads span on-premises HCI and cloud platforms, you get a consistent cloud monitoring approach across the hybrid environment. Availability and performance metrics for cloud infrastructure endpoints sit next to your Nutanix data in the same dashboards and alert stream. 

Paessler PRTG

Paessler PRTG

Network Monitoring Software – Version 26.1.116.1532 (February 9th, 2026)

Hosting icon

Hosting

Download for Windows and cloud-based version PRTG Hosted Monitor available

Languages icon

Languages

English, German, Spanish, French, Portuguese, Dutch, Russian, Japanese, and Simplified Chinese

test

Monitor everything

Network devices, bandwidth, servers, applications, virtual environments, remote systems, IoT, and more

test

Pricing

Choose the PRTG Network Monitor subscription that's best for you

Discover more monitoring insights and stories

Content illustration

Powerful stories from the monitoring world

  • First PRTG release in 2020 (20.1.55) contains sensors for Nutanix HCI
  • HCI, Nutanix and visibility with PRTG - Paessler Blog
  • Video: Two SNMP Nutanix sensors - Paessler
Support illustration

Resources to master your monitoring challenges

  • PRTG Manual: SNMP Nutanix Cluster Health Sensor - Paessler
  • [IMPLEMENTED] Monitoring Nutanix
  • PRTG Manual: IPMI System Health Sensor - Paessler
Solution illustration

Solutions for all your monitoring needs

  • Nutanix Monitoring
  • Monitoring Virtualization
  • VM Management
PRTG Logo

Start Monitoring with PRTG and see how it can make your network more reliable and your job easier.

Free download
PRODUCT OVERVIEW

Products

  • Paessler PRTG
    Paessler PRTGMonitor your whole IT infrastructure
    • PRTG Network Monitor
    • PRTG Enterprise Monitor
    • PRTG Hosted Monitor
    • PRTG UVexplorer
    • PRTG extensions
      Extensions for Paessler PRTGExtend your monitoring to a new level
  • Icon Features
    FeaturesExplore all monitoring features

Monitoring with PRTG

  • Network monitoring
  • Bandwidth monitoring
  • SNMP monitoring
  • Network mapping
  • Wi-Fi monitoring
  • Server monitoring
  • Network traffic analyzer
  • NetFlow monitoring
  • Syslog server

Useful Links

  • PRTG Manual
  • Knowledge Base
  • Customer Success Stories
  • About Paessler
  • Subscribe to newsletter
  • PRTG Support
  • PRTG Consulting
  • PRTG Feedback & Roadmap

Contact

Paessler GmbH
Thurn-und-Taxis-Str. 14, 
90411 Nuremberg 
Germany

[email protected]

+49 911 93775-0

  • Contact us
©2026 Paessler GmbHTerms & ConditionsPrivacy PolicyImprintReport VulnerabilityDownload & InstallSitemap
CCTV CCTV CCTV