
Last reviewed: 10/2026


PRTG counts by sensors: one sensor per measured value, so most devices need around five to ten sensors depending on what you track. Every PRTG plan, from the free 100-sensor edition up to PRTG 10000, lists its exact sensor count and price on our website, so you can see your cost before you ever pick up the phone. All features are included at every tier, including the free one, so growing your monitoring never means unlocking a higher paywall. Growing your monitoring does mean adding more sensors, and we'd rather you see that clearly upfront than discover it later.
PRTG monitors your network devices, servers, applications, virtual environments, and cloud resources from one installation, using SNMP, WMI, SSH, APIs, and flow protocols like NetFlow and IPFIX for traffic and bandwidth visibility. Native sensors for AWS and Azure sit in the same dashboard as your on-premises devices, and OT protocols like Modbus and MQTT cover the plant floor too. According to our 2026 survey of 1,088 IT teams, 60.2% of midmarket teams chose PRTG specifically because it's one tool that covers everything, rather than assembling several point tools (blog.paessler.com/what-1088-it-teams-told-us-about-monitoring-in-2026). Where PRTG draws a line: it isn't built as a dedicated flow-forensics engine for exploring traffic across many dimensions, and cloud sensors today cover AWS and Azure rather than every public cloud.
When a sensor crosses a threshold you set, PRTG alerts you immediately through email, SMS, push notification, or tools like Slack, Teams, and PagerDuty, with the context already in front of you: which device, which metric, how it's trending. Custom dashboards and maps put your whole infrastructure on one screen, so you can see where a problem sits before you open a single device. That means you're reading your own network and making the call yourself, not waiting on a separate system's interpretation of it. PRTG's strength here is directness: immediate access to the data behind every alert, not an automated investigation running in the background.
FEATURE | PRTG PRTG | Kentik Kentik |
|---|---|---|
Cover network, servers, applications, and cloud with one license | PRTG 300+ sensor types plus native AWS and Azure sensors, all in one license | Kentik Limited: Core, NMS, and Cloud cover network, device, and cloud traffic, plus host-level flow via an agent; broader server and application monitoring isn't part of the published lineup |
See published pricing for every plan | PRTG Full price list published online for every tier, including the free editionSed do eiusmod tempor incididunt ut labore | Kentik Limited: Pro's starting price is published; Premier and scaling past included limits require contacting sales |
Monitor unlimited remote sites at no extra license cost | PRTG Unlimited remote probes included in every license | Kentik Limited: 25 devices included per tier (Pro and Premier); more requires contacting sales |
Get automated topology maps and config backup without a separate product | PRTG Limited: Available through PRTG UVexplorer, a separate product whose data is surfaced inside PRTG, refreshed via scheduled discoveries | Kentik Kentik Map and configuration backup and diff are included in both Pro and Premier |
Keep IT and OT devices in one view | PRTG Modbus, OPC UA, and MQTT sensors alongside standard IT sensors | Kentik No OT or industrial protocol support in the published product lineup |
Watch bandwidth and top talkers across your network | PRTG NetFlow, sFlow, jFlow, and IPFIX sensors built into your existing license | Kentik High-scale flow analytics with ad-hoc exploration and Sankey-style traffic visualization |
Watch cloud resources alongside your on-prem network | PRTG Native AWS and Azure sensors in the same dashboard as on-prem devices | Kentik Native flow-log visibility across AWS, Azure, and Google Cloud, plus cloud path troubleshooting |
Investigate a problem using AI-guided analysis | PRTG No automated or natural-language investigation available today | Kentik AI Advisor, Cause Analysis, and Query Assistant included |
Monitor without routing your data through a third-party cloud | PRTG Runs on your own server and network, no mandatory external telemetry routing | Kentik SaaS-only platform; telemetry is processed in Kentik's cloud |
PRTG uses sensor-based pricing: you choose how many sensors you need, and every feature, from basic alerting to advanced sensors, comes included at every tier, from the free 100-sensor edition upward. That gives you one predictable number before you commit, with every capability already built in. Kentik's pricing starts from a published rate but scales by tier and usage, with custom quotes once you go beyond what's included.
| License Name | License description | Price | License Details | Get started | Pricing Details | |
|---|---|---|---|---|---|---|
| PRTG 500 | $200 | per month paid annually | Buy nowBuy now | Enough to monitor multiple aspects of 50 devices | ||
| PRTG 1000 | $358 | per month paid annually | Buy nowBuy now | Enough to monitor multiple aspects of 100 devices | ||
| PRTG 2500 | $742 | per month paid annually | Buy nowBuy now | Enough to monitor multiple aspects of 250 devices | ||
| PRTG 5000 | $1,300 | per month paid annually | Buy nowBuy now | Enough to monitor multiple aspects of 500 devices | ||
| PRTG 10000 | $1,642 | per month paid annually | Buy nowBuy now | Enough to monitor multiple aspects of 1000 devices |
”As an international company, PRTG is ideal for us. If something went down half way across the world, we wouldn’t be woken up – we can rely on PRTG to identify the problem and alert us before it occurs – enabling the right person, in the right time zone to resolve the problem. At the end of the day, if we’re to provide an internal network experience for our employees that meets expectations, we need a tool like PRTG to be successful.”
PRTG puts your entire infrastructure in view the moment you log in. Every device, sensor, and metric lives in one interface, from a single switch to your full network map. Build the view that matches how your team actually works, then drill into any detail the moment something needs attention.
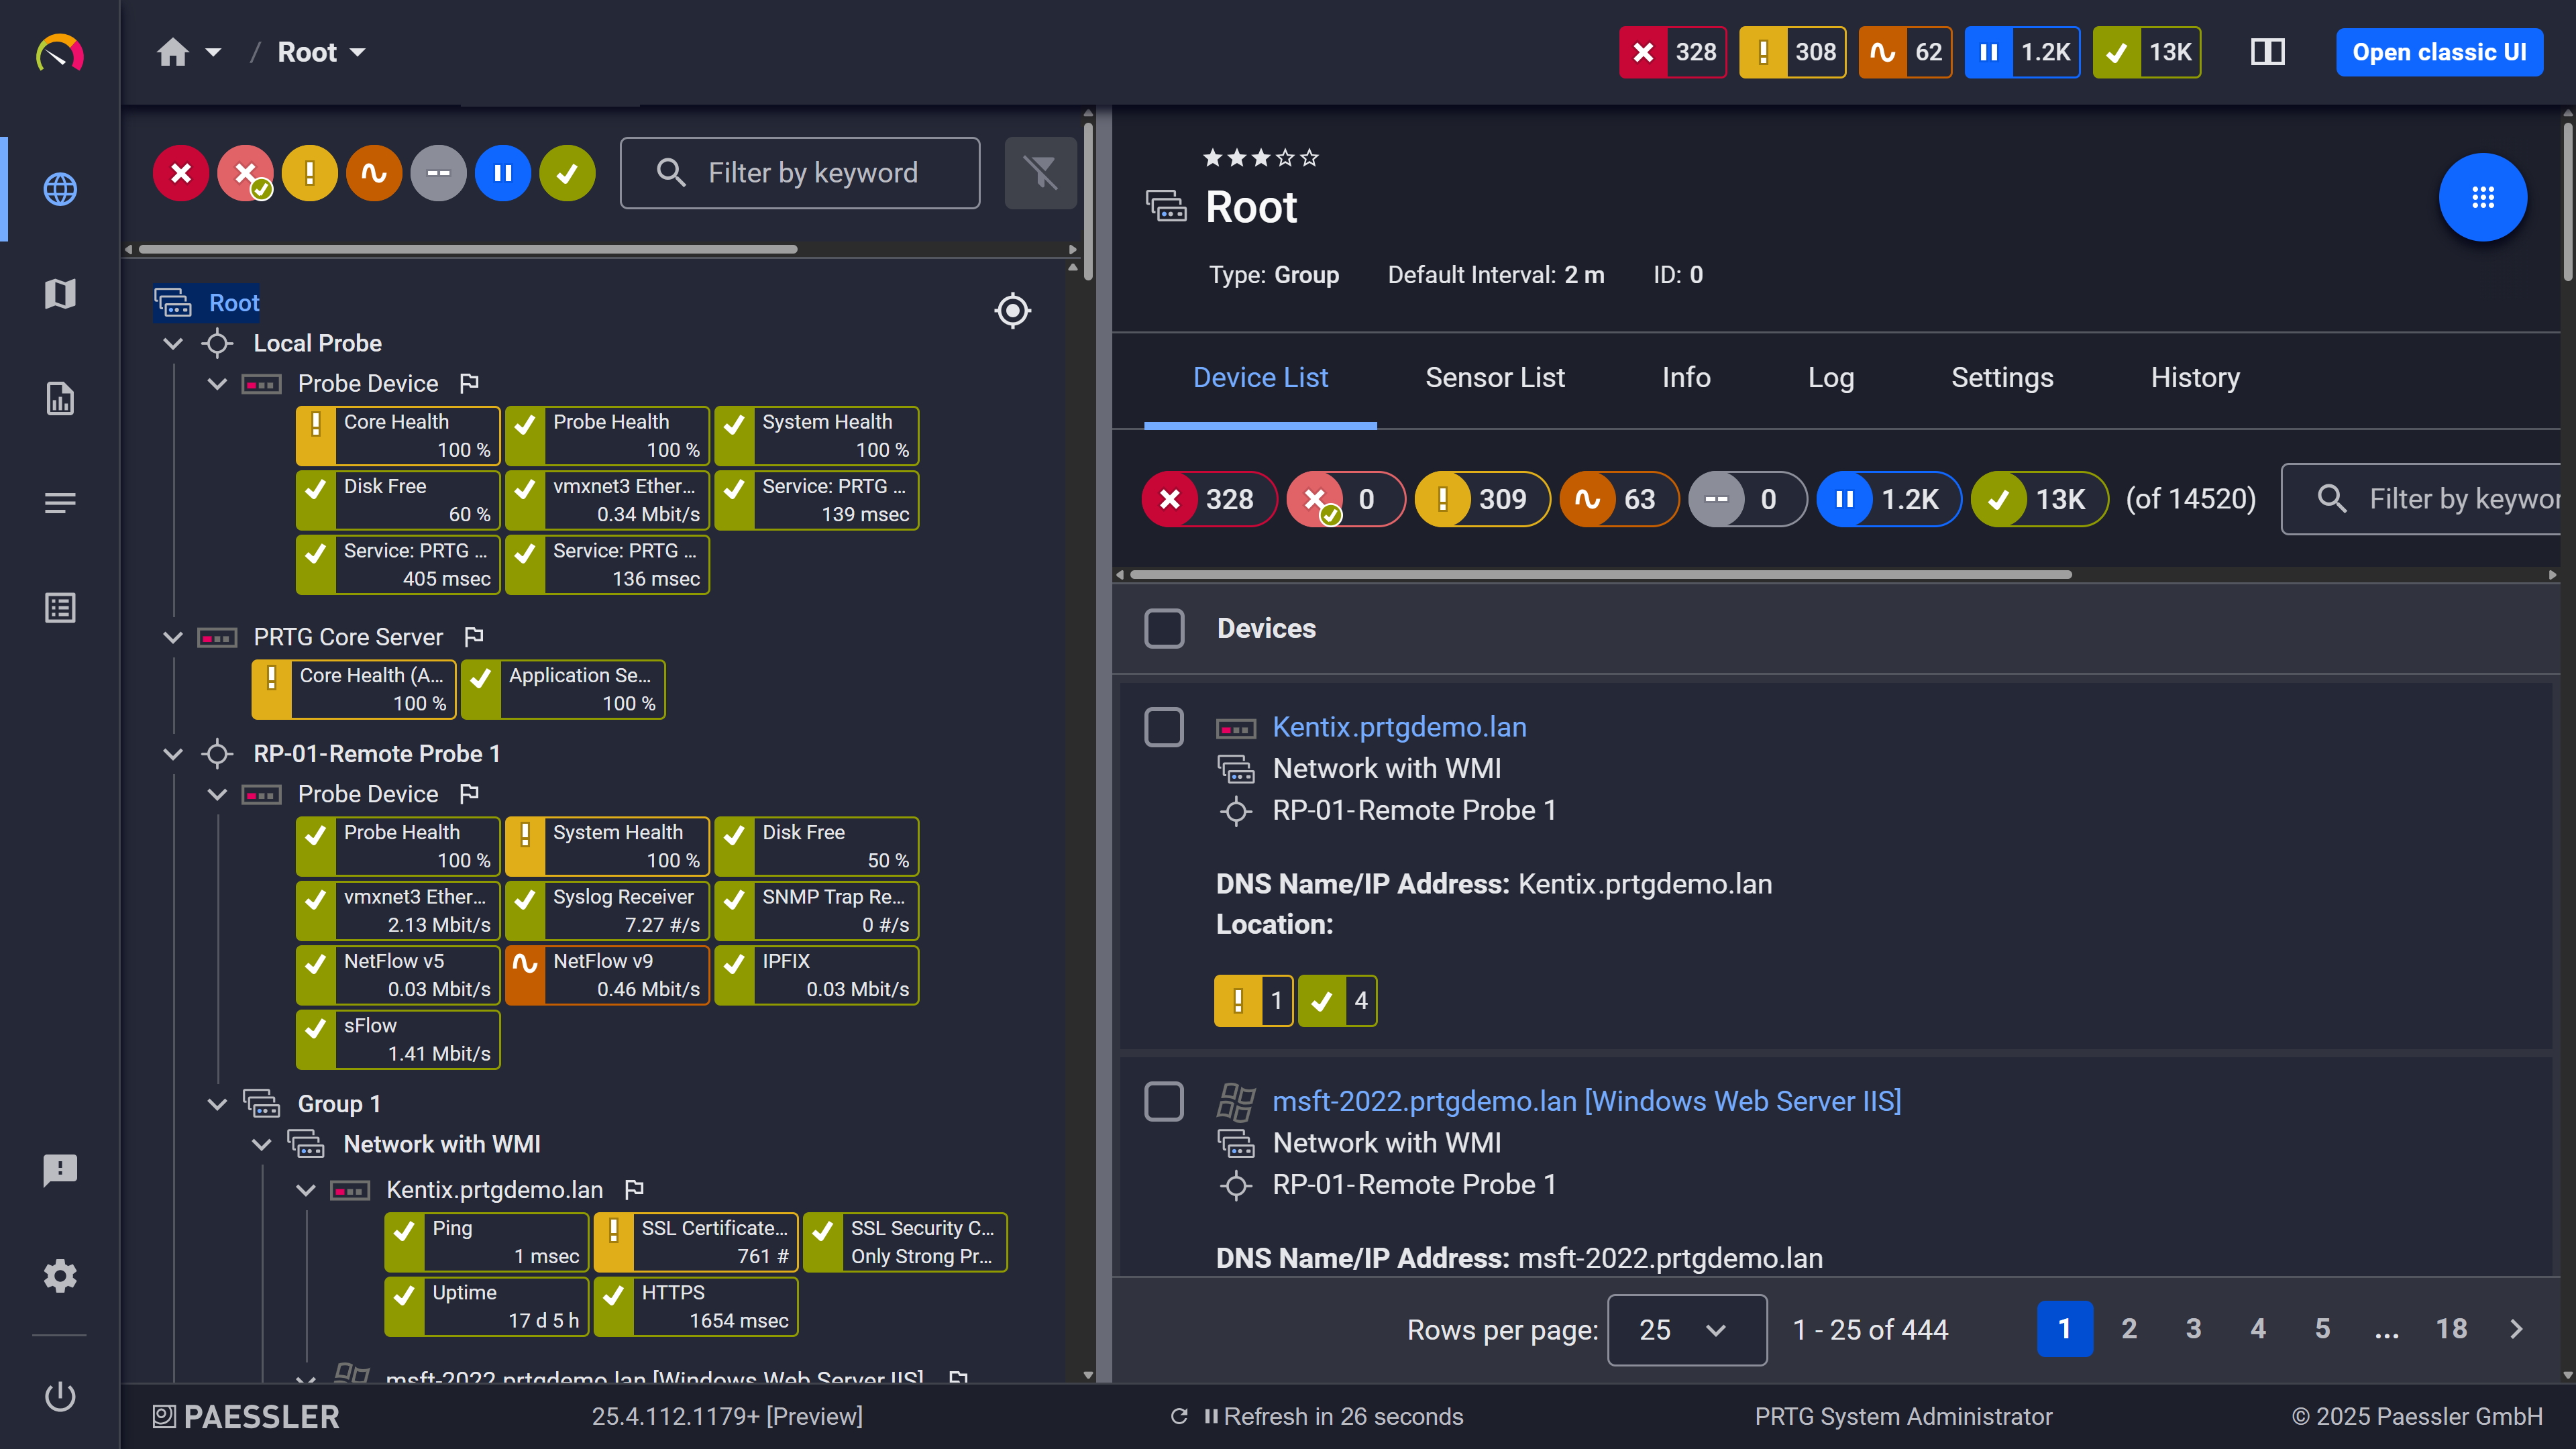
Device tree view: your full infrastructure, organized automatically after auto-discovery
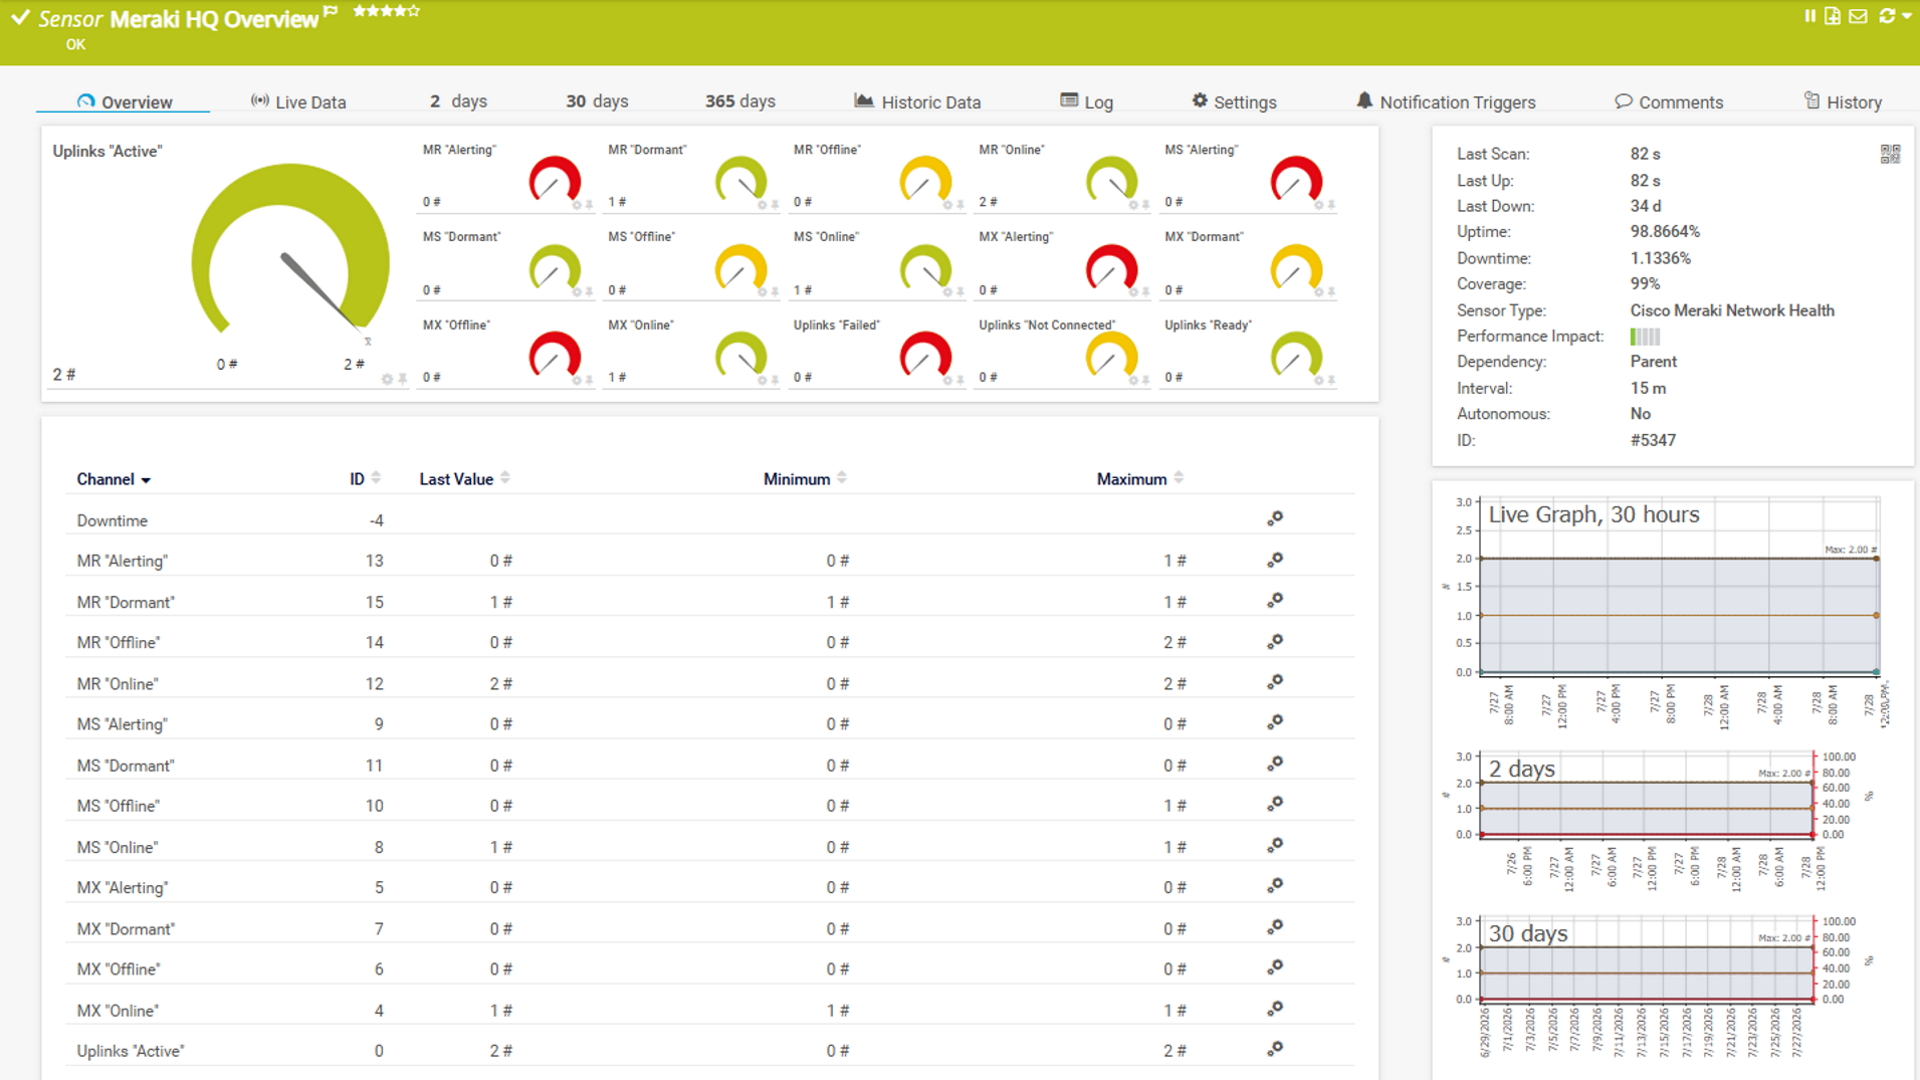
Sensor traffic: live sensor data, updated on your configured scan interval
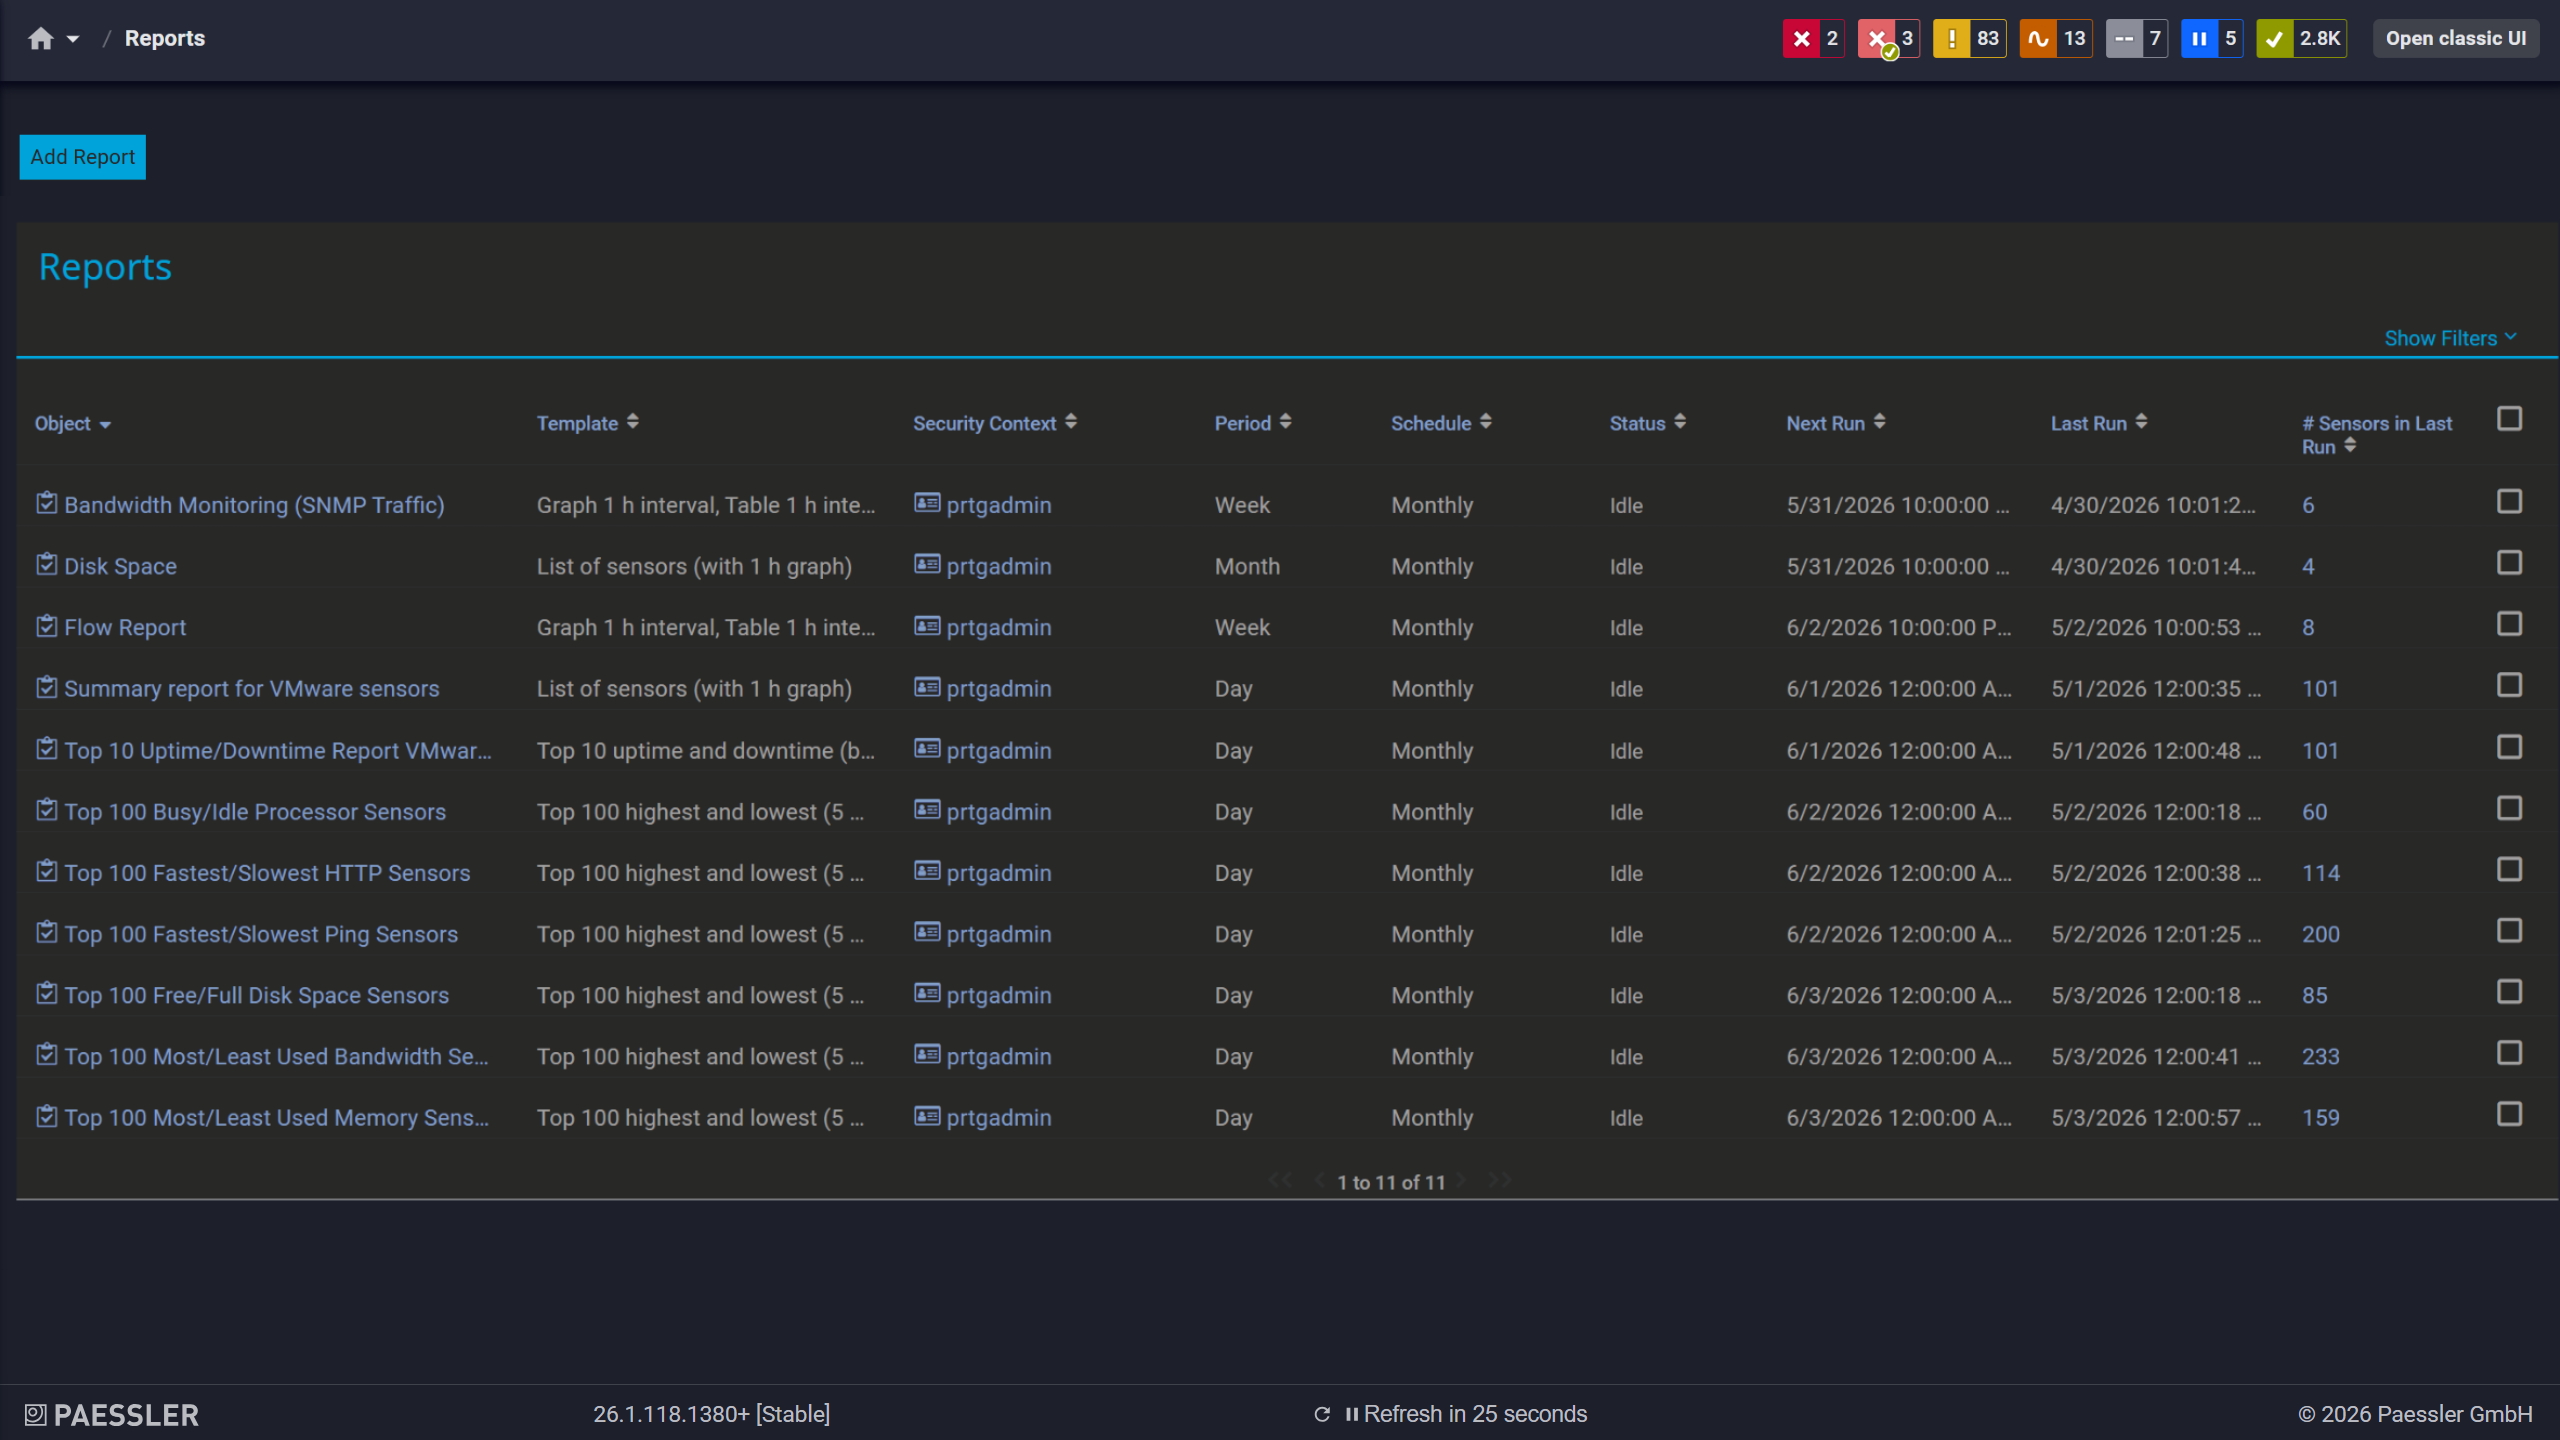
PRTG report screen: See all the reports generated and available to you in one easy to grasp overview
Switching to PRTG follows one simple principle: your live network is the source. PRTG's auto-discovery reads what actually exists and rebuilds your monitoring directly from it. Four steps take you from your current setup to a running PRTG installation.
Have a list of hostnames or IP adresses of your current device. This can be from your own documentation, or get it from your current monitoring tool. In Kentik, export your device list from Settings > Networking Devices, or from the NMS Devices page if you also use Kentik NMS. This list is your completeness checklist for the entire switch. Then install PRTG alongside your current tool: both can run in parallel during the transition.
Let auto-discovery rebuild your monitoring: Enter your IP ranges and device credentials (e.g. for protocols like SNMP or WMI). PRTG's auto-discovery scans the network segments, identifies device types, and creates suitable sensors from built-in device templates. The rebuild comes from your live network, so it reflects what is really there. Compare the result against your device list from step 1 and add any sensors auto-discovery could not infer.
Translate concepts, not configurations: What you know maps cleanly to PRTG. Kentik's collectors and agents become PRTG's remote probes, your registered devices stay devices, the metrics you track become sensors, and your dashboards and Observation Deck views become PRTG maps and dashboards. Then recreate your alerting workflows with PRTG's notification templates and triggers.
Run both systems in parallel and tune: Compare alerts side by side for a few weeks. Adjust thresholds and schedules, and build the maps and reports your team and leadership rely on. Decommission the old tool once PRTG has proven itself in daily operation.
Kentik is a network intelligence platform built around flow-based traffic analytics, cloud visibility, and AI-assisted investigation. PRTG is a full-stack infrastructure monitoring tool that covers network, server, application, virtualization, OT, and cloud monitoring in one license. Teams usually compare the two when they want deep traffic and flow analytics specifically, or when they want one tool that covers their whole infrastructure instead.
PRTG monitors your entire infrastructure, network devices, servers, applications, virtual machines, OT systems, and cloud resources, from a single, sensor-based license with published pricing. Kentik focuses on network traffic and flow analytics, cloud connectivity, and AI-guided investigation, priced by usage tier with custom quotes beyond the published starting price. The practical difference: PRTG gives you one tool and one bill for everything you monitor; Kentik gives you deeper traffic analysis for your network specifically.
No. PRTG collects metrics through SNMP, WMI, SSH, REST APIs, packet sniffing, and flow protocols such as NetFlow and IPFIX. If your critical devices need gNMI-based streaming telemetry specifically, that's outside what PRTG offers today.
PRTG Network Monitor scales up to the PRTG 10000 license, enough for most mid-sized and single-site environments. For larger or more distributed organizations, PRTG Enterprise Monitor adds centralized visibility across an unlimited number of PRTG installations, so growth doesn't mean switching products, just adding to the same architecture.
Not today. PRTG alerts you based on thresholds you set and gives you trend data, dashboards, and maps to investigate quickly yourself. If automated, AI-driven investigation is a hard requirement for your team, that's a genuine difference worth weighing against Kentik's AI Advisor.
Kentik offers enriched, high-scale flow analytics with ad-hoc traffic exploration, AI-guided troubleshooting, and native topology mapping, all without a separate product. These are real strengths for teams whose primary need is deep, carrier-grade traffic analysis on an already-defined network. For full-stack infrastructure monitoring across network, server, application, and OT, PRTG is built for that instead.
Yes. PRTG includes native sensors for AWS and Azure resources, shown in the same dashboard as your on-premises devices. For other cloud platforms, PRTG connects through custom sensors and API integration rather than a pre-built sensor.
Yes. PRTG includes unlimited remote probes for distributed environments, so every site reports into one central dashboard. In our 2026 survey of 1,088 IT teams, 34.1% of decentralized enterprises run PRTG across multiple sites or business units rather than as a single companywide instance.
We also compared PRTG with other monitoring tools:
AppDynamics requires complex setup and module-based pricing. PRTG delivers comprehensive monitoring with intuitive interfaces and transparent pricing.
ControlUp offers strong digital experience monitoring but complex pricing and limited network insights. PRTG provides full visibility, clear sensor-based pricing, and flexible deployment.
ipMonitor offers a one-time perpetual license without recurring fees, but requires expensive add-ons for support and struggles with complex network environments.
Pandora FMS offers flexible monitoring but comes with complex pricing and a steep learning curve. PRTG delivers transparent sensor-based pricing and intuitive monitoring through a unified interface.
Start a 30-day trial with unlimited sensors, no commitment required.
Tell us your device count and we'll send you a quote.
See PRTG in a live demo with one of our monitoring experts.
