
Last reviewed: 10/2026


PRTG licenses by sensor, meaning you choose a plan based on how much you want to monitor, not how many separate products you need to combine. One license already includes network, server, application, and database monitoring, along with unlimited remote probes for additional sites. If you are coming from a platform like DX Spectrum, where fault management, performance monitoring, flow analysis, and configuration management are typically sold as separate products, that difference shows up quickly in what one subscription actually covers. Your plan simply grows with you: add sensors as your environment changes, and move up a tier only when you actually need more capacity.
PRTG is built to be simple on the surface and deep underneath. Auto-discovery and pre-configured sensors get you monitoring quickly, while scripting, custom sensors, and a full API are there the moment your environment needs more than the defaults. In our 2026 survey of 1,088 IT teams, 60.2% of midmarket PRTG customers named “one tool that covers everything” as their main reason for choosing PRTG, well above the survey average (https://blog.paessler.com/what-1088-it-teams-told-us-about-monitoring-in-2026). Teams moving off a suite built for large, telecom-scale network operations centers, like DX Spectrum, sometimes assume that ease of use means less capability, but PRTG's customization layer and vendor-agnostic protocol support, including SNMP, WMI, and flow data, are designed for exactly the multi-vendor environments those teams already run.
PRTG gives you dependency context inside the same interface you already use for monitoring, so you are not jumping between tools to understand how your devices relate to each other. With Paessler PRTG UVexplorer, a separate product whose data is surfaced inside PRTG, you get automated Layer 2 and Layer 3 topology maps, device inventory, and configuration backup and comparison, refreshed through scheduled discoveries rather than continuously. If your team relied on DX Spectrum's real-time, patented fault correlation to pinpoint root cause the moment something breaks, that is a genuine difference worth knowing before you switch. PRTG and PRTG UVexplorer give you strong dependency context and configuration history on a scheduled, point-in-time basis. For most teams, seeing the blast radius and recent configuration changes in one place is enough to speed up troubleshooting significantly, but it is worth going in with clear eyes about what changes.
FEATURE | PRTG PRTG | DX Spectrum DX Spectrum |
|---|---|---|
Cover network, servers, applications, and databases with one license | PRTG All core monitoring types included in every PRTG license, no add-on products required | DX Spectrum Limited: performance, flow, virtualization, and non-SNMP monitoring are sold as separate products (DX NetOps Performance Management, Network Flow Analysis, Virtual Network Assurance, Mediation Manager) |
Back up and track configuration changes, with topology context, inside your monitoring platform | PRTG Limited: available via PRTG UVexplorer, a separate product whose topology and configuration data is surfaced inside PRTG through scheduled discoveries | DX Spectrum Limited: configuration backup and change tracking require Network Configuration Manager (NCM), a separate installable product |
Deploy monitoring without a dedicated server per function | PRTG Runs as a single installation covering network, server, and application monitoringSed do eiusmod tempor incididunt ut labore | DX Spectrum Limited: documented distributed architecture typically requires a separate server for each product component |
Monitor multi-vendor network hardware | PRTG Broad out-of-the-box protocol support, including SNMP, WMI, and flow data, across hardware from any vendor | DX Spectrum Supports SNMP-based monitoring and vendor-specific MIBs across multi-vendor network hardware |
Monitor distributed or remote sites | PRTG Unlimited remote probes included in every license, so new sites add no extra licensing cost | DX Spectrum Limited: distributed monitoring is available, typically through additional servers or landscapes per site |
Correlate faults and find root cause at scale | PRTG Limited: alerts on thresholds and surfaces diagnostic data to guide investigation | DX Spectrum Includes a native, patented event correlation and root-cause analysis engine |
PRTG uses a single sensor-based license that already includes every monitoring type, from network devices to servers, applications, and databases. You pick a plan based on how many sensors you need, and every feature in that plan is included, with no separate modules to license for performance, flow, or configuration monitoring. If you're used to pricing that shifts depending on which product or add-on a capability sits in, this is what one predictable subscription looks like instead.
| License Name | License description | Price | License Details | Get started | Pricing Details | |
|---|---|---|---|---|---|---|
| PRTG 500 | $200 | per month paid annually | Buy nowBuy now | Enough to monitor multiple aspects of 50 devices | ||
| PRTG 1000 | $358 | per month paid annually | Buy nowBuy now | Enough to monitor multiple aspects of 100 devices | ||
| PRTG 2500 | $742 | per month paid annually | Buy nowBuy now | Enough to monitor multiple aspects of 250 devices | ||
| PRTG 5000 | $1,300 | per month paid annually | Buy nowBuy now | Enough to monitor multiple aspects of 500 devices | ||
| PRTG 10000 | $1,642 | per month paid annually | Buy nowBuy now | Enough to monitor multiple aspects of 1000 devices |
”Adopting PRTG has been like going from being in the dark to being in the light. Before, we had limited visibility into what was happening in the infrastructure and in the network. Now, however, thanks to the comprehensive dashboard and real-time notifications, we receive constant updates on the status of facilities and services, and our way of working has gone from passive to proactive.”
PRTG brings network, server, and application monitoring into a single dashboard, built from the devices auto-discovery finds on your network. Drag-and-drop dashboards let you arrange views around how your team actually works, not around which product a metric happens to live in. Everything below reflects the same PRTG interface you'd be working in day to day.
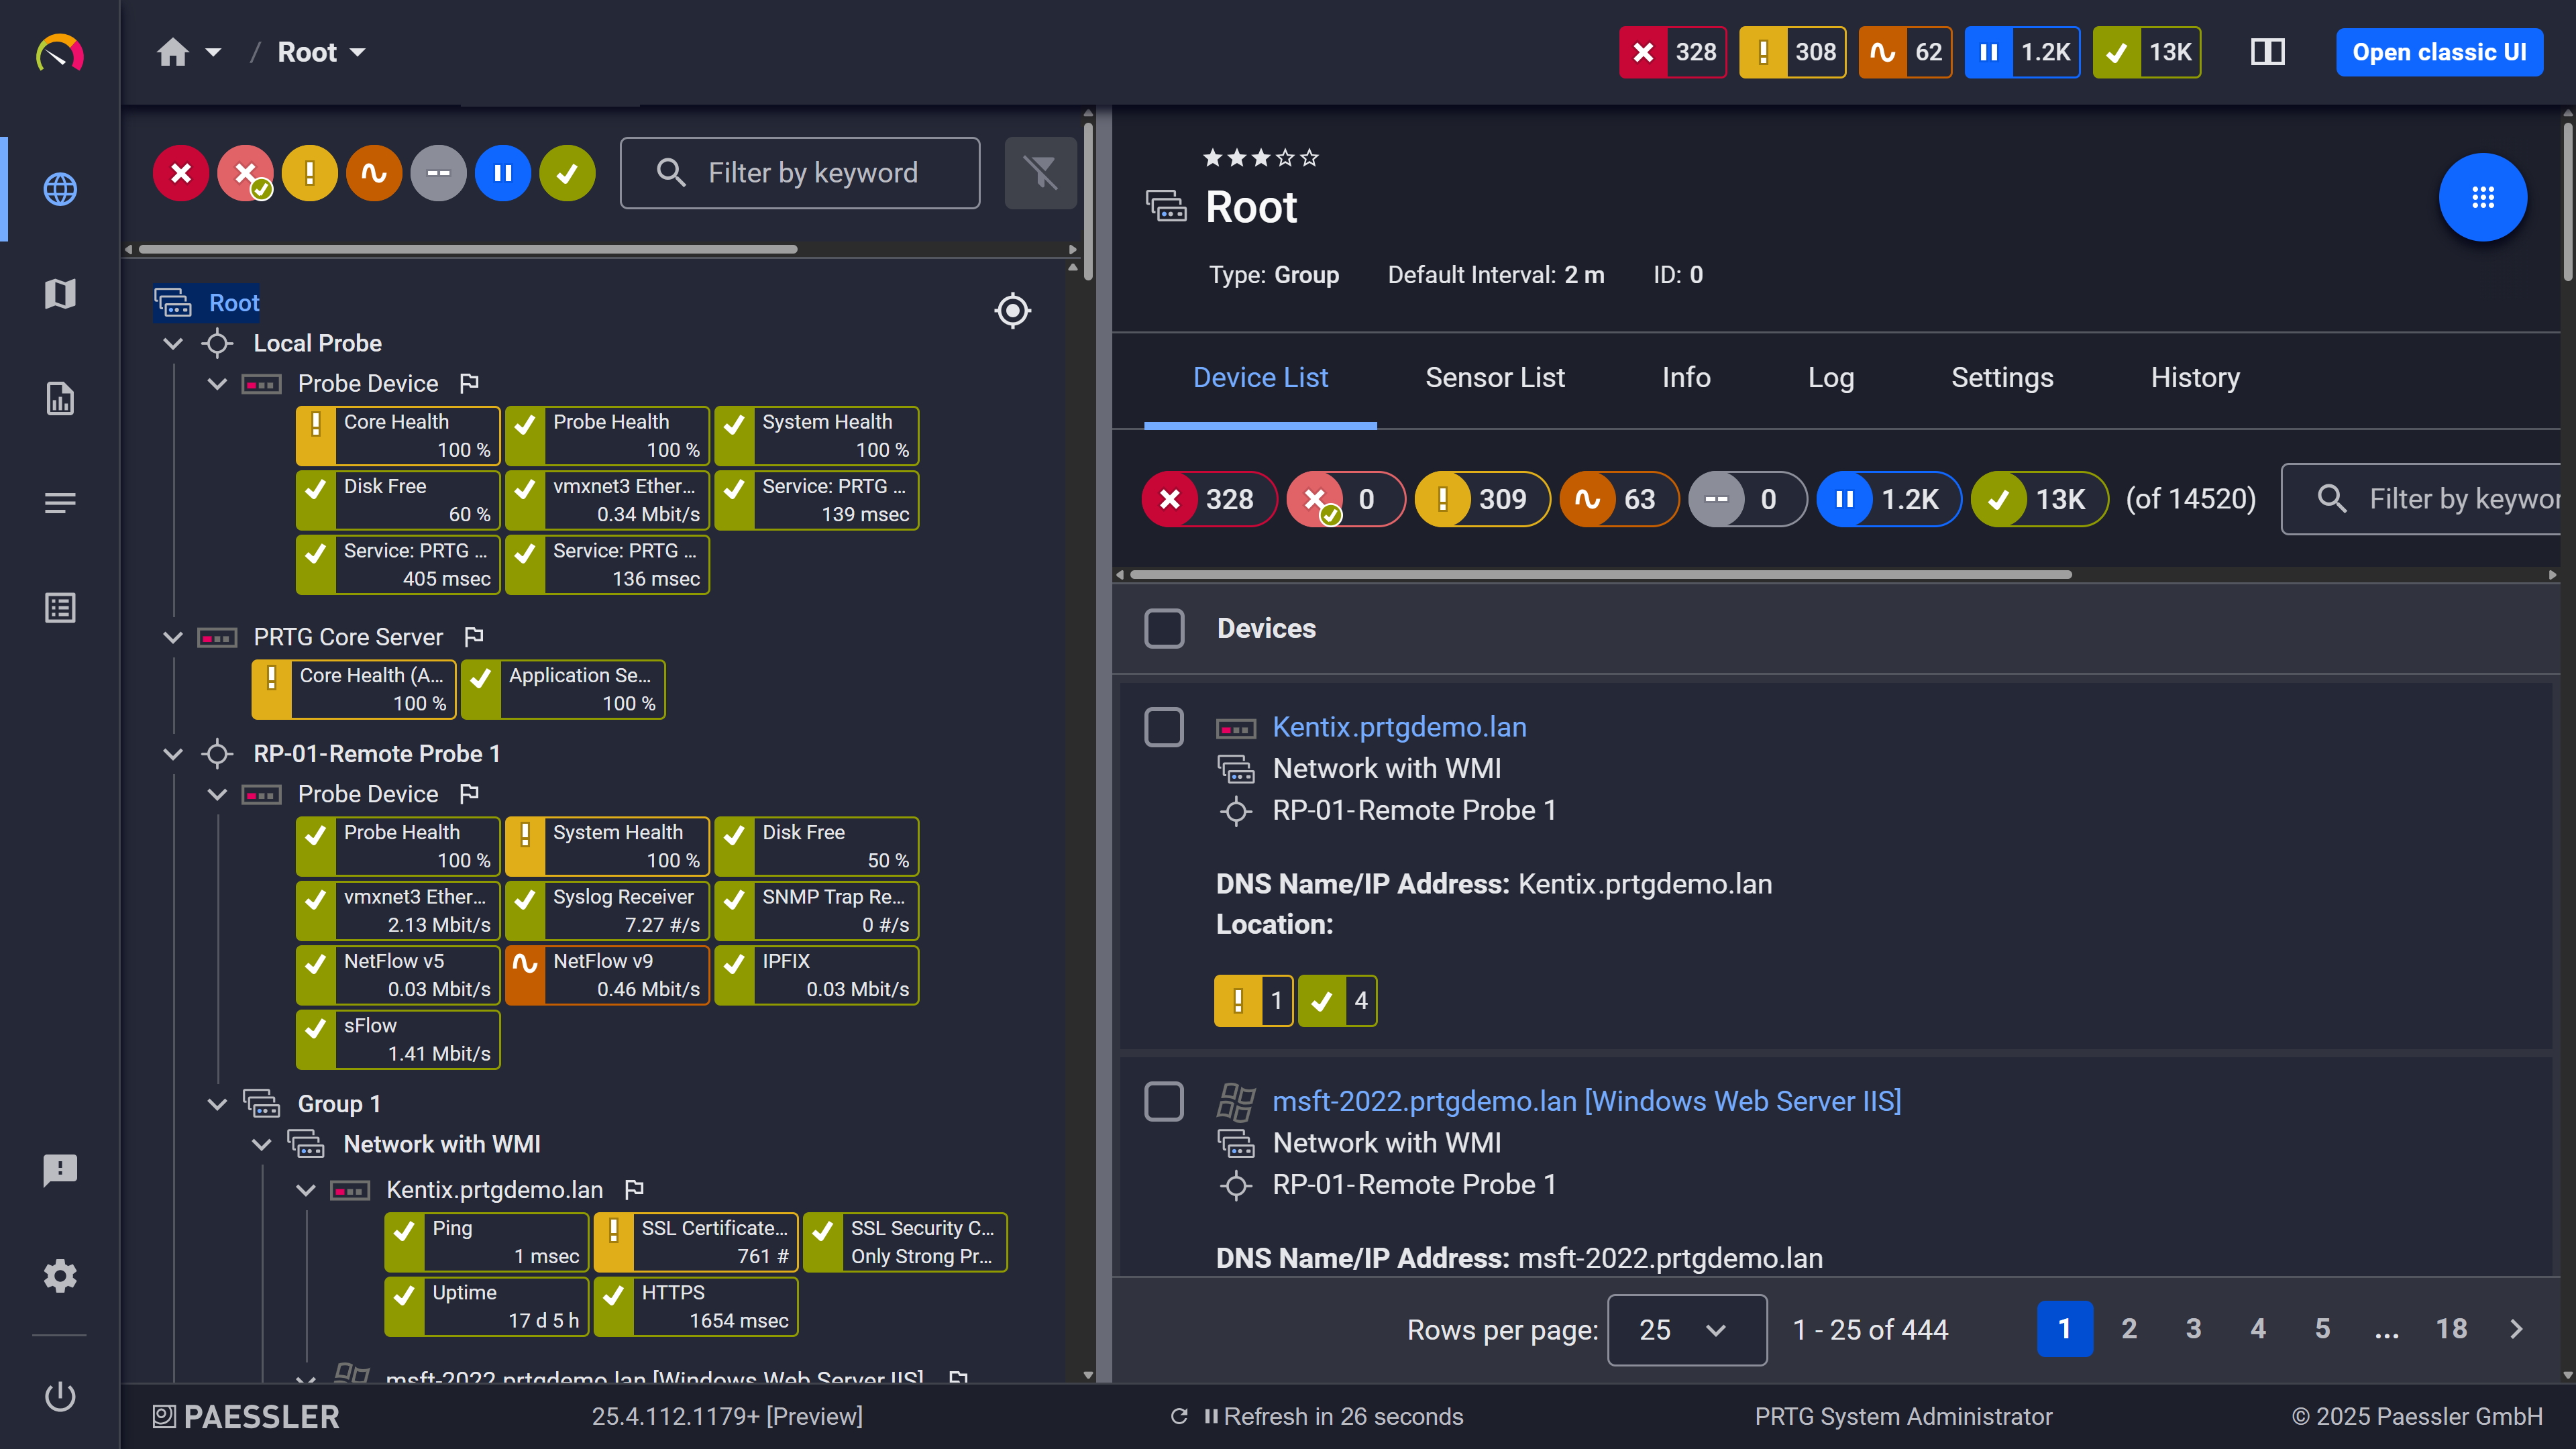
Device tree view: your full infrastructure, organized automatically after auto-discovery
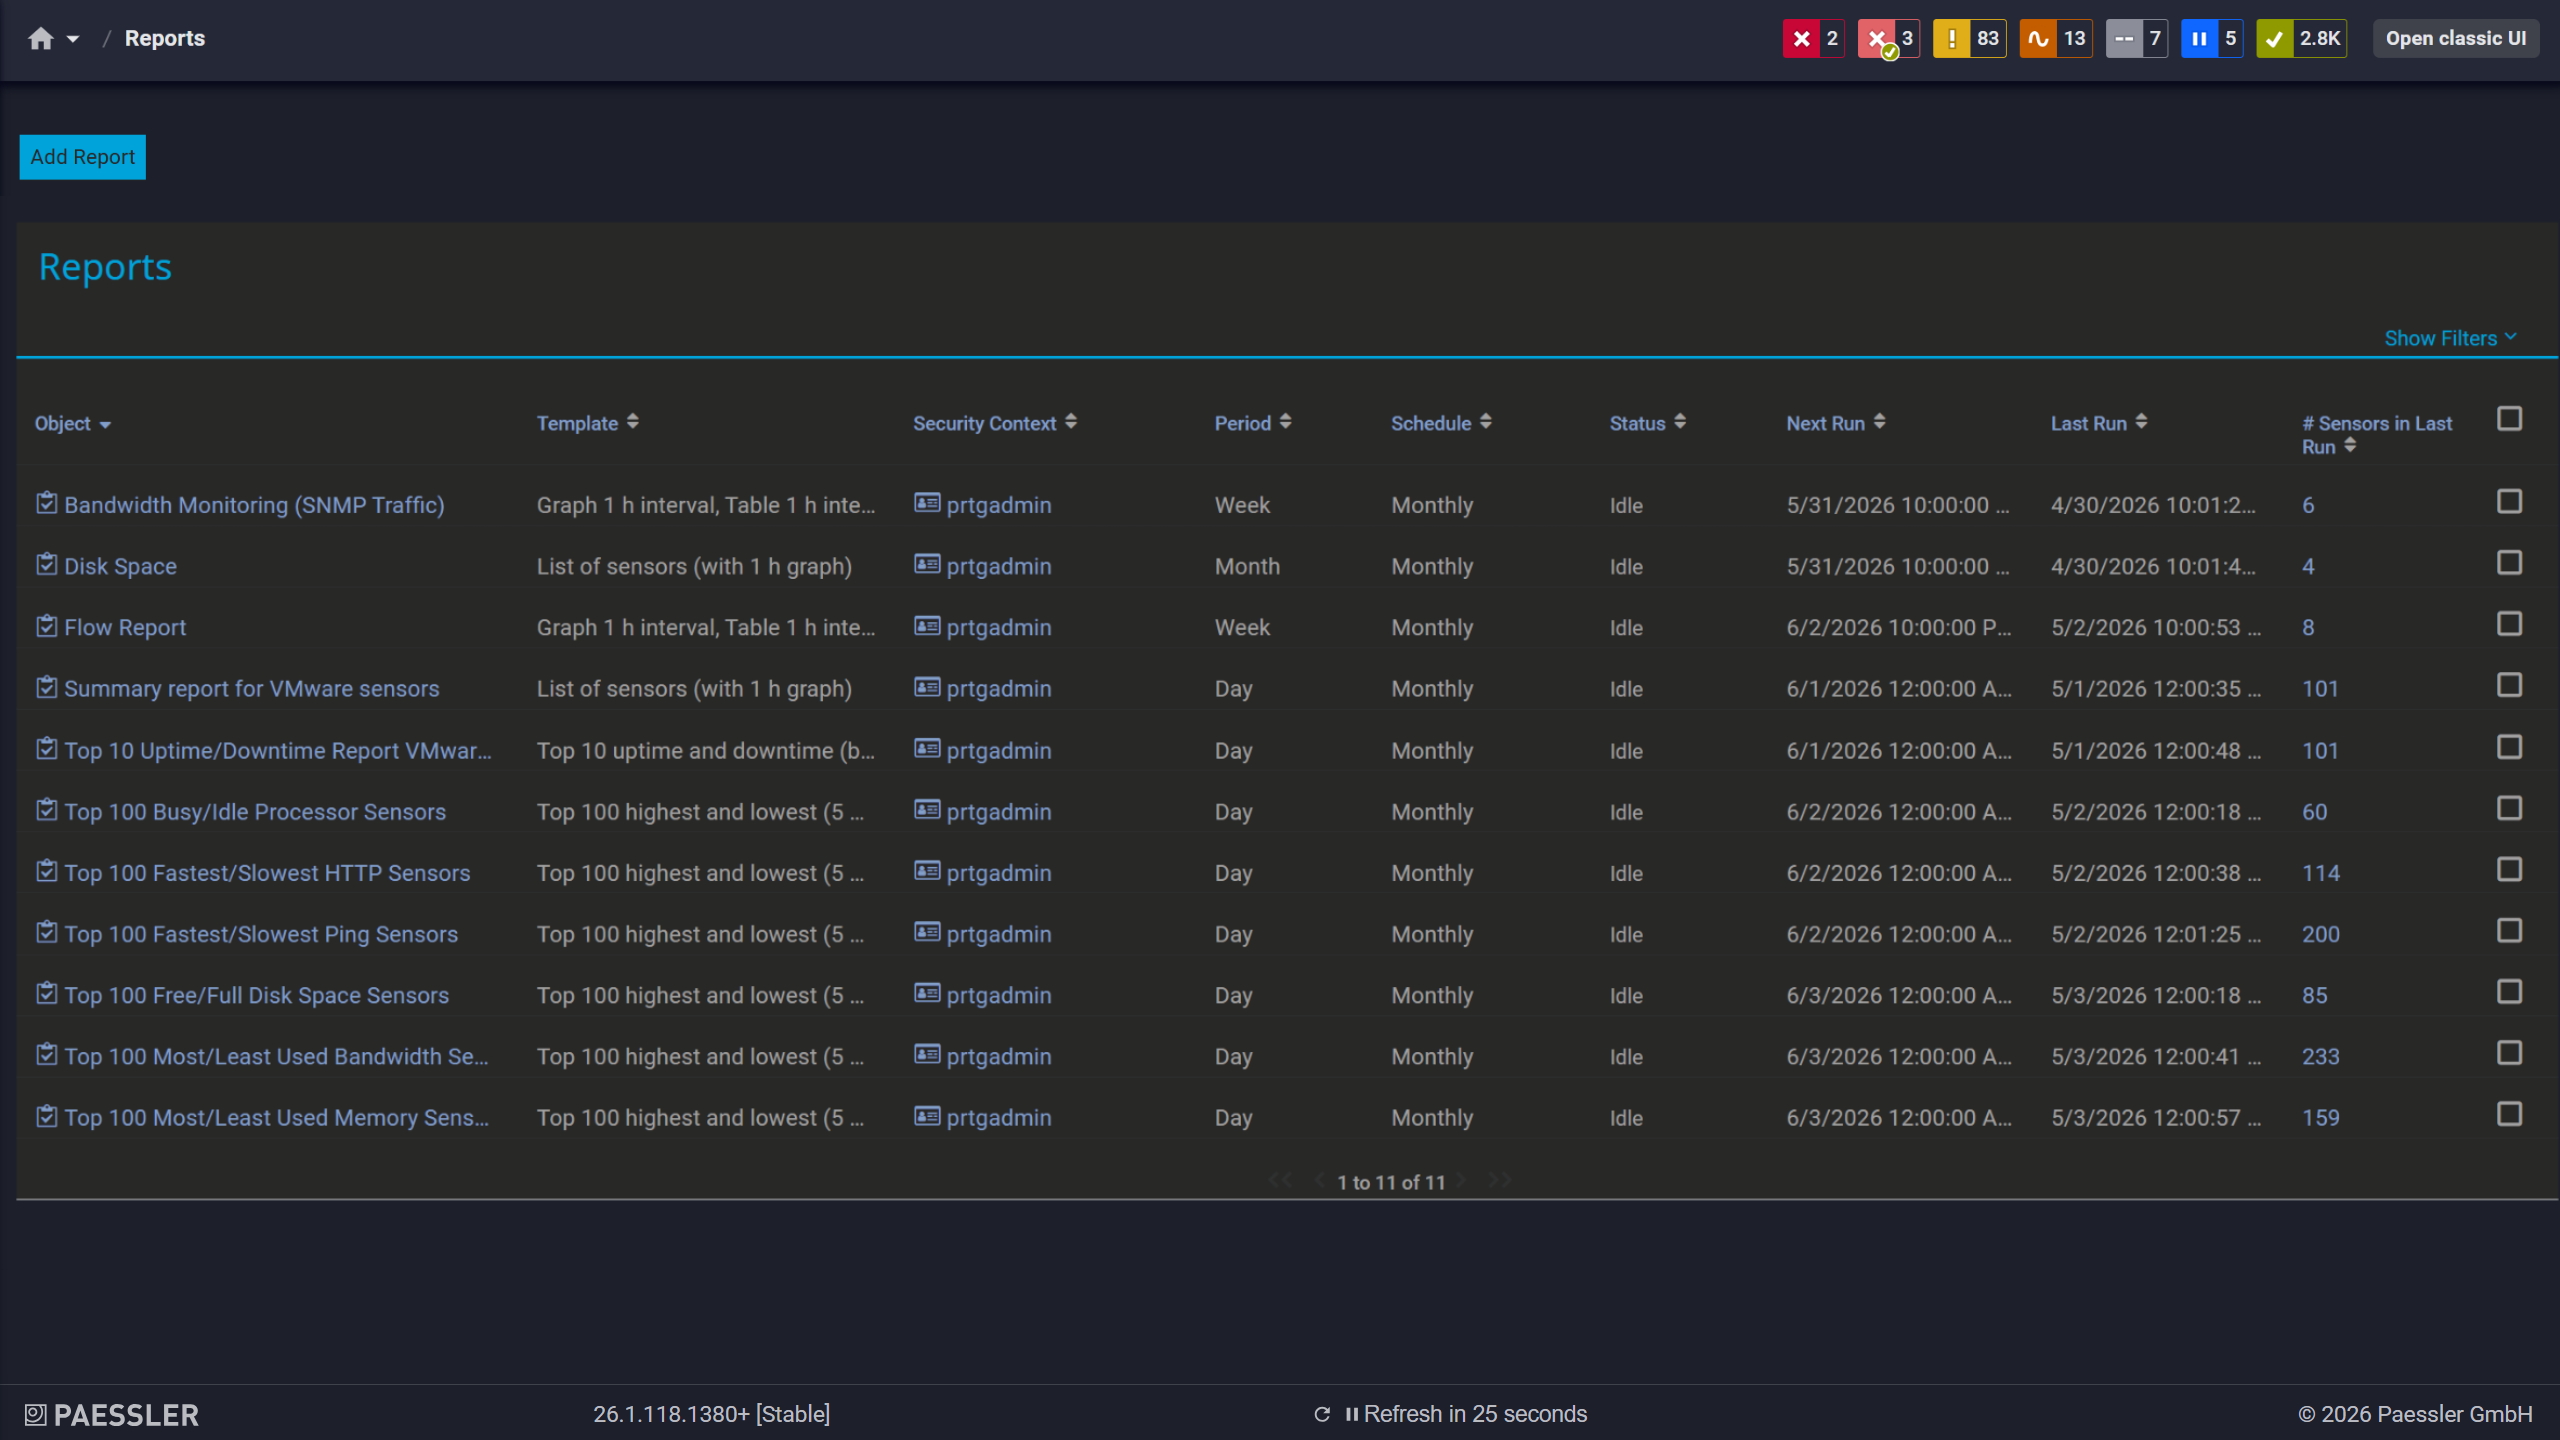
PRTG report screen: See all the reports generated and available to you in one easy to grasp overview
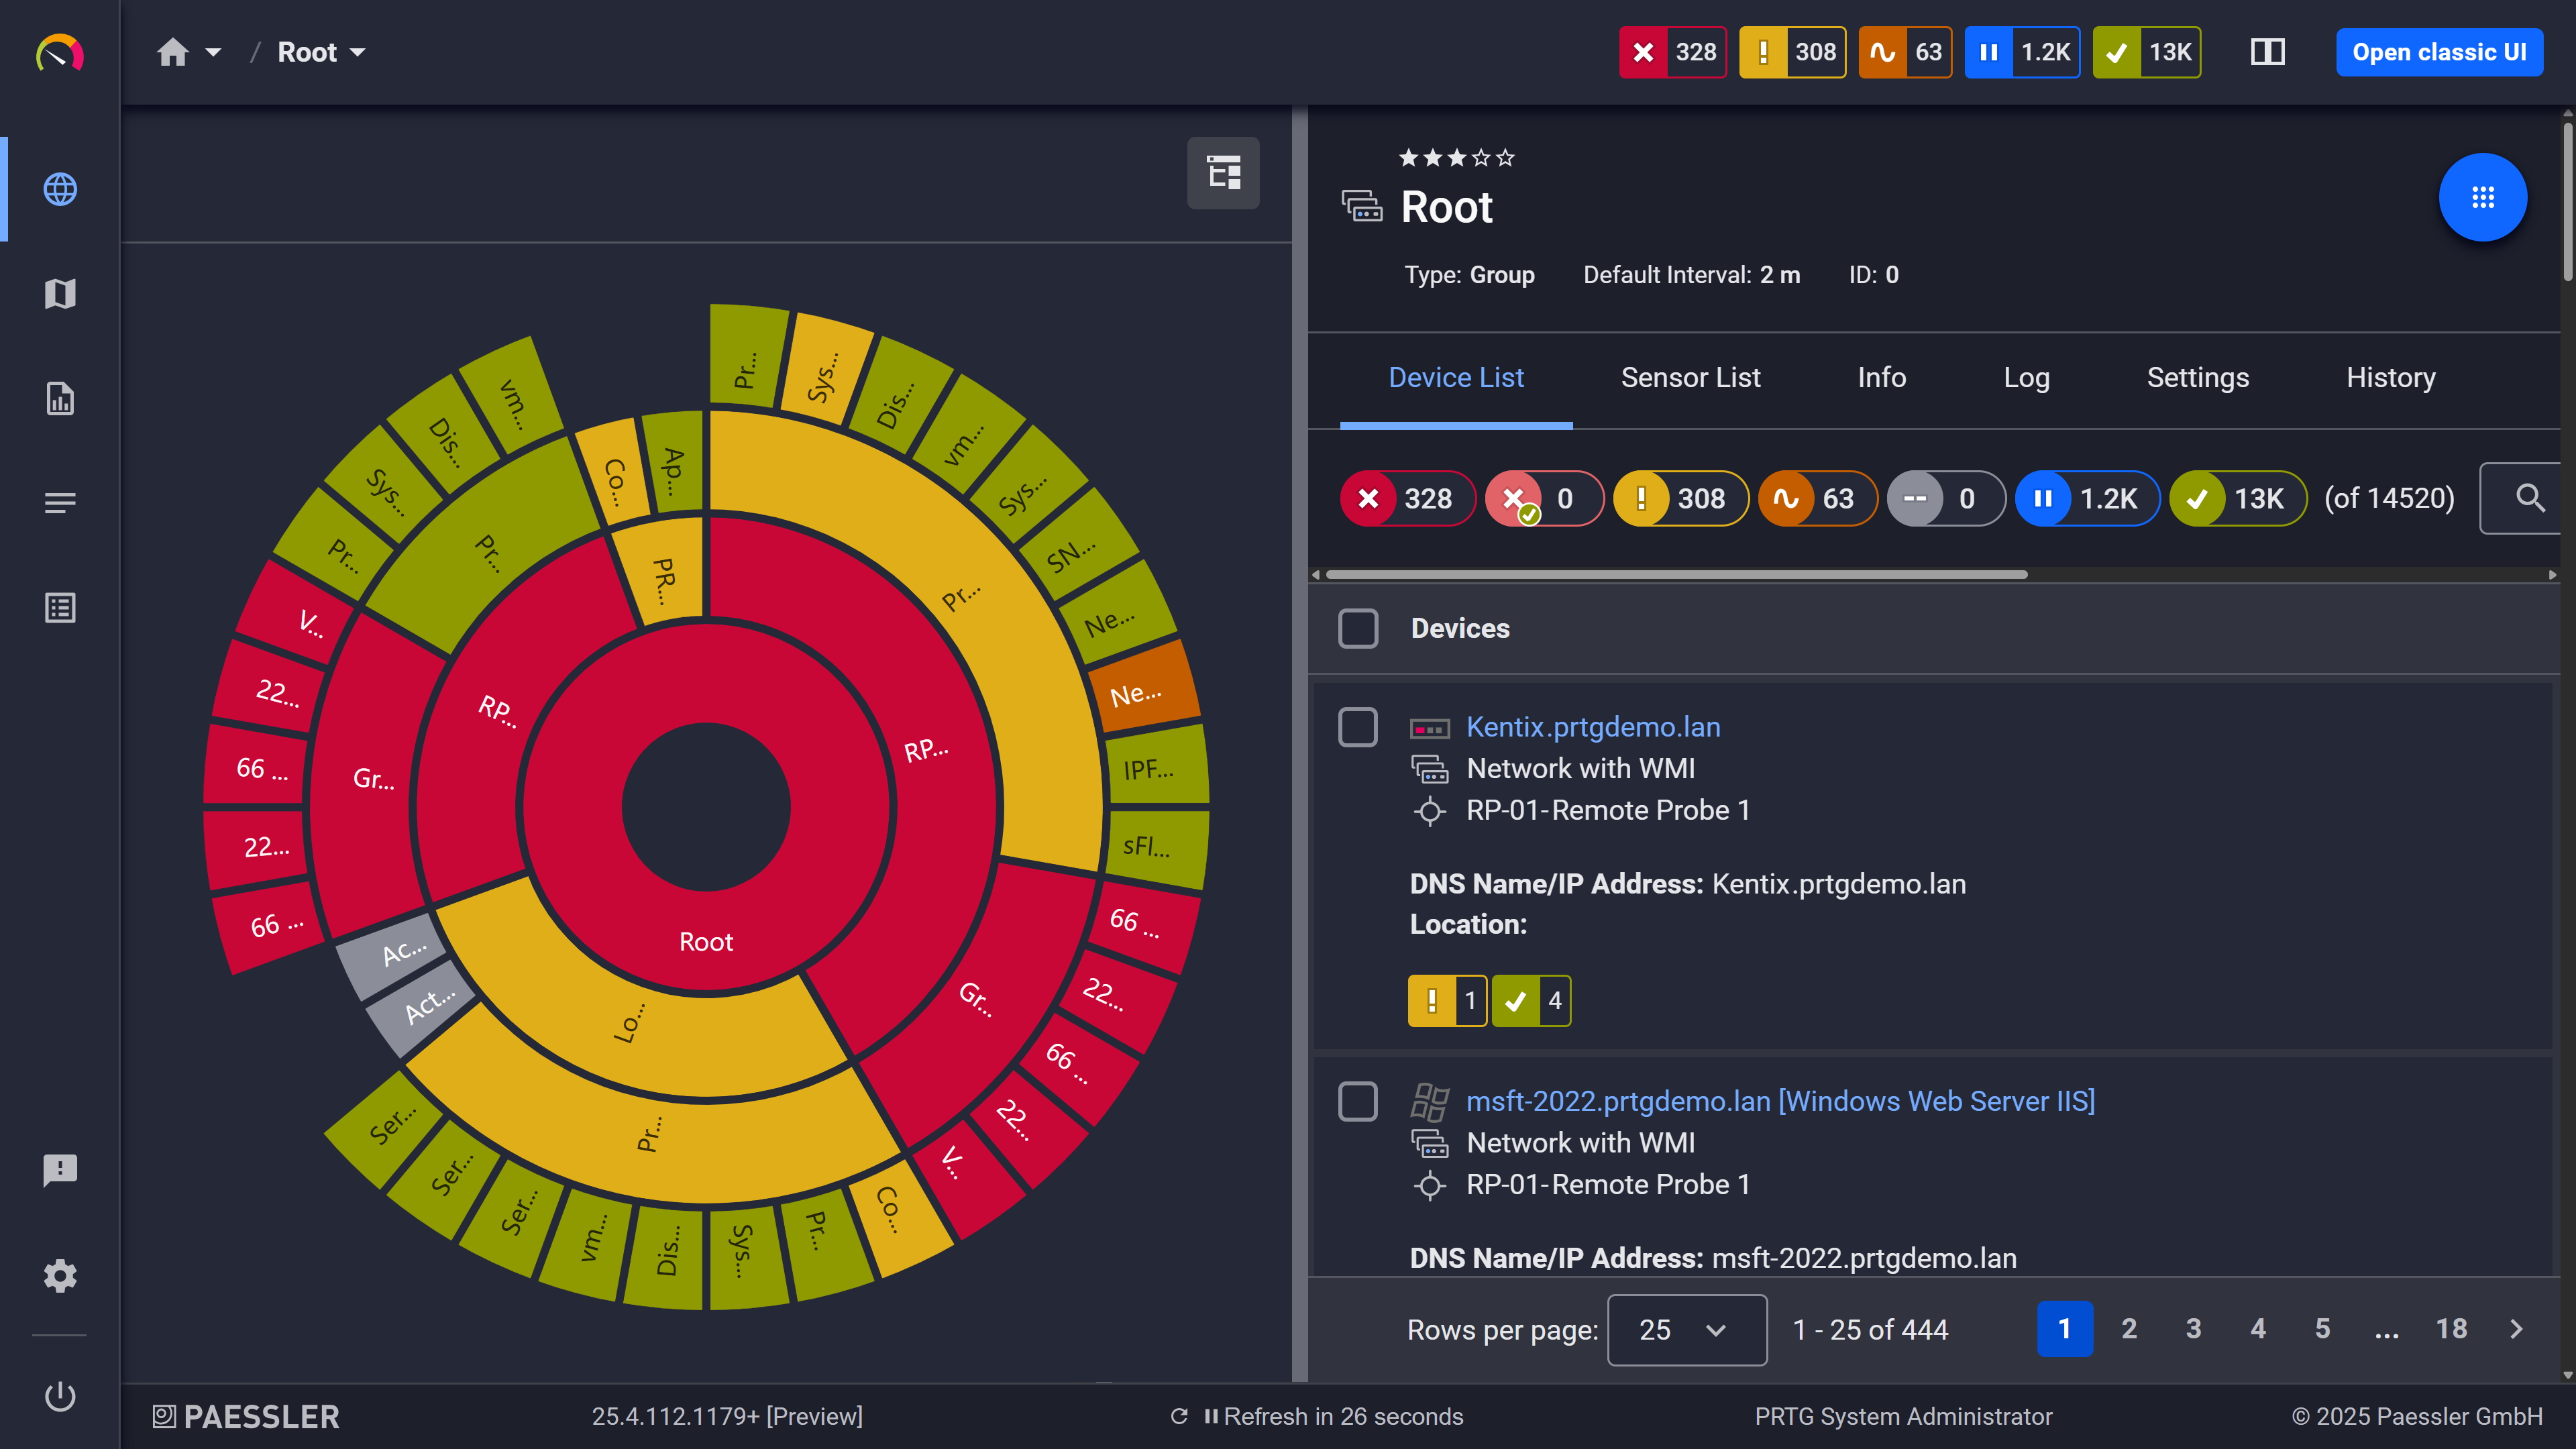
Custom dashboard: your easy-to-grasp overview built from your own sensors
Switching to PRTG follows one simple principle: your live network is the source. PRTG's auto-discovery reads what actually exists and rebuilds your monitoring directly from it. Four steps take you from your current setup to a running PRTG installation.
Have a list of hostnames or IP addresses of your current devices. This can be from your own documentation, or get it from your current monitoring tool. In DX Spectrum, export your modeled device list from OneClick's device view, or run one of the out-of-the-box inventory reports through the CA Business Intelligence (Jasper) reporting module. This list is your completeness checklist for the entire switch. Then install PRTG alongside your current tool: both can run in parallel during the transition.
Let auto-discovery rebuild your monitoring: Enter your IP ranges and device credentials (e.g. for protocols like SNMP or WMI). PRTG's auto-discovery scans the network segments, identifies device types, and creates suitable sensors from built-in device templates. The rebuild comes from your live network, so it reflects what is really there. Compare the result against your device list from step 1 and add any sensors auto-discovery could not infer.
Translate concepts, not configurations: What you know maps cleanly to PRTG. SpectroSERVERs become PRTG probes, models become devices, alarms become sensor alerts, and Global Collections become groups. Then recreate your alerting workflows with PRTG's notification templates and triggers.
Run both systems in parallel and tune: Compare alerts side by side for a few weeks. Adjust thresholds and schedules, and build the maps and reports your team and leadership rely on. Decommission the old tool once PRTG has proven itself in daily operation.
A tool switch is the ideal moment to find out what your old setup wasn't watching. Paessler PRTG UVexplorer, a separate product whose data is surfaced inside PRTG, runs scheduled discoveries that build a multi-vendor topology map and asset inventory of what actually exists on your network. Compare that inventory against what DX Spectrum was monitoring, and close any blind spots before they carry over. After cutover, the same point-in-time snapshot confirms that your PRTG rebuild caught everything.
Yes. DX Spectrum began as CA Spectrum and was renamed after Broadcom's acquisition of CA Technologies. Broadcom has since folded DX Spectrum, along with the rest of the DX NetOps product line, into a broader suite called Network Observability by Broadcom. Whether you're researching it as CA Spectrum, DX Spectrum, or DX NetOps Spectrum, you're looking at the same core fault management product.
A sensor is a single monitored value, like the CPU load on a server, the traffic on a switch port, or the status of a URL. Most devices need around 5 to 10 sensors to be fully monitored. PRTG licenses are based on the total number of sensors you use, not the number of devices, users, or separate products, so one license scales with your actual monitoring needs.
PRTG holds strong ratings across independent review platforms, including Gartner Peer Insights, G2, Capterra, and Spiceworks, built on a large and active base of IT professionals. Our 2026 customer survey also found that 92.8% of PRTG customers rate their day-to-day monitoring experience as good or excellent. PRTG is used across industries with demanding uptime requirements, from data centers to healthcare to manufacturing.
No. PRTG monitors the vast majority of devices and services without installing any software agent, using protocols like SNMP, WMI, SSH, and flow data instead. For monitoring remote sites or systems outside your main network, you install a lightweight PRTG probe on one system in that location, not an agent on every device you want to monitor. A handful of specialized sensors do use agent-based data collection, but for most network, server, and virtualization monitoring, PRTG works entirely agentless.
PRTG's core platform focuses on monitoring and alerting rather than topology mapping or configuration backup. For automated Layer 2 and Layer 3 topology maps, dependency visualization, and configuration backup and comparison, Paessler offers Paessler PRTG UVexplorer, a separate product whose results are surfaced directly inside your PRTG interface. PRTG UVexplorer refreshes topology and configuration data through scheduled discoveries rather than continuously, so what you see reflects your most recent scan.
Yes. PRTG offers a full-featured 30-day trial with an unlimited number of sensors, so you can test it against your actual environment before deciding on a license. After the trial period, it automatically becomes the free edition, which includes up to 100 sensors for as long as you need them. There's no obligation to purchase, and you can upgrade to a paid license once you know how many sensors your environment needs.
Yes. PRTG includes distributed monitoring with remote probes at no extra license cost, so you can bring additional sites, branch offices, or cloud environments under one dashboard as you grow. The same sensor-based license that covers your first site covers every additional site you add. Decentralized IT teams running infrastructure across multiple locations use PRTG to keep a consistent view everywhere, without needing per-site contracts or separate installations.
We also compared PRTG with other monitoring tools:
SolarWinds might be interesting for extremely complex network environments. But it also means you need to invest in higher costs for a platform made up of different modules and add-ons (that cost extra).
Checkmk is a comprehensive network monitoring tool, but it uses open-source add-ons for some functions. This means additional work in setting up, operating, and maintaining the monitoring systems.
New Relic offers strong asset performance management and observability, but full IT infrastructure monitoring can be costly and requires a fair amount of manual configuration.
Comparison with New Relic
Wireshark is best known as an open-source packet analyzer for network inspection. While excellent for troubleshooting it lack automated alerting, long-term monitoring and requires expertise to use effectively.
Comparison with Wireshark
Start a 30-day trial with unlimited sensors, no commitment required.
Tell us your device count and we'll send you a quote.
See PRTG in a live demo with one of our monitoring experts.
