• Company
    • About Us
    • Case Studies
    • Press Center
    • Events
    • Careers
    • Blog
    • Contact us
  • Contact us
  • Login
 
  • English
    • Deutsch
    • Español
    • Français
    • Italiano
    • Português
Paessler
                    - The Monitoring Experts
  • Products
    • Paessler PRTG
      Paessler PRTGMonitor your whole IT infrastructure
      • PRTG Network Monitor
      • PRTG Enterprise Monitor
      • PRTG Hosted Monitor
      • PRTG extensionsExtensions for Paessler PRTGExtend your monitoring to a new level
    • Icon Features
      FeaturesExplore all monitoring features
      • Maps & dashboards
      • Alerts & notifications
      • Multiple user interfaces
      • Distributed monitoring
      • Customizable reporting
  • Solutions
    • Industries
      IndustriesMonitor various industry sectors
      • Industrial
      • Healthcare
      • Data Center
      • Education
      • Finance
      • Government
    • IT Topics
      IT TopicsMonitor all areas of IT
      • Network Monitoring
      • Bandwidth Monitoring
      • SNMP Monitor
      • Network Mapping
      • WiFi Monitoring
      • Server Monitoring
  • Pricing
  • Resources
    • Getting Started
      Getting StartedModules for self-paced learning
    • How-to Guides
      How-to GuidesGet the most out of PRTG
    • Videos & Webinars
      Videos & WebinarsLearn from Paessler experts
    • IT  Knowledge
      IT KnowledgeExpand your IT knowledge
    • PRTG Manual
      PRTG ManualFull documentation
    • Knowledge Base
      Knowledge BaseShare community knowledge
    • PRTG Sensor Hub
      PRTG Sensor HubGet sensors, scripts & templates
    • Trainings
      PRTG TrainingLearn how to work with PRTG
  • Partners
    • icon star
      New Partners and MSPBecome a new partner or MSP
    • icon partner
      Partner PortalLog in to your partner account
    • Deal Registration
      Deal RegistrationRegister your sales opportunities
    • icon search
      Find a PartnerFind partners selling Paessler products
    • icon technology
      Technology AlliancesSee Paessler technology partnerships
  • Company
    • About Us
    • Case Studies
    • Press Center
    • Events
    • Careers
    • Blog
    • Contact us
  • Contact us
  • Login
  • English
    • Deutsch
    • Español
    • Français
    • Italiano
    • Português
  • Get a quote
  • Free trial
  1. Home>
  2. Tools>
  3. sFlow Tester
sFlow Tester Logo


Testing sFlow export configurations

sFlow Tester dumps the data of all sFlow packets that a computer receives from an sFlow enabled router – useful when debugging bandwidth monitoring configurations based on the sFlow protocol.

Free Download
sFlow Tester
sFlow Tester

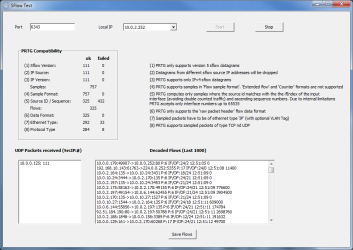
The sFlow Tester is a small program that simply dumps the data of all sFlow packets that a computer receives from an sFlow enabled router. This can be useful when debugging bandwidth monitoring configurations based on the common sFlow protocol (version 5).

First, the sFlow protocol must be enabled and configured on the router. The router must be given the IP address of the computer running sFlow tester, so that the UDP data packets with sFlow data are sent to this computer.

Instructions

  • Download the ZIP file and start SFTest.exe.
  • Enter the "Port" number and select the "Local IP" address that you have configured as sFlow packet target in your router. The drop down list will show all IPs available on the current computer.
  • Click on "Start".
  • For each packet the computer receives, you should now see activity in the areas "PRTG Compatibility" and "Decoded Flows".

Restrictions

There are a number of restrictions regarding the sFlow tester program:

  • Only sFlow version 5 datagrams are supported
  • Only IPv4 flows are supported
  • You should only test packets from a single source
  • Only the "raw packet header" format is supported
  • "Counter" formats cannot be processed
  • PRTG processes only samples where the source ID matches the ifIndex of the input interface (avoiding double counted traffic) and ascending sequence numbers. Due to internal limitations, only interface numbers up to 65535 are supported.
  • Sample packets have to be of ethernet type "IP" (with optional VLAN tag)
  • Sampled packets of type TCP and UDP are supported

How to Interpret Data

  • PRTG Compatibility: Shows the number of received sFlow packets and categorizes all sFlow 5 packets the same way the PRTG sFlow sensor does. This helps understand how flow packets are handled by PRTG's sensor. Usually, you should see most packet counts in the ok column. Packet counts in the failed column doesn't necessarily mean a malfunction, but merely indicates that these packets will not be accounted by PRTG. This can be due to a wrong sFlow version, or because PRTG generally drops packets containing aggregated data, or packets with an unsupported ethernet or protocol type, sample format, etc.
  • UDP Packets received (SrcIP:#): Shows the number of received packets for each IP address from which the program has received UDP packets. This field should at least show the IP address of one sFlow router. If you configure more than one router to send sFlow packets to the computer on the specified port, you may see several combinations of IP address and count.
  • Decoded Flows (Last 1000): Shows the last thousand sFlow packets in decoded format. Each line contains information about one packet. This includes source and target IP address and protocol information (6=TCP, 17=UDP).

History

  • April 15th, 2014: sFlow5Tester v1.1.2 supports Expanded Flow Samples
  • Mar 3rd, 2011: sFlow5Tester V1.0 Initial Release
sFlow Tester Logo
Free Download

sFlow Tester (0.8 MB)

This Freeware program is provided free for Paessler customers, mainly as a diagnostic tool for users of PRTG Network Monitor. Please understand that we can not provide support for the program.

Products

  • Paessler PRTG
    Paessler PRTGMonitor your whole IT infrastructure
    • PRTG Network Monitor
    • PRTG Enterprise Monitor
    • PRTG Hosted Monitor
    • PRTG extensions
      Extensions for Paessler PRTGExtend your monitoring to a new level
  • Icon Features
    FeaturesExplore all monitoring features

Monitoring with PRTG

  • Network monitoring
  • Bandwidth monitoring
  • SNMP monitoring
  • Network mapping
  • Wi-Fi monitoring
  • Server monitoring
  • Network traffic analyzer
  • NetFlow monitoring
  • Syslog server

Useful Links

  • PRTG Manual
  • Knowledge Base
  • Customer Success Stories
  • About Paessler
  • Subscribe to newsletter
  • PRTG Support
  • PRTG Consulting
  • PRTG Feedback & Roadmap

Contact

Paessler GmbH
Thurn-und-Taxis-Str. 14, 
90411 Nuremberg 
Germany

[email protected]

+49 911 93775-0

  • Contact us
©2025 Paessler GmbHTerms & ConditionsPrivacy PolicyImprintReport VulnerabilityDownload & InstallSitemap
Brother Printer Errors Brother Printer Errors Brother Printer Errors