A new PRTG release, new sensors and lots of new information for you. Take a look at version 19.4.54 together with me.
Read the complete blog post here
![]()
Release Notes
for PRTG 19
Software versions in this channel are not
updated anymore.
Please consider upgrading to the latest "stable" version.
Please use the "Auto-Update" feature to update your PRTG installation
with the latest stable version:
In the PRTG web interface, navigate to Setup | Auto Update.

November 25th 2019 – Version 19.4.54.1506
Blog article
New
Sensors
WMI Disk Health |
The new WMI Disk Health BETA sensor monitors the health of virtual or physical disks on your Windows servers. It shows the operational and health status of a disk. It does not matter which disk type, the sensor works with all kinds like SSD, SATA, or SAS, for example. The WMI Disk Health sensor shows detailed information about the operational status like degraded or predictive failure in the sensor message. With this new sensor type, you will always have a quick and easy overview of the status of your disks. |
WMI Storage Pool |
The new WMI Storage Pool BETA sensor monitors a storage pool on your Windows servers. A storage pool consists of multiple disks and provides RAID functionality without real RAID hardware. This new sensor type shows the operational and health status of the storage pool, as well as free space, and provides detailed information about the operational status like stressed or relocating. With the new WMI Storage Pool sensor, you will always have an overview of the status of your storage pool. |
Important
Security
Server |
This version includes an important security update for your PRTG core server. We recommend that you update as soon as possible. Please find more details in the email we sent to the email address provided in your license information. Special thanks go to Aleksandr Melkikh from Positive Technologies for pointing us to the right direction. (CVE-2019-19119) |
Improved
Security
Access Rights |
Users with restricted access rights to sensors now only see a sensor's relationship in the Similar Sensors Overview if their user account has access to both related sensors. |
Sensors |
We fixed a potential Remote Code Execution (RCE) vulnerability of the HTTP Transaction sensor. (CVE-2019-11073) |
Server |
We fixed a potential Remote Code Execution (RCE) vulnerability of the PRTG core server. Many thanks to Sittikorn Sangrattanapitak - Cybersecurity Researcher, Nuttakorn Tungpoonsup & Ammarit Thongthua - Secure D Center Research Team, Secure D Center Co.,Ltd. for reporting the issue. |
Version Number |
PRTG does not show the current version number in HTTP headers anymore to improve security by not providing attackers potentially relevant information. For the same reason, the page footer of the web interface now only shows the version number on pages that require a logged in user account. |
Fixed
Sensors
MySQL v2 |
MySQL v2 sensors support user-defined variables in your SQL scripts again. This did not work in previous PRTG versions due to a change in the MySQL library, which added a new connection setting to allow user variables. The sensors showed the error message Fatal error encountered during command execution when running a SQL statement with user-defined variables. |
Port |
You can now also save the advanced Port sensor setting Goal into custom device templates. The goal of a Port sensor can be an open or closed port to define an up status. |
SNMP Library |
SNMP Library sensors again create each channel only once. If you selected more than 10 OIDs when adding the sensor in previous versions, the last channel of the sensor created for the first 10 OIDs was also created as first channel of the sensor added for the next 10 OIDs. |
Fixed
Server
Cluster |
Minor stability improvements for PRTG cluster installations |
Data Purging |
PRTG now correctly applies the data purging value for Historic Sensor Data even if you define a value that is greater than 1095 days (3 years). In previous versions, PRTG did not purge historic data anymore if you used a value above 1095 days. You can now define a maximum value of 9999 days. |
Overload Protection |
PRTG will only create one ToDo ticket and one log entry again when overload protection gets activated due to 100 failed logons since the last start of PRTG. In previous versions, PRTG was too noisy with an active overload protection, which could result in way too many tickets indicating that Web server is slowing down login attempts (Protective measure) in some cases. |
Reports |
|
Search |
The PRTG search function works properly again. In some cases, the search did not provide any results in previous PRTG versions and required a restart of the PRTG core server to work. |
Sensor Messages |
PRTG now correctly shows sensor messages in logs and notifications on status change (for example, due to a breached limit) even in certain corner cases. In previous versions, timing issues could result in logs and notifications just showing "OK" instead of the sensor message in such cases. |
Fixed
WebGUI
Libraries |
Libraries do not contain buttons to add devices, sensors, or to run an auto-discovery anymore. The buttons had no functionality anyway because libraries are designed for visualization, not interaction. |
Maps |
The object selector in the map designer to link a map object with an object from the device tree shows the whole tree again. In previous versions, objects at the bottom of the device tree were cut off so you could not select them. |
Multi-Edit |
You can see and change Sensor Display settings again when you open the settings of one or more sensors via multi-edit. |
Updating |
The auto-update confirmation dialog window now immediately reacts when you click the Yes, install update now button. |
Changed
API
JSON |
The value of the notifiesx_raw field returned by the API call api/table.json?content=sensorxref is never null now and always the same value no matter which language. In previous versions, notifiesx_raw could be empty as well. If you use external tools or scripts that use the PRTG API, please keep this change in mind and adjust them if necessary. |
Changed
WebGUI
Optional Downloads |
The PRTG web interface now also shows download links for PRTG Desktop on the Welcome page and under Setup | Optional Downloads on PRTG instances hosted by Paessler. Furthermore, we removed the PRTG Tools tab from the web interface section Setup | Optional Downloads. Of course, you still can download our free network tools on our website. |
Changed
Clients
Enterprise Console |
We no longer deliver the Enterprise Console with the PRTG installer. This change will not affect running Enterprise Console instances, but please note that they may stop working anytime in upcoming PRTG versions. We recommend that you switch to PRTG Desktop soon. Note: The Enterprise Console might not be able to automatically connect to the PRTG server anymore after you have updated to version 19.4.54 and you receive the error message Server runs incompatible software version. In this case, exit the Enterprise Console as well as the Windows tray and run the Enterprise Console again. If it still cannot connect, run PRTG Enterprise Console.exe with the ignore flag. For more information, see the Knowledge Base article Enterprise Console doesn't connect to PRTG core server anymore after updating PRTG. What can I do? Note: If you update from an older PRTG version, your Enterprise Console may show an error message asking you to update the Enterprise Console. This will fail because of the missing installer as of PRTG 19.4.54. For your convenience, you can still directly download the latest installer as well as the latest version of the Enterprise Console here and try to manually update: prtg_enterprise_console_54.zip If you want to update the Enterprise Console on the PRTG core server, extract PRTG Enterprise Console.exe into your PRTG Network Monitor program folder and run it. On other systems, you can just run PRTG_Enterprise_Console_Installer.exe to update. Please note that this is a workaround to keep the deprecated Enterprise Console running if mandatory and may not work in every case. |
Improved
Various
All Parts of PRTG |
Various other minor fixes and improvements, updated user manual, updated language files |
Note
Sensors
Python Script Advanced |
PRTG version 20.1.55 that we will publish in January 2020 will include a new Python distribution because of the end-of-life announcement for Python 3.4. We already inform you now about the change because your custom Python scripts must be compatible with Python 3.7 when you update to PRTG 20.1.55. You only need to consider the change if you are using the Python Script Advanced sensor. PRTG will also create a ToDo ticket with further information for you in this case. |
Note
Security
Web Server |
PRTG version 20.1.55 that we will publish in January 2020 will include a more strict web server security by default to keep PRTG as secure as possible. TLS 1.2 will be the new default web server connection security. The change may affect you if your PRTG users or third-party systems use outdated versions of browsers or PRTG mobile apps, the Enterprise Console, or old automation tools that interact with the PRTG API. You will receive a ToDo ticket in PRTG with further information. |
Note
Tools
PRTG Certificate Importer |
There is a new version of the PRTG Certificate Importer available since December 12, 2019. The new version is compatible with PRTG 19.4.54 and later. Installer and executable are now signed to confirm their integrity. Additionally, we introduced a new versioning system that follows the PRTG versioning, so the current version of the PRTG Certificate Importer comes with version number 19.4.54. For more details and to download it, please see PRTG Certificate Importer on our website. |
October 29th 2019 – Version 19.4.53.1912
Blog article
 By Sascha Neumeier • Nov 11, 2019
PRTG Release 19.4.53 brings version 2 of the SNMP Fujitsu System Health Sensor
PRTG release 19.4.53 has been available in our stable channel for a few days now. Take some time and find out what's new in this version.
Read the complete blog post here
Read the complete blog post here
New
Sensors
SNMP Fujitsu System Health v2 |
The new SNMP Fujitsu System Health v2 BETA sensor monitors the status of a Fujitsu PRIMERGY server via iRMC. It might also work with the Fujitsu product lines PRIMEQUEST, ETERNUS, and CELSIUS if they have iRMC available. The sensor shows useful metrics for CPU usage, fans, memory modules, battery, and power supply of your Fujitsu servers. We are looking forward to hearing your feedback about this new beta sensor! Please send your feedback to [email protected]. Note: The new SNMP Fujitsu System Health v2 sensor replaces the original SNMP Fujitsu System Health BETA sensor and addresses the feedback we received from you about this sensor type. Please note that any previously deployed SNMP Fujitsu System Health sensors will immediately stop working upon updating to PRTG 19.4.53 or later. You need to add the new version of the sensor to continue monitoring your Fujitsu servers. To keep historic data, you can pause existing instances of deprecated sensors. |
Improved
Security
Login |
We improved the security of the password recovery function on the PRTG login page. PRTG will not provide any information about user accounts anymore when you request a new password. |
Sensors |
We updated the Npcap library that Packet Sniffer and Packet Sniffer (Custom) sensors use to monitor your traffic. The Npcap version (0.992) distributed with previous PRTG versions included a security issue with an ACE vulnerability (CVE-2019-11490). Note: Under certain circumstances, the PRTG update process may stop when trying to install Npcap and Windows shows the error message A LWF & WFP driver installation tool has stopped working. In this case, please manually stop npcapoem.exe (for example, via the Windows Task Manager) to continue the PRTG update process. For more information, see the Knowledge Base article https://kb.paessler.com/en/topic/86904. |
Fixed
Server
Active Directory |
PRTG automatically clears the cache for Active Directory integration again. In previous versions, the hourly clearing of the cache did not work so old passwords still worked after changing them until you logged in with the new password or manually cleared the cache. |
Cloning |
Clones of flow sensors (NetFlow, IPFIX, jFlow, sFlow) are now able to automatically receive data after you have resumed them. If you clone a flow sensor to the same probe, the clone will keep the IP selection as defined in the sensor settings to receive flow packets. If you clone a flow sensor to a different probe, the clone will receive flow packets on all available IP addresses of the probe by default. |
Dependencies |
You can save settings again even if PRTG detects an invalid Dependency Type on the same page, for example, if a sensor is not existing anymore that was selected as dependency type for the current object. In previous versions, you were not able to save the settings in this case—even if you just renamed the object—because data validation failed and you received the message Error (Bad Request) when saving. |
Device Tree |
We fixed an issue where the PRTG core server was not able to load the device tree anymore. This happened in rare cases if there were inconsistent or pending internal tree states. |
Logging |
We fixed an issue where PRTG did not correctly recognize the size of log files in corner cases. The issue could result in a steadily increasing log file size instead of making a copy and recreating the file, so that log files could still become very large in such cases. |
Notification Triggers |
We improved the performance of the Notification Triggers tab. Actions like adding or removing notification triggers provide feedback considerably faster than in the previous PRTG versions 19.3.51 and 19.3.52. |
PRTG Status |
The PRTG Status page shows the correct value for StateObjects again. |
Scanning Interval |
Objects now show the selected scanning interval even if you have deleted this interval from the Monitoring settings. |
Shutdown |
We improved the shutdown process of the PRTG core server. In certain cases, ending the dependency thread took very long. This could result in a failing automatic restart because the check for successful termination of the PRTG server service could not be performed in such cases. |
Fixed
WebGUI
Maps |
The map object Device Tree (S) now shows the correct color for the status Down (Acknowledged), just like all other device tree map objects. |
Tables |
We improved the layout of data tables on sensor overview pages by making the alignment of columns more consistent. The Channel column is always left-aligned as before, all other columns are now right-aligned. |
Improved
Various
All Parts of PRTG |
Various other minor fixes and improvements to all parts of PRTG, updated user manual, updated German language file |
Note
Sensors
Python Script Advanced |
PRTG version 20.1.55 that we will publish in January 2020 will include a new Python distribution because of the end-of-life announcement for Python 3.4. We already inform you now about the change because your custom Python scripts must be compatible with Python 3.7 when you update to PRTG 20.1.55. You only need to consider the change if you are using the Python Script Advanced sensor. PRTG will also create a ToDo ticket with further information for you in this case. As of PRTG 20.1.55, the path that PRTG uses for Python is %programfiles%\PRTG Network Monitor\python3\ on 32-bit (x86) systems, and %programfiles(x86)%\PRTG Network Monitor\python3\ on 64-bit (x64) systems. |
Note
Clients
Enterprise Console |
We do not officially support the Enterprise Console with PRTG version 19.4.53 or later anymore. Please note that your Enterprise Console may stop working in upcoming versions without further notice due to changes to the PRTG server. Please use PRTG Desktop as successor of the Enterprise Console. |
October 10th 2019 – Version 19.4.52.3515
Fixed
Notifications
Summarized Notifications |
PRTG can send summarized notifications again. In previous PRTG versions 19.3.51 and 19.3.52, PRTG only sent the first notification but not the following summarization. The issue affected all notification summarization options of your notification templates. |
October 1st 2019 – Version 19.3.52.3502
Blog article
By Sascha Neumeier • Oct 9, 2019
All You Need to Know About PRTG Release 19.3.51 and 19.4.52
The PRTG release version 19.4.52 has been available for installation in the stable channel for a few days now. Maybe you already have the version in use, or you are planning the update. As regular...
Read the complete blog post here
Read the complete blog post here
New
Sensors
WMI Battery |
The new WMI Battery BETA sensor monitors status and available capacity of batteries that are connected to Windows devices. Additional channels of this new sensor type show voltage, time estimations until the battery is full or empty depending on the status charging or discharging, and an overall battery health value. The sensor makes it possible for you to see the level of batteries in your IT infrastructure at a glance. PRTG alerts you as soon as a battery threshold is breached. You can even generate reports to get to know how much time laptops spend charging, for example. Please note that the sensor is in beta status and only works if the required WMI battery classes are available on the monitored device. We welcome any feedback about the sensor and what you are trying to monitor. Please send your feedback to [email protected], thank you! |
Improved
WebGUI
Device Icons |
We added new device icons for several vendors. PRTG will automatically add suitable icons to devices detected via auto-discovery if possible. Of course, you can also manually select any device icon in the device settings, section Additional Device Information. The new set includes icons for the following vendors.
|
Improved
Sensors
SNMP Dell PowerEdge Physical Disk |
Newly added SNMP Dell PowerEdge Physical Disk sensors now include the enclosure ID in the sensor name if available. For example, a sensor name can be Physical Disk 1:0:0:16, where the first of four numbers is the enclosure ID (here: 1). If there is no enclosure ID available, there will be three numbers in the sensor name, for example, Physical Disk 0:0:16. This improvement will help you to easier find the disk you are looking for in PRTG. |
Fixed
Security
PRTG Core Server |
We fixed potential reflected XSS vulnerabilities with medium severity on the PRTG core server. The potential vulnerabilities affected tag filters, object IDs, and the contact support/feedback page. Please note that the fixed vulnerabilities required a logged in PRTG user account to be exploited. |
Sensors |
We fixed a potential Denial of Service (DoS) vulnerability of the HTTP Full Web Page sensor. Please note that the fixed vulnerability required a logged in PRTG user account with elevated rights to be exploited. (CVE-2019-11074) |
Fixed
Sensors
Event Log (Windows API) |
You can filter for more than two event IDs with the Event Log (Windows API) sensor again. In the previous version, the input validation of the event ID field in the sensor settings did not properly work when you entered a comma-separated list of more than 2 IDs. |
Exchange (PowerShell) sensors |
Exchange (PowerShell) sensors now correctly close the runspace. In previous versions, Exchange (PowerShell) sensors sometimes showed a down status with the error message Fail to create a runspace because you have exceeded the maximum number of connections allowed. The fix applies to all Exchange (PowerShell) sensor types, Exchange Backup (PowerShell), Exchange Database (PowerShell), Exchange Database DAG (PowerShell), Exchange Mail Queue (PowerShell), Exchange Mailbox (PowerShell), Exchange Public Folder (PowerShell). |
EXE/Script sensors |
EXE/Script and EXE/Script Advanced sensors again support the special characters round brackets "()", dot ".", and comma "," in the Parameters field. This allows you to pass arrays from the sensor to the script. |
Sensor Factory |
We fixed an issue where, in rare cases, modifying the spike filter in combination with Sensor Factory sensors caused issues with the PRTG core server, resulting in gray sensors, for example. |
SNMP Cisco System Health |
|
SNMP HPE BladeSystem sensors |
Channels of SNMP HPE BladeSystem Blade and SNMP HPE BladeSystem Enclosure System Health sensors will not be saved into custom device templates anymore. We changed it this way because dynamic sensor channels often lead to empty channels when they are created by custom device templates. |
SNMP Poseidon Environment |
You can add SNMP Poseidon Environment sensors again. The field validation in the settings when adding the sensor did not correctly work and prevented you from creating the sensor. |
SNMP Traffic |
|
SQL v2 sensors |
We fixed an issue with SQL v2 sensors where the impersonation with Windows or database credentials prevented the sensor to read the file with the SQL query if the impersonated user had no access to the query files. The error message in this case was Parameter -query is missing. The fix applies to the sensor types ADO SQL v2, Microsoft SQL v2, MySQL v2, Oracle SQL v2, Oracle Tablespace, PostgreSQL. |
SSL Certificate |
The SSL Certificate sensor properly compares wildcard CN/SAN (Common Name/Subject Alternative Names) and SNI (Server Name Identification) again. In previous versions, the sensor showed a down status with the message CN/SAN do not match in this case. |
SSL Security Check |
If you create a device template that includes SSL Security Check sensors, running an auto-discovery with the template will now actually create SSL Security Check sensors. In previous versions, the auto-discovery erroneously added Port sensors in this case. |
Windows Updates Status (PowerShell) |
The Windows Updates Status (PowerShell) sensor will create more than one channel again if it can retrieve according data. The change will especially improve the sensor if the target device runs on Windows 10, Windows Server 2016, or later. |
SNMP sensors and System Information |
We implemented a minor stability improvement for the SNMP engine of PRTG. SNMP sensors as well as System Information tables retrieving data via SNMP can handle NUL in response strings again. For example, System Information tables showed the message Error: SNMPERR_GENERR (SNMP error #-1) with a timeout while waiting in WorkEnter in previous versions when receiving NUL strings. |
Optional Sensor Channels |
Sensors again only create optional channels if the channels are intended to be created. In the previous PRTG version 19.3.51, sensor types like, for example, SNMP Traffic and Ping erroneously created additional channels even if you did not select the according options in the Add Sensor dialog. |
Spike Filter |
Spike filters that you can optionally set apply to the tabs 30 days (Graph 2) and 365 days (Graph 3) again, as well as to historic data reports. In the previous PRTG version, the filter only worked for live data and the 2 days graph and table. |
Fixed
Notifications
Notification Delivery |
We removed the Test SMTP Settings button in the Notification Delivery settings on PRTG instances that are hosted by Paessler. As PRTG hosted by Paessler customer, you use the email infrastructure of Paessler so that testing the SMTP delivery settings is not necessary for you. |
Notification Templates |
PRTG user accounts with read/write rights and write or full access rights to a notification template can now change the user group as the recipient of an email, push, or SMS notification. Logged in read/write users can see and select all user groups they are member of, as well the currently selected user group in the Send to User Group field of a notification template. In the Send to User field, read/write users can see and select all user accounts from all user groups they are a member of, as well as the currently selected user account. |
SMS Notifications |
|
Fixed
Reports
PDF Layout |
We fixed an issue with PDF reports that erratically caused big gray boxes in generated reports. |
PDF Stability |
We implemented stability improvements for PDF reports with many sensors, especially regarding timeouts with the error message Error creating PDF report: [timestamp] navigate error: timed out waiting for response from chrome. |
Fixed
Libraries
Node Types |
Libraries again only show a subtree if you select Show a subtree of the device tree in the library as Node Type for a library node. In previous versions, library nodes additionally showed an unordered list of sensors included in the subtree. |
Usability |
The buttons to collapse and expand library nodes are now also available in the smallest view (S). |
Fixed
Server
Data |
We fixed an issue where values of primary sensor channels with negative channel ID were not displayed in some data tables, for example, the Traffic Total channel of SNMP Traffic sensors (channel ID -1). The value of this channel was missing in headers of historic data reports and as Last Value in Cluster Node tables, for example, when set as primary channel in the last PRTG version. |
Logging |
|
Memory |
We fixed an issue where in certain cases the PRTG server showed a too high memory consumption on large installations with, for example, several thousand sensors. The PRTG server will also use less memory than before when cloning hundreds of objects in the device tree at the same time. |
PRTG Core Server |
We removed an unnecessary readlock on the PRTG server that could lead to a deadlock with an unintended PRTG server restart in rare cases. Another readlock we fixed was caused by calculations of the Sensor Factory sensor and could prevent the PRTG server to restart. |
PRTG GUI Starter |
Opening the PRTG web interface with the PRTG GUI Starter now also works if you have set the connection security of your web server to High security (TLS 1.1, TLS 1.2). The PRTG GUI Starter is only used if you open PRTG via the shortcut PRTG Network Monitor that is created by default on your server during the PRTG installation. |
Fixed
WebGUI
Dependencies |
It is not possible anymore to configure a sensor to be its own dependency. Having a sensor as its own dependency resulted in a situation where a sensor endlessly paused itself when it switched to a down status without the possibility to resume the sensor. |
Gauges |
The gauge of a sensor's primary channel now always shows the unit for the minimum value. In previous version, the unit for the minimum value was missing if the minimum was 0 and the channel had a custom unit. |
Multi-Edit |
You can now acknowledge one or more down states on the Alarms tab of probes using the multi-edit menu, as well as open the settings of one or more probes. |
Tables |
We fixed some layout issues of meta-scan tables in sensor settings so that especially large tables are displayed in a better way. |
Firefox |
Opening the context menu in the PRTG web interface via right-click now even works if you use Firefox on macOS. |
Internet Explorer 11 |
We fixed some more layout issues that occurred when accessing the PRTG web interface with Internet Explorer 11. For example, the Save button was cut off on some pages, the Hide and Show buttons for master dependencies in the dependencies graph were missing, and tickets sometimes occupied more space than given to them. |
Changed
Server
Probes |
Connecting remote probes now automatically downgrade to the correct version if the PRTG core server runs an older version than the probe. |
Tags |
It is not possible anymore to add the same tag to one object in PRTG more than once. |
User Accounts |
It is not possible anymore to create user accounts with a login name that includes the special characters " / \ [ ] : ; | = , + * ? > < Note: User accounts that already existed before the update to PRTG 19.3.51 and have a login name that includes one of the outlined special characters will still be able to login after the installation of version 19.3.51. However, affected user accounts will not be able to change and save their account settings without changing the login name. |
Improved
Various
All Parts of PRTG |
Various other fixes and improvements to all parts of PRTG, updated user manual, updated German and Japanese language files |
Note
Sensors
SNMP Fujitsu System Health |
The upcoming PRTG version 19.4.53 will include a new, significantly improved SNMP Fujitsu System Health sensor. We already inform you now about the change because any previously deployed SNMP Fujitsu System Health sensors will immediately stop working upon updating to PRTG 19.4.53 or later and need to be added anew. |
Note
Outdated Windows Versions
Outdated Windows Versions |
It is not possible anymore to install PRTG on the outdated operating system Windows XP. This is a side-effect of changing the PRTG license check to a 64-bit binary. Please make sure you install PRTG on an officially supported operating system. |
Note
Known Issues
Summarized Notifications |
In the current version, PRTG does not send summarized notifications. You will receive the first down notification in any case but not the following summarization. We recommend that you choose the option Always notify ASAP, never summarize until we provide a fixed version if you strongly rely on potentially summarized notifications and do not want to miss any information. Status: resolved with PRTG 19.4.52.3515 |
September 10th 2019 – Version 19.3.51.2830
Improved
Sensors
Active Directory Replication Errors |
The Active Directory Replication Errors sensor now supports different Active Directory naming contexts. When you add the sensor, you can now choose between Configuration (default), Schema, DomainDnsZones, Domain, and ForestDnsZones as Naming Context to check your Windows Domain Controller for replication errors. In previous versions, the sensor always used Configuration as naming context. |
Improved
Notifications
Notification Delivery |
PRTG will now provide clearer communication in logs and tickets when an SMS notification fails due to a missing definition for an SMS provider in the Notification Delivery settings. |
Notification Triggers |
You can now directly create a new Notification Template while editing or defining a Notification Trigger without leaving the notification trigger tab. Click the plus symbol (+) in the dropdown list of a trigger to create a new notification template for the notification trigger. |
Improved
Server
Active Directory |
We improved the login process for Active Directory (AD) users by explicitly requesting read-only access. |
Device Templates |
If you create a new device template, you now only need to define a name for the template. You do not have to provide a file name anymore, PRTG will automatically create the corresponding template file with the extension .odt. |
PRTG Core Server |
Performance and memory footprint improvements for the PRTG core server, as well as several other improvements and fixes |
Reporter |
We added enhanced logging to the new reporter engine to be able to better help you in case of issues when generating reports. |
Improved
Security
Maps |
We fixed a potential XSS vulnerability in the context of maps. Thanks to Dmitry Galecha from Positive Technologies for reporting the issue. |
Notifications |
Passwords of Execute Program notifications, webhooks for Slack and Microsoft Teams notifications, as well as the AWS Secret Access Key of Amazon SNS notifications are now masked on the History tab of according notification templates in the PRTG web interface. Notification templates are only accessible for PRTG administrator users and read/write users with access rights for a particular notification template. We found the issue in internal tests, it was not public before. If your PRTG installation is affected, you will receive a Todo ticket in PRTG. Please follow the instructions there. |
Sensors |
Passwords of the following sensor types are now also masked in log files when you enable the debug option: FTP Server File Count, HTTP XML/REST Value, SIP Options Ping, Citrix XenServer Host, Citrix XenServer Virtual Machine, IPMI System Health |
Improved
Language Files
Language Files |
Major update for all language files with around 585 improved strings per language. We especially focused on consistency of translations throughout PRTG. |
Fixed
Sensors
Event Log (Windows API) |
You can filter for two event IDs with the Event Log (Windows API) sensor again. In previous versions, the input validation of the event ID field in the sensor settings did not properly work when you entered a comma-separated list of IDs. Note: With this version, it is not possible to filter for more than two event IDs. We plan to fully support filtering for multiple IDs again for the next PRTG version 19.3.52. |
EXE-based Sensors |
Sensors that require .NET version 4.7.2 now actually show the required version number 4.7.2 in the error message if the .NET framework version 4.7.2 is not available on the probe system. The full error message is This sensor requires the .NET Framework version 4.7.2 (code: PE104) For more details, please see this Knowledge Base article. |
Flow Sensors |
It is possible again to clone flow sensors and devices on which flow sensors are running (for example, NetFlow sensors). In previous PRTG versions, you received Error (Not Found) when cloning flow sensors. Note: To receive data with a flow sensor clone, please open the Settings tab of the sensor and click Save. |
SNMP Traffic |
|
VMware Datastore (SOAP) |
The VMware Datastore (SOAP) sensor now also properly works if the name of the monitored datastore starts or ends with host. In previous version, the sensor showed a down status with the error message The object '[name]' has already been deleted or has not been completely created in such cases. |
Fixed
Probes
Memory Leak |
We fixed a small memory leak on the PRTG probe system. The memory leak was caused by SNMP sensors that use SNMP bulk walks with more than 20 channels. |
Probe Connections |
We improved the stability of remote probe connections to the PRTG server. In some scenarios, customers encountered frequent disconnects of remote probes with the previous PRTG version 19.2.50. Note: In certain cases, there may still occur issues with probe connections. We are working on further stability improvements for upcoming releases. |
Probe GID |
PRTG now always blocks connection attempts of deleted or rejected remote probes if there is an according entry in the Deny GID field of the Probe Connection Settings. The entry was not correctly saved in previous versions when using the French language file, Other language versions were not affected |
Fixed
Server
Cluster |
Sending support bundles from failover nodes works again. |
Dependencies |
We fixed an issue with dependencies where in certain cases devices and sensors did not resume automatically from paused by dependency. This happened, for example, after changing the dependency type from "Master object for parent" to "Use parent". |
Device Tools |
Opening the Service URL of a device via Device Tools now even works if the service URL contains an ampersand (&). |
Geo Maps |
Locations that you newly define for devices and groups in PRTG show up at the corresponding location in geo maps again. |
PRTG Core Server |
We fixed an issue with the PRTG core server that was not able to start and remained stuck in Loading Graph Cache if the configuration file contained an invalid speed trigger value. This happened in a few cases by error after cloning sensors with defined with speed triggers. |
Raw Data Buffer |
We fixed an issue that resulted in a full raw data buffer (see the according channel of the Core Health sensor) in certain scenarios with the previous PRTG version 19.2.50. This could happen, for example, when having many remote probes connected. The issue could also cause a loss of monitoring data with many sensors in unknown status. |
User Accounts |
It is possible again to change the settings of a user account at any time. Previous PRTG versions erroneously showed the error message A user with this login name already exists. Login names have to be unique. in certain cases when changing user settings. This especially happened for user accounts that you integrated via Active Directory. |
Fixed
WebGUI
Access Rights |
Primary groups of read/write user accounts in PRTG again automatically get write access to libraries, maps. reports, notification templates, and schedules that they create. This way, the new object remains visible after a page fresh for the user who created it. |
Breadcrumbs |
We implemented some minor improvements for the consistency of breadcrumbs and their translations. |
Contact Support |
PRTG user accounts with read/write rights can now also open the contact support form via Setup | Contact Support in the main menu bar. |
Dark Theme |
Historic data graphs keep their dark theme appearance again when you use the scroll and zoom buttons. |
Homepage URL |
Changing the PRTG Homepage URL in your account settings or via Make This My Homepage in the main menu bar on a PRTG hosted by Paessler instance now actually takes effect. |
Hover Popups |
|
Reports |
|
Search |
Text that you are searching for in PRTG is correctly displayed again even if your search contains special characters or whitespaces. Search results were not affected by the issue. |
Tags |
Tags can now contain certain special characters like ampersand (&) and percentage (%) without causing issues with the PRTG web interface when you filter for such a tag. |
Welcome Page |
The ticket count on the PRTG welcome page again shows the correct number of open tickets that are assigned to you. |
Fixed
Various
All Parts of PRTG |
Various other fixes and improvements to all parts of PRTG, updated user manual |
Changed
Sensors
Loopback Adapter |
PRTG will not install a loopback adapter as part of the Npcap library for Packet Sniffer sensors anymore. When enabled, the adapter could lead to unwanted side-effects on other services, for example, DHCP servers. |
Changed
Tree Version
Tree Version Update |
The configuration file of this version is not downwards compatible with previous PRTG versions. |
Note
Known Issues
Enterprise Console |
The Enterprise Console will show two error messages when you close it: MM Operation after uninstall. and Runtime error 204 The messages do not have negative impact. You can ignore them and just close the message windows. Status: Will not be fixed. Please note that we will stop officially supporting the Enterprise Console with PRTG 19.4.53. Please use PRTG Desktop as successor of the Enterprise Console. |
Optional Sensor Channels |
Some sensor types create optional channels that were not intended to be created. For example, SNMP Traffic sensors create all channels from settings section Additional Channels even if they were not selected in the Add Sensor dialog. The Ping sensor creates channels for minimum and maximum ping time, as well as the packet loss channel, even if you select the option Send one single Ping when adding the sensor. The issue does not have functional impact as long as you do not set one of the erroneously created channels as primary channel. In this case, the sensor may switch to the unknown status. Please note that channels cannot be deleted anymore once they are created, so we recommend that you wait for the next PRTG version if you plan to add sensors of these types without optional channels. Status: resolved with PRTG 19.3.52.3502 |
Reports |
Big reports with thousands of sensors occasionally time out and are not successfully created. The message in this case is Error creating PDF report: [timestamp] navigate error: timed out waiting for response from chrome Status: resolved with PRTG 19.3.52.3502 |
Spike Filter |
In the current version, the spike filter only applies to graphs and tables for live data and 2 days (Graph 1 in graph settings). It is not possible with PRTG 19.3.51 to remove spikes from graphs and tables for 30 days (Graph 2), 365 days (Graph 3), and historic data reports. Please note that this is a display issue, monitoring data is not affected. As soon as you update to a fixed version, all historic data will be correctly displayed again, respecting optionally set spike filters. Status: resolved with PRTG 19.3.52.3502 |
Summarized Notifications |
In the current version, PRTG does not send summarized notifications. You will receive the first down notification in any case but not the following summarization. We recommend that you choose the option Always notify ASAP, never summarize until we provide a fixed version if you strongly rely on potentially summarized notifications and do not want to miss any information. Status: resolved with PRTG 19.4.52.3515 |
Note
PRTG 19.3.51.2725
PRTG 19.3.51.2725 |
Please note that we took PRTG version 19.3.51.2725 (released on July 31) offline on August 5 as a precaution because some customers reported serious issues after the update to this version.
Affected customers reported 100% CPU load and many sensors in gray Unknown status due to a full graph cache recalculation that PRTG must do from time to time. We found the reason for the misbehavior and were able to resolve the issue. PRTG 19.3.51.2830 includes a fix for this, as well as three other fixes compared to 19.3.51.2725. If you are running the withdrawn version 19.3.51.2725, please update as soon as possible. |
Active Directory Replication Errors Sensor |
The Active Directory Replication Errors sensor now uses the naming context Configuration as default. This is also the naming context that the sensor used in previous version. With the support of different naming contexts introduced in PRTG 19.3.51.2725, the default was Domain, which, in certain cases, resulted in sensors of this type that did not find the replication neighbor anymore after the update. |
Auto-Discovery Groups |
Adding an auto-discovery group or editing the settings works properly again. In PRTG 19.3.51.2725, several IP selection methods caused an access violation when saving the settings. |
Updating |
We fixed an issue where, in rare cases, updating from older PRTG versions like, for example, 17.3.33, failed because of the tree version update in combination with certain history entries in the PRTG configuration file. |
May 15th 2019 – Version 19.2.50.2842
Blog article
 By Sascha Neumeier • May 28, 2019
PRTG Release 19.2.50: Measure MQTT Roundtrips with PRTG and Other News about the Release
The PRTG release version 19.2.50 has been available for installation in the stable channel for several days now. Maybe you already have the version in use, or you are planning the update. As...
Read the complete blog post here
Read the complete blog post here
New
Sensors
MQTT Round Trip |
This PRTG version comes with the new MQTT Round Trip sensor! You can now monitor the availability of an MQTT broker to ensure your IoT devices can deliver their data at all times. Use the MQTT Round Trip sensor to check if a connection to the broker can be established, if the broker accepts messages via publish, if the broker forwards a message to a matching subscriber, and measure either the connection times or the round trip time from publishing a message until receiving it back on a subscribed topic. The sensor shows the message round trip time, the round trip status, the publisher connection time, and the subscriber connection time in different sensor channels. Keep a close eye on your IoT infrastructure - with PRTG and the new MQTT Round Trip sensor! |
Improved
Sensors
DHCP |
You can now monitor multiple DHCP servers in different networks. The DHCP sensor will send the data packets only via the selected NIC to monitor the DHCP server. If there is no DHCP server available in the specified network, for example, if the NIC has a link-local address, the sensor will time out as expected. |
FTP Server File Count |
The FTP Server File Count sensor now supports TLS 1.2 connections. |
Oracle SQL |
We updated the Oracle library that Oracle SQL v2 and Oracle Tablespace sensors use to monitor your Oracle databases. We have seen that both sensor types cause less CPU load on the PRTG probe system compared to previous versions when using the updated library. |
VMware Host Hardware Status (SOAP) |
You can now define Known Warnings and Known Errors in the settings of the VMware Host Hardware Status (SOAP) sensor that include angle brackets (<>) to ignore messages that include such characters. |
VMware Host Performance and VMware Virtual Machine (SOAP) |
The sensor types VMware Host Performance (SOAP) and VMware Virtual Machine (SOAP) can now inherit the Channel Unit Configuration settings from the parent device. Please note that this still is not possible for certain units like bandwidth, for example. |
Windows IIS Application |
We added two new channels to the Windows IIS Application sensor. The channels show status and system uptime of a monitored web service. If the web service is not available, the sensor will show a down status. |
Improved
Notifications
Amazon SNS Notifications |
The Location setting of the notification method Send Amazon Simple Notification Service Message now shows all available SNS locations in a dropdown list instead of a bullet list for a better usage of the available space. |
Execute Program |
Notifications that execute programs now show a meaningful message in notification related logs instead of an access violation if the defined credentials are incorrect. |
Notification Templates |
On the Notification Templates tab in your account settings, you can now directly test an existing template, pause or resume it, and open a list of objects that use the template. The functionalities are accessible in the notification templates table without the need of using the multi-edit menu. |
Notification Triggers |
Notification templates that you select for a notification trigger now show the actions they perform with an according icon in the dropdown before the template name. |
SMS Notifications |
|
Improved
WebGUI
Multi-Edit |
|
Reports |
We changed the rendering engine for PDF reports. PRTG now uses Chromium instead of the deprecated PhantomJS to be able to generate PDF reports in a more reliable way. Screenshots that you generate for the support bundle also use Chromium now. Known issue: Please ensure port 9222 is not blocked on the PRTG core server system to generate PDF reports and screenshots. This only affects PRTG version 19.2.50. |
Tags |
Clicking a tag in the settings of a Notification Template or Map now opens a list with all accordingly tagged objects. |
Improved
Server
Cluster |
We slightly improved the cluster performance. |
Probe Connections |
We slightly improved the performance of probe connections by introducing a threadpool instead of using two dedicated threads for each probe. You will especially notice the improvement if you have many remote probes connected. |
Changed
Sensors
Packet Sniffer |
Packet Sniffer and Packet Sniffer (Custom) sensors now use the Npcap library instead of the deprecated WinPcap to monitor your traffic. Note: If you need to downgrade from PRTG 19.2.50 or later to a PRTG version 19.2.49 or previous for some reason, please first stop the PRTG services and manually uninstall Npcap before you install an older PRTG version. |
Loopback Adapter |
PRTG now installs a loopback adapter as part of the Npcap library for Packet Sniffer sensors.
Note: If your remote probe runs additional services, for example a DHCP server, this adapter might have an effect on these services. If you experience issues, we recommend that you disable the adapter. This will not affect PRTG. |
Changed
WebGUI
Device Icons |
We replaced the previous SVG device icons with new TinySVG 1.2 compliant icons. |
Fixed
Sensors
Cisco IP SLA |
PRTG will not create an instance of the Cisco IP SLA sensor for an OID anymore if the target device does not return values for this OID. In such cases, the Cisco IP SLA sensor immediately showed a down status with the message No such object (SNMP error # 222) after sensor creation in previous versions. |
HTTP |
The auto-discovery creates working HTTP sensors again even if the target device only runs on HTTP (ports 80, 8080). In previous versions (since PRTG 18.3.42), the auto-discovery only created properly working HTTP sensors for HTTPS devices (port 443). |
HTTP Advanced |
The HTTP Advanced sensor can monitor a website over a proxy server with basic access authentication (HTTP) now. In previous versions, it returned an error with the message Unauthorized (HTTP error # 401) when using a proxy. |
IMAP |
We improved the message filtering of the IMAP sensor. In previous versions, the IMAP sensor only recognized the content types text/html and text/plain if the attributes were written in lowercase. Depending on the configuration of your email server, they can be written in different casing, so that the sensor could not find matching messages. This will now work. |
NetApp NIC |
NetApp NIC BETA sensors that you add to a NetApp cDOT or ONTAP with a version earlier than 9.2 will not create the Healthy channel anymore. NetApp versions previous to 9.2 do not return according data so the Healthy channel just remained empty after sensor creation. |
Sensor Factory |
We fixed several issues with the Sensor Factory sensor. Reports and graphs now include all data without gaps that occurred in certain cases, and the error handling as well as the no data behavior realize your defined options more reliably. |
SNMP Cisco System Health |
PRTG again only creates one instance of an SNMP Cisco System Health sensor per selected item in the Add Sensor dialog. In browsers other than Chrome (for example, Firefox and Internet Explorer 11), each selected measurement of the SNMP System Health sensor was added twice in previous versions. |
SNMP Custom Table |
The column headers in the Table Specific settings in the Add Sensor dialog of the SNMP Custom Table sensor are now always aligned with their columns so you can easier identify which data belongs to which column. In previous versions, the column headers did not scroll sideways with the table content. |
SNMP Windows Service |
The table of Windows services in the Add Sensors dialog of the SNMP Windows Service sensor has now paging so you do not have to scroll down through all the services anymore. |
WMI Microsoft SQL Server |
We removed the obsolete setting SQL Server Version from the sensor types WMI Microsoft SQL Server 2017, WMI Microsoft SQL Server 2016, WMI Microsoft SQL Server 2014, WMI Microsoft SQL Server 2012, WMI Microsoft SQL Server 2008, WMI Microsoft SQL Server 2005. |
Fixed
Server
Images |
We fixed an issue with images in PRTG that were not correctly loaded (for example, graphs in reports) when the port to publish PRTG via NAT or on a load balancer did not match the port of the web server. |
Search |
We fixed an access violation that appeared in certain cases on the PRTG core server and resulted in a malfunctioning PRTG search, not returning any search results. |
Fixed
WebGUI
Dark Theme |
|
Dropdown Menus |
Entries in dropdown menus are better readable again. In previous versions, some dropdown menus like, for example, the report templates list appeared with blurred section headings in Google Chrome. |
Graphs |
Zoomed graphs automatically refresh their data again, as well as the according page footer shows up again. You can open a zoomed graph via the button Zoom graph in new window on several pages in the PRTG web interface. |
Maintenance Window |
If a sensor, device, group, or probe has the inheritance of the Schedules, Dependencies, and Maintenance Window setting enabled, PRTG will not validate the values (for example, start and end time of the maintenance window) anymore when you click Save. In case of enabled inheritance, the settings on this device tree level are inactive anyway. The previous behavior resulted in unnecessary error messages in certain cases. |
Mobile Android Probe |
We removed the last remaining links from the PRTG web interface that lead to the download page of PRTG Mobile Probe for Android. The app is not official supported and was removed from the Google Play Store some months ago. |
Multi-Edit |
The multi-edit menu is always available now if you have selected at least one item in a list (for example, a list of devices, sensors, reports, maps, libraries). In previous versions, the menu disappeared after cancelling the delete dialog while one or more items were still selected. |
Page Refresh |
The pause and resume buttons for the automatic page refresh in the page footer now always show the correct status, indicating if a click will pause or resume the refresh countdown. |
Quick Ranges |
We improved the filtering with quick range buttons, for example, for logs. The filters now better correspond to what the buttons say. |
Reports |
Data table entries in reports with a downtime greater than 0% are highlighted in red color again. We also improved the layout of reports with very long names and report related pages. |
Search |
The item count selector on the detailed search page now shows the current number of shown results per page without hovering over the selector. |
Smart Setup |
If you skip single steps or the the whole introduction, the setup assistant on a new PRTG installation will keep your decision and does not show up unwanted anymore. |
User Rights |
Only PRTG user accounts with administrative rights can download remote probes now. Read/write users and read-only users do not have the option anymore to open the Remote Probe Installer tab under Setup | Downloads and Tools, nor have the permission to do so on other places in the PRTG web interface. Read-only rights for remote probe downloads also apply to failover nodes in a PRTG cluster. |
Fixed
Various
All Parts of PRTG |
Various other fixes and improvements to all parts of PRTG, updated user manual |
Note
Known Issue: Reports
Report Period in Chrome |
In the current version, manually defining a date range (Period) with Start Date and End Date is not possible if you access the Report page with Google Chrome and your currently logged in PRTG user account uses the date format DD.MM.YYYY (24h or AM/PM). The date validation fails in this case. Workaround: Because the issue only exists in Chrome, you can use another browser like Firefox, Internet Explorer 11, or Edge to manually define a report period. Another option is to temporarily change the Date Format of your PRTG user account to MM/DD/YYYY or YYYY-MM-DD (24h or AM/PM). You can do so under Setup | Account Settings | My Account, section Web Interface. |
April 16th 2019 – Version 19.2.49.2018
Fixed
Server
Dependencies |
Dependencies work as expected again. In previous PRTG 19.1.49/19.2.49 versions, an issue with dependencies resulted in unwanted down notifications that were not expected due to dependencies defined over different groups and subgroups. |
April 9th 2019 – Version 19.2.49.2004
Fixed
Various
Manual |
We fixed an issue with the PRTG manual where in some cases it was not properly displayed. |
April 8th 2019 – Version 19.2.49.2001
Fixed
Server
PRTG Core Server |
We fixed an issue with the PRTG core server where in certain cases access violations (for example, schedule thread exceptions) lead to read and write locks. The issue could result in unexpected server restarts. |
Server Startup |
In rare cases, the PRTG server did not automatically start after a fresh installation. We fixed this behavior. |
March 4th 2019 – Version 19.1.48.2929
Blog article
By Sascha Neumeier • Mar 8, 2019
Don’t Miss News About PRTG Release 19.1.48
Welcome to the first PRTG Release News on the blog in 2019. I hope you had a fantastic start to the new year and have bravely stuck to your good intentions so far. Our developers are already...
Read the complete blog post here
Read the complete blog post here
Fixed
Server
Cluster and Reports |
Reports contain data from failover nodes again if defined in the report settings. |
Cluster and Sensors |
It is possible to add meta-scan sensors to devices on the cluster probe again. In previous 19.1.48 versions, the meta-scan did not work and never finished on the cluster probe so that you could not add any meta-scan sensors. |
Dependencies |
Dependencies work as expected again when a master object returns from a down status, so that all dependent sensors will automatically resume monitoring as soon as the master object comes back. In previous 19.1.48 versions, dependent sensors did not resume in some cases but showed a paused by dependency status even if the target device was reachable again. |
Fixed
Probe and Sensors
Probe and Sensors |
We fixed a potential memory leak that occurred when using many SNMP sensors with multi get as request method. |
.NET Tickets |
We reduced the amount of created PRTG ToDo tickets that inform about the required update to .NET 4.7.2 on a probe system. PRTG will now only create a new ticket when there is not an open ticket about .NET 4.7.2 on the probe yet. |
Note
Known Issue: Down (Acknowledged)
Acknowledged by |
In current versions, PRTG does not show the user account who acknowledged the down status of a sensor. The user name is missing in the sensor message and in the log of a sensor in Down (Acknowledged) status. Status: resolved with PRTG 19.1.49.1966 |
March 28th 2019 – Version 19.1.49.1966
Blog article
By Sascha Neumeier • Apr 23, 2019
PRTG Release 19.2.49 News Roundup – PRTG Desktop, .NET 4.7.2 and More…

For a few days now, the PRTG release 19.2.49 has been available for download on the stable release channel. The current release contains a lot of improvements, including improved performance of...
Read the complete blog post here
Read the complete blog post here
New
Apps
PRTG Desktop |
The PRTG Desktop client is now fully integrated in PRTG! You can directly open the download page from the PRTG web interface under Setup | Downloads and Tools | Desktop Client Apps or via the automatically created shortcut Get PRTG Desktop on the system you run your PRTG server and install the app on your desired system. PRTG Desktop is a new native PRTG application that runs on supported Windows and macOS systems. Use PRTG Desktop to completely control one or more PRTG installations with one app and show data of all your independent PRTG core servers including PRTG hosted by Paessler. The integrated tray tool will notify you whenever PRTG discovers issues in your network. You can also import server connections from the Enterprise Console. For more information and a direct download link, see the PRTG Desktop app webpage. |
Changed
Sensors
EXE-Based Sensors |
PRTG now requires .NET version 4.7.2 installed on all computers running a probe for all sensor types that require the .NET framework. You will receive a ToDo ticket in PRTG for each affected probe if .NET 4.7.2 is missing. You will not be able to add .NET sensors anymore in this case and running .NET sensors will show a down status with error code PE104 after you have installed the PRTG update. For more details, please see this Knowledge Base article. |
SNMP HP and SNMP HPE Sensors |
We updated the names of several sensor types to reflect differences between devices from Hewlett Packard Inc. and Hewlett Packard Enterprise. Except for the SNMP HP LaserJet Hardware sensor, all former SNMP HP sensors have now a leading SNMP HPE in the sensor name. Please note that we already updated the device icons in PRTG version 18.2.41. There are no functional changes. |
Changed
API
JSON |
JSON output from the PRTG API now returns all fields as string values as long as the textraw format is not used for the field, even if a field was returned as integer until now. For example, priority in table.json is now returned as string instead of integer. |
Improved
Server
Active Directory |
We improved the performance of Active Directory group synchronization when PRTG Active Directory accounts are members of two or more PRTG Active Directory user groups. You will especially perceive the improvement if you use PRTG apps to access PRTG. |
Tags |
We improved the way PRTG handles tags in the background, providing more consistency, stability, and a slightly improved performance for tag usage. |
PRTG Core Server |
Several other minor performance improvements |
Improved
Sensors
SNMP Synology Logical Disk |
We added 9 new states to the standard lookup file of the SNMP Synology Logical Disk sensor, so your are now able to monitor all possible states of your Synology RAID. |
Windows Process |
The Windows Process sensor now supports 64-bit processes and accurately monitors processes that use more than 4 GB RAM (private bytes). |
Fixed
Security
API |
We fixed a potential DoS vector in the PRTG API. |
Sensors |
We improved the input validation of port fields in sensors settings. The fix closes a potential attack vector for malicious activities like Remote Code Execution (RCE). The issue was reported by Anton Vaychikauskas and Dmitry Galecha from Positive Technologies, thank you! (CVE-2018-19204) |
WebGUI |
We fixed some potential XSS vulnerabilities in the PRTG web interface. Thanks to the usd Bug Bounty Team (CVE-2018-14683), as well as Anton Vaychikauskas and Dmitry Galecha from Positive Technologies for reporting the issues! |
Fixed
Sensors
Cloud HTTP and Cloud Ping |
It is not possible to add Cloud HTTP or Cloud Ping sensors to IPv6 devices anymore because they do not support IPv6 and just showed an error message in this case. |
Sensor Factory |
Gauges of Sensor Factory sensors are now properly shown even if you use certain special characters in the channel definition. |
Fixed
Server
Auto-Discovery |
The PRTG auto-discovery adds found devices exactly written as they are named in the DNS, considering upper and lower case. In previous versions, PRTG erroneously added devices only in lower case. |
Cluster |
The Master Heartbeat now also works on failover nodes that become the current master. The file you choose via the PRTG Administration Tool on the failover server will be executed every 5 minutes as expected. |
Dependencies |
We fixed another issue with dependencies where pausing by dependency did not work as expected in certain cases. If a sensor is set as master dependency, the sensor shows a down status in case of an error again instead of a paused status as it sometimes happened in PRTG 19.1.48. |
Device Tree |
The group in the device tree that is automatically created when adding a new PRTG user group now always has the same name as the user group with an attached home (for example, New User Group home), even if the user group was created while adding a new user account. The group part of the name was missing in the device tree group in such cases. |
Down (Acknowledged) |
PRTG shows the user account who acknowledged the down status of a sensor again. As usual, the name will appear in the message as well as in the log of a sensor in status Down (Acknowledged). In PRTG version 19.1.48, the name of the acknowledging user account was missing. |
Logging |
The logging level in configuration files is now case insensitive for easier usage. |
Maps |
The History tab of maps now always contains an entry with the date the map was created. In previous versions, the entry disappeared as soon as 100 history entries were reached. |
Probes |
Your Python processes on PRTG probe systems will now continue running when you update your probes. In previous versions, updating probes resulted in terminating all Python processes on the machine because the updater did not check which process runs python.exe. |
Server Startup |
We fixed an issue with custom toplist fields where the check for the status of the target data structure was missing when PRTG upgrades the field declaration due to a change in PRTG version 18.4.47. Depending on when the custom field was created, the start of the PRTG core server could have been blocked by the issue. The error message that appeared in the PRTG core server log or when trying to start the server via the PRTG Administration Tool was TPaeInternalList.SetData: Col index out of bounds: 3(2) |
Unknown Status |
We fixed an issue where the system time of PRTG probe and server ran out of synchronization, which could result in grey sensors (for example, Ping sensors) in PRTG 19.1.48. You also might have noticed the issue if you use the WMI UTC Time sensor that showed a steadily increasing value in the Difference channel (time difference between PRTG system time and monitored device), which is also fixed with this new PRTG version. |
Fixed
WebGUI
Cluster |
|
Dark Theme |
We improved the readability of notification template names when editing notification triggers in the dark theme. |
Dependencies Graph |
The dependencies graph now properly displays select dependencies that were not shown in certain cases. |
Device Tree |
|
HTML Email Notifications |
We improved the readability of HTML email notifications that contain SNMP Trap or Syslog messages resolved from the placeholders %traperrors, %trapmessages, %trapwarnings, %syslogerrors, %syslogmessages, %syslogwarnings |
Maintenance Window |
Minor usability improvements for the maintenance window setting in the PRTG device tree |
Management Tab |
We fixed a layout issue on the Management tab where the device tree showed too much whitespace between devices in browsers other than Chrome. |
Reports |
Reports now show an according message when there are no sensors included in the report instead of showing just an empty page. |
System Information |
|
Toplists |
Layout improvements for the time-range selector on toplist pages |
Welcome Page |
Read/write users and read-only users can now stay on the PRTG welcome page without receiving the message Error (Bad Request). Sorry, your user account is not allowed to access this information. because of erroneously trying to retrieve license information. |
Fixed
Various
Languages Files |
Major update of the Dutch language file, especially more consistency in terminology, and updated German language file |
All Parts of PRTG |
Various other fixes and improvements to all parts of PRTG, updated user manual |
Note
PRTG 19.1.49.1916
Memory Leak |
Please note that we took PRTG version 19.1.49.1916 (released on March 19) offline on March 21. The PRTG core server included a memory leak in version 19.1.49.1916. Depending on your monitoring scenario, this could lead to critical memory consumption on your PRTG server. The new PRTG version 19.1.49.1966 includes a fix for the memory leak. If you are running the withdrawn version 19.1.49.1916, please update as soon as possible. |
February 19th 2019 – Version 19.1.48.2891
Fixed
Sensors
SNMP Dell PowerEdge Physical Disk |
The SNMP Dell PowerEdge Physical Disk sensor lists all available disks again when you add a new sensor of this type. In the previous 19.1.48 versions, it only showed one disk after the meta-scan in the Add Sensor dialog. |
SNMP HP BladeSystem Enclosure System Health |
The SNMP HP BladeSystem Enclosure System Health sensor works again. In the previous 19.1.48 versions, sensors of this type always failed with the error message Duplicates not allowed. |
Fixed
Server
Dependencies |
Master dependencies work again when they were taken over by cloning a device, so that all dependent sensors will automatically pause by dependency as soon as the master object fails. In the previous 19.1.48 versions, dependent sensors on cloned devices did not pause by dependency but showed a down status if the target device was not reachable, which could result in receiving many unnecessary notifications, for example. |
February 14th 2019 – Version 19.1.48.2876
Fixed
Server
Sensor Graphs |
We fixed an issue with the PRTG graph data cache recalculation. After updating to PRTG version 19.1.48.2868, historic data graphs did not show data in certain cases because of the issue. If you were affected by the issue, please don't panic, your data is not lost. Your data will be shown again after installing the new PRTG version 19.1.48.2876. |
Fixed
Sensors
SNMP Linux Disk Free |
The SNMP Linux Disk Free sensor works as expected again. In the previous PRTG version 19.1.48.2868 it failed when monitoring certain Linux distributions like, for example, Debian 6, Debian 7, and CentOS 6. Affected sensors showed an error with the message List index out of bounds (0). |
February 11th 2019 – Version 19.1.48.2868
Important
Known Issues
SNMP HP BladeSystem Enclosure System Health |
SNMP HP BladeSystem Enclosure System Health sensors will show an error with the message Duplicates not allowed after the update to PRTG version 19.1.48.2868 in certain cases. We recommend that you wait with the update of your PRTG installation until we publish a fix for the issue if you are using SNMP HP BladeSystem Enclosure System Health sensors. Status: resolved with PRTG 19.1.48.2891 |
Sensor Graphs |
After updating to PRTG version 19.1.48.2868, historic data graphs will not show data in a few cases. This happens due to an issue with the PRTG graph data cache recalculation. If you are affected, please don't panic, your data is not lost. We will provide a fix for the issue as soon as possible and your data will be shown again. Status: resolved with PRTG 19.1.48.2876 |
SNMP Linux Disk Free |
SNMP Linux Disk Free sensors will show an error with the message List index out of bounds (0) after the update to PRTG version 19.1.48.2868 when monitoring certain Linux distributions. Affected are, for example, Debian 6, Debian 7, CentOS 6, Mandriva Linux 7.2 Odyssey, Ubuntu 12.04. Please note that these are affected distributions from which we only know right now. We are currently working on a fix and recommend that you wait with the update of your PRTG installation until we publish it if you are using SNMP Linux Disk Free sensors. Status: resolved with PRTG 19.1.48.2876 |
Improved
Sensors
Lookups |
We added two new standard lookup files to PRTG that reflect the Boolean values 1 (true) and 0 (false). Use prtg.standardlookups.boolean.statetrueok as lookup if you want to have an up status for true (returned 1), use prtg.standardlookups.boolean.statefalseok if you want to have an up status for false (returned 0). |
SNMP HP ProLiant System Health |
We added the lookup status noPowerInput(17) to the standard lookup file prtg.standardlookups.hp.powersupplystatus of the SNMP HP ProLiant System Health sensor. The sensor will now show an according down status if your target device returns this value. |
SNMP Sensors |
We changed the method that SNMP sensors use on creation to search for available monitoring items on the target device ("meta-scan"). SNMP sensors will now use GETBULK requests during meta-scan instead of GETNEXT. With SNMP GETBULK, the sensors request 10 OIDs at a time by default, which leads to performance improvements in comparison to GETNEXT that requests only 1 OID at a time. The change also affects the System Information feature, so that the DDoS protection of QNAP devices should report alerts less often because of PRTG. Note: Only SNMP v2c and SNMP v3 support GETBULK, for SNMP v1 you still have to use GETNEXT. You can change the setting in the SNMP Compatibility Options of the target device in PRTG, section Walk Mode. |
Improved
Server
PRTG Core Server |
This version includes various minor and major performance improvements, especially for the handling of a lot of remote probes. We also improved the scalability of the server with CPU cores and memory, the server startup times, and the post-processing of configuration changes (special thanks to electromichi for pointing us to this issue!). |
Improved
WebGUI
Maps |
The Top 10 lists Longest System Uptime and Shortest System Uptime are now available as map objects. |
Notification Delivery |
You can now directly test your SMTP and SMS settings on the Notification Delivery tab to check immediately if your settings work without changing pages and losing your context. Just click the button Test SMTP Settings or Test SMS Settings and see if your delivery settings work. |
Object History |
The object history of a notification template now indicates if settings of this template have been changed, Also, resuming an object like a sensor or device from paused status appears in the object history as of this version. |
Fixed
Sensors
Business Process |
Saving the settings of a Business Process sensor is now also possible when you only remove an object from the channel definition because the Save button is now active after the change. Also, when deleting an object from the channel definition, all objects are still shown and not only the first 7 entries so that you can easier delete more than 1 object. |
File and Folder |
File sensors and Folder sensors now use a negative value to indicate when the timestamp of a modified file is in the future. This approach will prevent the sensors from showing false warnings in such scenarios. |
File Content |
You can now add File Content sensors with the auto-discovery using your own device template. In previous versions, PRTG erroneously added File Content sensors as File sensors to newly created device templates, so that an auto-discovery with this device template only added File sensors. |
IMAP |
You can now use the setting Check connectivity only, do not process emails without providing credentials for the monitored mailbox. Credentials are not required in this scenario but were requested when you have manually added the sensor in previous versions. |
Sensor Factory |
The Sensor Factory sensor handles angle brackets (<>) in the channel definition in a better way now. The sensor overview tab will not appear broken anymore if you use these characters, but please note that the sensor gauge still will not look perfect in such cases. |
SNMP Cisco System Health |
The SNMP Cisco System Health sensor now shows a down status with error code PE268 if the sensor runs against an invalid OID. The sensor will show a down status with error code PE269 if there are one or more channels for which the sensor cannot query data. In previous versions, the sensor status was not expressive enough in such cases because it only showed unknown (gray color) or up with empty channels. |
SNMP IBM System X System Health |
We fixed the appearance of the gauge for the Overall Status channel of the SNMP IBM System X System Health sensor. The gauge did not properly appear because the sensor used a unit type not supported by lookups. The sensor now also shows the return message if the target device returned an invalid value (sensor value -1). Important: To apply the fix, please add the sensor anew. |
SNMP Linux Disk Free |
The SNMP Linux Disk Free sensor now creates channels for all disks on the target device. In previous versions, the sensor stopped searching for available disks during sensor creation as soon as there was a missing OID in the index table and so did not create channels for each disk on the target system. |
SNMP Synology Logical Disk |
The SNMP Synology Logical Disk sensor is now able to recognize when the order or name of a volume changes. In previous versions, it was possible that the sensor monitored an incorrect volume in such cases, which resulted in wrong monitoring data. |
Windows Updates Status (PowerShell) |
We fixed an issue with the Time since last update channel of the Windows Updates Status (PowerShell) sensor that still showed incorrect values in certain use cases after the improvements in the previous PRTG version 18.4.47. |
Fixed
Security
Login |
|
Reports |
We removed PRTG credentials (login name and passhash) from the URL of HTML reports that appeared in certain cases. |
Fixed
Server
Auto-Discovery |
We fixed an issue with the custom meta-scan that you can use with the auto-discovery but did not work as expected in certain cases. Please note that this functionality is still not officially supported. |
Installer |
PRTG now correctly switches from the 32-bit version to 64-bit after a server restart when the machine on which PRTG runs upgraded from less to more than 6GB RAM. This did not work in previous versions when a server restart was pending (status "PendingReboot") because of some Windows update or similar. |
Logging |
Several fixes and improvements for the logging framework |
PRTG Administration Tool |
If you change the Local Storage of Data Files and Monitoring Database folder on the Core Server tab in the PRTG Administration Tool, PRTG will also restart the local PRTG probe service along with the PRTG core server service now to immediately apply the changes. This is necessary to write data into the correct folder. |
Server Startup |
We fixed an issue that occurred when adding or editing a Sensor Factory sensor using Internet Explorer 11 or Edge. In this case, some control characters were wrongly added to the PRTG configuration file, which resulted in a failing start of the PRTG server. The error message in this case was: Sorry, could not start PRTG Core Server (Web server) [...] Formula empty. |
Updating from Version 18.1.37 or Older |
Direct updates from PRTG version 18.1.37 and previous versions to the current PRTG version 19.1.48 do work. It was not possible to directly update from these older versions to the previous PRTG version 18.4.47 because the PRTG server was not able to start in this case. |
Fixed
Notifications
Slack and Teams |
Slack and Microsoft Teams notifications now recognize line breaks within placeholders and show the whole content in a received notification. |
Teams |
The message when pausing a monitoring object like a sensor for 60 minutes via a received notification in Microsoft Teams now correctly is Paused via Microsoft Teams. In previous versions, PRTG showed the wrong pause message Paused via Slack. |
Fixed
WebGUI
Dark Theme |
|
Graphs |
|
Maps |
|
Multi-Edit |
|
Sensor Gauges |
Sensor channels that show data as percentage now show gauges with minimum 0% and maximum 100% by default and appropriately display set limits. |
Tables |
Improved table layout and usage on various places, for example:
|
Tickets |
|
Top 10 Lists |
Top 10 lists of sensors will not show sensors without current last value anymore. |
Various |
This version includes dozens of other minor fixes and improvements for the PRTG web interface. This will remarkably improve your overall experience with PRTG! The fixes and improvements affect the following parts of the web interface, among others.
|
Fixed
Various
All Parts of PRTG |
Various other fixes and improvements to all parts of PRTG, updated user manual, updated language files |
Note
Probe and Sensors
EXE-based Sensors |
Future versions of PRTG will need .NET version 4.7.2 installed on all computers running a probe for all sensor types that require the .NET framework. You will receive a ToDo ticket in PRTG for each affected probe after each probe update if .NET 4.7.2 is missing. For more details, please see this Knowledge Base article. |
December 11th 2018 – Version 18.4.47.1962
Important
Known Issue: PRTG Update
Updating from version 18.1.37 or older |
Please note that direct updates from PRTG version 18.1.37 and previous versions to the current PRTG version 18.4.47 do not work. Please wait with an update of your PRTG instance if you are currently running 18.1.37 or an older version until we publish PRTG 19.1.48. This version will include a fix for the issue. If you update from PRTG 18.1.37 or previous, the PRTG server will not be able to start. It will show an access violation in this case. If you are affected by the issue, please contact our technical support team. Status: resolved with PRTG 19.1.48.2868 |
Improved
WebGUI
Notifications |
|
Maps |
We improved the readability of map objects with status-related background colors. |
Improved
Server
PRTG Core Server |
Several performance and stability improvements for the PRTG core server |
Graphs |
We updated the engine that PRTG uses to create data graphs. Thanks to the updated graphs engine, stacked graphs look better now! |
Logging |
This version includes some more improvements for the logging framework. |
Improved
Sensors
HTTP Push Data Advanced |
The HTTP Push Data Advanced now supports UTF-8 characters in the |
SNMP Trap Receiver |
The SNMP Trap Receiver sensor now supports several modes for bindings that you can use with the syntax bindings[oid,value,mode]. Mode can be:
|
Windows Updates Status (PowerShell) |
We changed the approach of the Windows Updates Status (PowerShell) sensor to avoid down states that are not meaningful enough. As of the current PRTG version, the sensor will always create the channel Time since last update. All other channels only show up if the sensor can retrieve according data. Furthermore, the channel value is more accurate now. |
Fixed
Server
PRTG Core Server |
We fixed an issue with the PRTG core server. In certain cases, the issue lead to access violations in the PRTG server system that could result in issues with sending notifications or unexpected server restarts with sensors in unknown status. |
PRTG GUI Starter |
We fixed several issues with the PRTG GUI Starter. It will work more reliable now. |
Security |
We fixed a possible XSS vulnerability. |
Server Startup |
We fixed an issue with the flowid field in toplists of NetFlow sensors that could result in an exception during the startup of the PRTG server. The PRTG server did not start in such cases. |
Fixed
Sensors
Channels |
|
Event Log (Windows API) |
The Exclude Filter of the Event Log (Windows API) sensor now correctly disregards all events that you have added to the filter, for example, event IDs. |
Flow Sensors |
Stability improvements for the sensor types IPFIX, NetFlow V5, NetFlow V9, and sFlow: The fields FlowID, InboundInterface, and OutboundInterface in custom toplists are now stored with their field ID. In previous versions, they were stored as index, which could lead to issues when the list of fields changed. |
Lookups |
Lists of lookup files are sorted alphabetically again when you select value lookups for a sensor channel. IDs of lookups are also loaded case insensitively again to prevent issues when you override default lookups with customs lookups. | Sensor Factory |
PRTG correctly calculates historic data of the Sensor Factory sensor again. In the last preview version, live data was used to calculate historic data instead of averages. This resulted in wrong values. |
SNMP Custom String Lookup |
We fixed an issue with device templates that include an SNMP Custom String Lookup BETA sensor. When running an auto-discovery with the template, PRTG created an unused channel that was not defined for the sensor. |
SNMP sensors |
SNMP sensors that support this functionality now only replace text within square brackets in the sensor name if the text is an OID or a defined variable. All other text will appear in the sensor name as it is. |
SNMP Trap Receiver |
The SNMP Trap Receiver sensor now properly handles quotation marks (") in the filter for bindings and can find strings that contain quotation marks. |
UPS Health (Generic) Template |
The device template UPS Health (Generic) now also supports Tripp Lite UPS, so running an auto-discovery with the template will create suitable sensors for your Tripp Lite UPS. |
WMI Sensors |
You can now add the sensor types Windows Physical Disk I/O, WMI Exchange Server, WMI Exchange Transport Queue, WMI Logical Disk I/O, and WMI Vital System Data (V2) using the auto-discovery. The auto-discovery could not successfully add these sensor types in previous versions. |
Fixed
Notifications
Amazon SNS |
We updated the signature version of Amazon SNS notifications to Signature Version 4, so it is now possible to send SNS notifications from AWS regions that only support this signature version like, for example, Canada (Central) (ca-central-1). |
SMS |
Using the placeholders %SMSNUMBER and %SMSTEXT in the path of custom URLs for SMS notifications works again. Due to an encoding issue, the placeholders only worked in the query string of a URL since PRTG version 18.3.43 and you received an unknown protocol error if your custom SMS provider requires number and text as part of the path. |
Fixed
WebGUI
Credentials |
We disabled the browser auto-complete of login and password fields in authentication sections of several sensor types (for example, HTTP Advanced and IMAP sensors). If you have saved your PRTG login credentials in your browser, your browser will not automatically fill in the credentials into PRTG settings sections anymore. |
Tables |
Paging on large tables and the selection of table items in the Add Sensor dialog works properly again. In previous versions, only sensors selected on the current table page were created. |
Various |
Several other minor fixes and improvements for the PRTG web interface |
Fixed
API
XML |
We fixed an issue with invalid XML returned by the PRTG API. For example, if a sensor included non-XML compliant characters in the sensor or log message and you requested the sensor via the PRTG API, this resulted in an error with the message cannot convert value. |
Fixed
Various
Language Files |
Major update for all language files! |
All Parts of PRTG |
Various other fixes and improvements to all parts of PRTG, updated user manual |
Note
Probe and Sensors
.NET Version |
Please note that we will upgrade our system requirements for the .NET framework in upcoming versions. Sensors that require the .NET framework will need at least .NET version 4.7.2 on all computers running a probe in the next PRTG version 19.1.48 that we plan to release in the first quarter of 2019. |
November 20th 2018 – Version 18.4.46.1754
Blog article
By Sascha Neumeier • Nov 30, 2018
All You Need to Know About PRTG Release 18.4.46
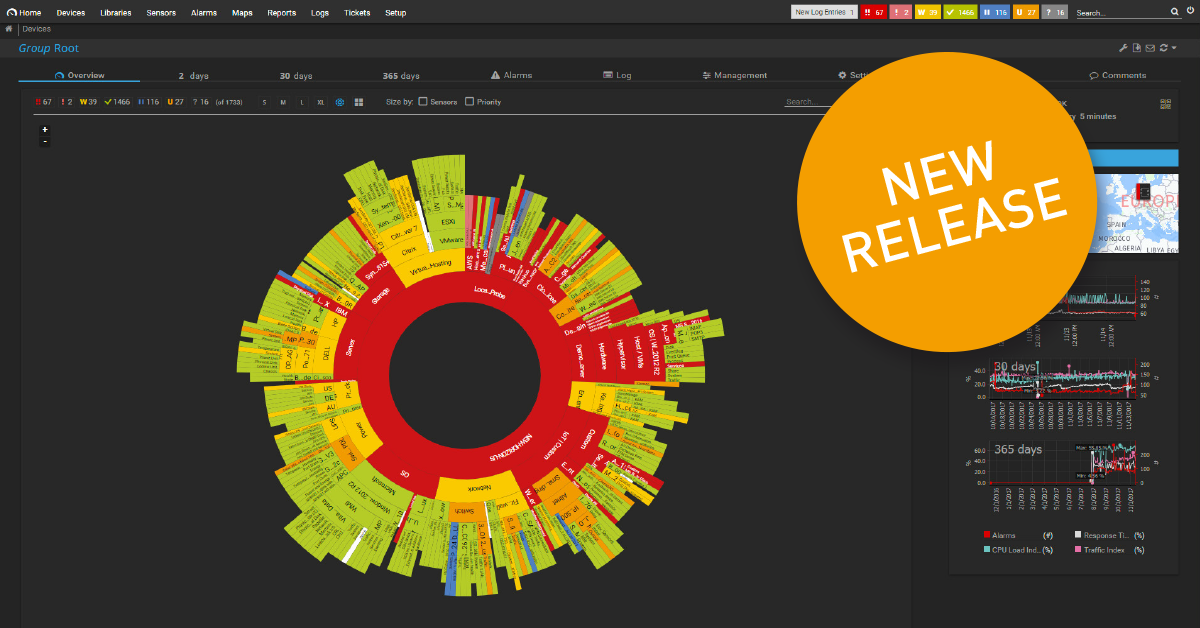
The closer we get to the end of the year, the faster time seems to fly. It feels like just the other day we were stumbling over pumpkins and being scared by our next-door children with "trick or...
Read the complete blog post here
Read the complete blog post here
Fixed
Sensors
SNMP Traffic |
We fixed an issue with the SNMP Traffic sensor that could lead to false spike values in certain cases. Please update your PRTG installation if you run one of the affected PRTG versions 18.4.46.1706 or 18.4.46.1736. |
November 14th 2018 – Version 18.4.46.1736
Fixed
Sensors
SNMP System Uptime |
The SNMP System Uptime sensor shows correct uptime values again. In the previous PRTG version 18.4.46.1706, uptime values were wrong by the factor of 10 in certain cases. |
November 7th 2018 – Version 18.4.46.1706
Improved
Server
PRTG Status |
You can now see the names of all PRTG user accounts that are currently logged in to your PRTG instance! Open the PRTG System Status page in the web interface via the main menu (Setup | PRTG Status) and look at section Software Version and Server Information. There is the new entry Active User Sessions that shows all currently logged in PRTG users. |
Remote Probes |
Remote probes now always keep their defined names. In certain cases, the name of a remote probe changed to the host name after manually updating the probe. |
PRTG Server |
This version includes several stability and performance improvements for the PRTG server. For example, we dramatically improved the startup time especially with bigger configuration files, we reduced the memory usage of the core server after startup and after the configuration was saved, and we improved the performance of the website response a little. |
Web Server Connections |
The PRTG web server will now keep the option that you defined as IP address for the web server even if no IPs were found on the stack after a PRTG core server restart. In certain cases, usually after Windows updates, this resulted in the error No IPs could be found on the stack - reverting web server to local host after the core server started and the web server connection setting permanently switched to localhost. |
Improved
Sensors
Amazon CloudWatch |
We added the new regions US East (Ohio), EU (Paris), and Asia Pacific (Osaka-Local) to all Amazon CloudWatch sensors. You can use the new regions with the sensor types Amazon CloudWatch Alarm, Amazon CloudWatch EBS, Amazon CloudWatch EC2, Amazon CloudWatch ElastiCache, Amazon CloudWatch ELB, Amazon CloudWatch RDS, Amazon CloudWatch SNS, Amazon CloudWatch SQS. |
SNMP System Uptime |
We improved the fallback mechanism of the SNMP System Uptime sensor. The sensor uses the hrSystemUptime OID to retrieve the uptime value and uses sysUpTimeInstance as fallback if hrSystemUptime is not available (see also this article). If both are not available, the sensor will show a down status until at least one uptime OID is available. If both are available again, the sensor will use the preferred hrSystemUptime. In previous versions, the sensor used the fallback sysUpTimeInstance in this case. |
Changed
API
JSON |
PRTG now returns strings from _raw columns surrounded by quotation marks ("") when you request JSON output, numbers still will be returned without quotation marks. In previous versions, quotation marks were missing for strings, which resulted in some issues because this was not common JSON. Please adapt your usage scenario of the PRTG API if necessary. Example: "uptimetime":"642 d","uptimetime_raw":55492731 |
XML |
The PRTG API now returns the correct response content-type header text/xml when you request XML output. In previous versions, the content-type was erroneously set to text/html. |
Fixed
Sensors
Amazon CloudWatch Alarm |
The Amazon CloudWatch Alarm BETA sensor now shows all configured alarms in the Add Sensor dialog. In previous version, some alarms were missing and could not be selected for monitoring. |
Debug Options |
We fixed an issue with the debug option Write sensor result to disk. In certain cases, some sensors continued writing the log files although the option was turned off again with "Discard sensor result". |
DHCP |
The DHCP sensor now correctly applies changes to settings. In previous versions, the check for server IP or client IP was still applied if you switched the option to Don't check but kept the entries in the include or must not include fields. |
DICOM Bandwidth |
The DICOM Bandwidth BETA sensor now shows the correct C-STORE size and correctly calculates the bandwidth usage of sent files. |
SNMP NetApp Network Interface |
The SNMP NetApp Network Interface sensor now applies the Unit for Bytes (Bandwidth) that you selected in the Channel Unit Configuration settings of the sensor's parent device. In previous versions, the sensor always showed traffic in MByte/s. |
SNMP Traffic |
We fixed an issue with SNMP Traffic sensors that were not addable to Cisco devices if selected additional channels were not available. PRTG showed the SNMP error #2003 in this case. |
SSH Script and SSH Script Advanced |
We fixed an issue with the search for scripts when adding an SSH Script or SSH Script Advanced sensor. The sensors were not able to find scripts and show them in the Add Sensor dialog when having certain localizations on target systems, for example, Italian. |
WMI HDD Health |
We fixed an issue with the WMI HDD Health sensor that occurred when parsing the instance name. The sensor returned an error message like "The query was not syntactically valid." if the WMI property InstanceName included certain characters. |
Fixed
WebGUI
IE11 and Edge |
Saving changes on setting pages when using Internet Explorer 11 or Edge is possible again. In the previous PRTG version 18.4.45, clicking save resulted in a saving window that did not disappear and the settings could not saved. |
Various |
Several minor fixes for the PRTG web interface |
Fixed
Various
Lookups |
We fixed an issue with the PRTG server where access violations regarding lookups resulted in missing channels of some sensors. This only happened under certain circumstances. |
All Parts of PRTG |
Various other fixes and improvements to all parts of PRTG, updated user manual (including API documentation for System Information), updated language files |
Note
Installer
Trial Installation |
If you download a PRTG trial version from paessler.com and run the installer on a fresh machine, you will not have to manually enter trial key and license name anymore. |
October 19th 2018 – Version 18.4.45.1898
Blog article
By Sascha Neumeier • Oct 31, 2018
PRTG Release 18.4.45 Offers More Tasteful Donuts, Various Improvements and No Halloween Surprise
We are posting this on the 31st of October, so one could generously call the PRTG release 18.4.45 a Halloween special. Of course, that's not quite right, because when we do a blog about a stable...
Read the complete blog post here
Read the complete blog post here
Fixed
Sensors
VMware Host Performance (SOAP) |
The VMware Host Performance (SOAP) sensor now works with VMware 6.7 Update 1. The VMware update included a change in the API version that VMware Host Performance (SOAP) sensors could not correctly process. Affected sensors showed a down status with the error message Input string not in a correct format. |