• Company
    • About Us
    • Case Studies
    • Press Center
    • Careers
    • Blog
    • Contact us
  • Contact us
  • Login
 
  • English
    • Deutsch
    • Español
    • Français
    • Italiano
    • Português
Paessler
                    - The Monitoring Experts
  • Products
    • Paessler PRTG
      Paessler PRTGMonitor your whole IT infrastructure
      • PRTG Network Monitor
      • PRTG Enterprise Monitor
      • PRTG Hosted Monitor
      • PRTG UVexplorer
      • PRTG extensionsExtensions for Paessler PRTGExtend your monitoring to a new level
    • Icon Features
      FeaturesExplore all monitoring features
      • Maps & dashboards
      • Alerts & notifications
      • Multiple user interfaces
      • Distributed monitoring
      • Customizable reporting
  • Solutions
    • By TeamFor your organization size
      • Small Business IT
      • Mid-Market IT
      • Enterprise IT
      • MSP Network Monitoring
    • Industries
      By IndustryFor your business sector
      • Industrial
      • Healthcare
      • Government
      • Education
      • Data Center
      • Finance
    • IT Topics
      By Use CaseFor every technical scenario
      • Network Monitoring
      • Server Monitoring
      • OT Monitoring
      • Distributed Monitoring
      • Network Topology Mapping
      • SNMP Monitoring
      • Bandwidth Monitoring
  • Pricing
  • Resources
    • Getting Started
      Getting StartedModules for self-paced learning
    • How-to Guides
      How-to GuidesGet the most out of PRTG
    • Videos & Webinars
      Videos & WebinarsLearn from Paessler experts
    • IT  Knowledge
      IT KnowledgeExpand your IT knowledge
    • PRTG Manual
      PRTG ManualFull documentation
    • Knowledge Base
      Knowledge BaseShare community knowledge
    • PRTG Sensor Hub
      PRTG Sensor HubGet sensors, scripts & templates
    • Trainings
      PRTG TrainingLearn how to work with PRTG
  • Partners
    • Icon Handshake
      Become a PartnerFor resellers and channel partners
    • Icon MSP
      Become an MSPDeliver monitoring as a managed service
    • icon partner
      Partner PortalLog in to your partner account
    • Deal Registration
      Deal RegistrationRegister your sales opportunities
    • icon search
      Find a PartnerFind partners selling Paessler products
    • icon technology
      Technology AlliancesSee Paessler technology partnerships
    • Partner HubTools for Your Success
  • Company
    • About Us
    • Case Studies
    • Press Center
    • Careers
    • Blog
    • Contact us
  • Contact us
  • Login
  • English
    • Deutsch
    • Español
    • Français
    • Italiano
    • Português
  • Get a quote
  • Free trial
  1. Home>
  2. Company>
  3. Case Studies>
  4. LUMC

1,000 Servers, One Platform: How Leiden University Medical Center Monitors Its Entire Hospital IT with PRTG

Challenge: Replacing a fragmented monitoring setup with a single flexible platform that clinical departments would actually adopt

download PDF
Logo Company LUMC

COMPANY
Leiden University Medical Center (LUMC)

INDUSTRY
Healthcare

COMPANY SIZE
Enterprise

COUNTRY
Netherlands

SCALE
Large installation, 1,000+ servers, 20 PRTG instances across departments

Icon Server

1,000+ servers monitored across the hospital in a single PRTG environment 

Icon Module

20 departmental PRTG instances, each configured independently 

Icon Clock Check

HiX patient data platform monitored 24/7 

Icon Infinity

Dual PRTG setup ensures the monitoring system itself is always available 

The problem

At a university medical center, IT is not one team’s responsibility. It is everyone’s. Leiden University Medical Center (LUMC) has a central IT team, but each clinical department also runs its own IT operations. Monitoring was fragmented. The network was watched around the clock, but the tools in use were slow, siloed, and hard to extend. 

LUMC needed a single environment where different elements could be monitored together: network health, servers, medical equipment, and department-specific applications. The system also had to be flexible enough for departments to configure their own monitoring without central IT managing every single detail. 

What changed with PRTG

LUMC selected PRTG for its flexibility, its large user base, and its ability to monitor medical equipment alongside standard IT infrastructure. Implementation was fast. The Knowledge Base covered most questions. The initial license quickly proved too small as adoption spread across departments. 

Today, around 20 servers within LUMC run PRTG, with more than 1,000 servers monitored inside the platform. LUMC upgraded to PRTG Enterprise Monitor to match the scale. A second, physical PRTG environment monitors the primary virtual instance, so the monitoring system itself is always watched. 

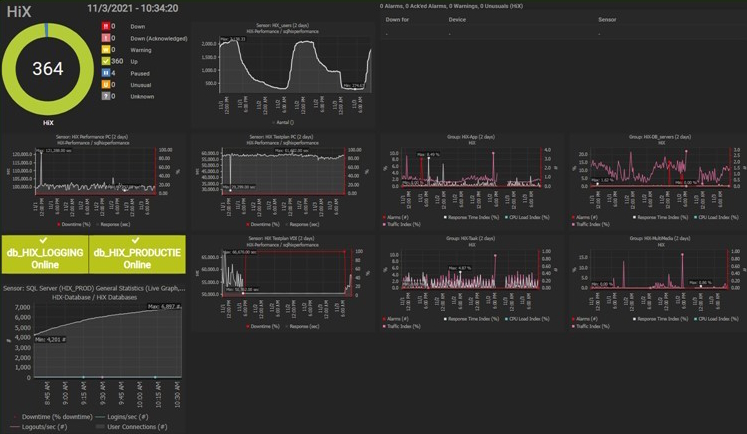
Each department configures its own environment. The Radiotherapy department built out an extensive setup independently. The NICU outsourced its monitoring to a third party, and the central IT team monitors that third-party monitoring through PRTG. The HiX patient data platform is monitored 24/7 with multiple sensors. Dashboards run on large screens throughout the hospital, so all staff see the same live status at a glance. 

In 2019, we decided to switch to a new network monitoring system. The requirement at the time was to work with a system where various elements could be monitored from within a single environment. This means monitoring the health of the network 24 hours a day and also, by extension, the health of the patients.


Willem Bouwman, Technical Applications Manager
Leiden University Medical Center
PRTG Logo

PRTG monitors hospital networks, servers, medical systems, and departmental IT from one platform.

CONTACT SALES
LUMC entrance
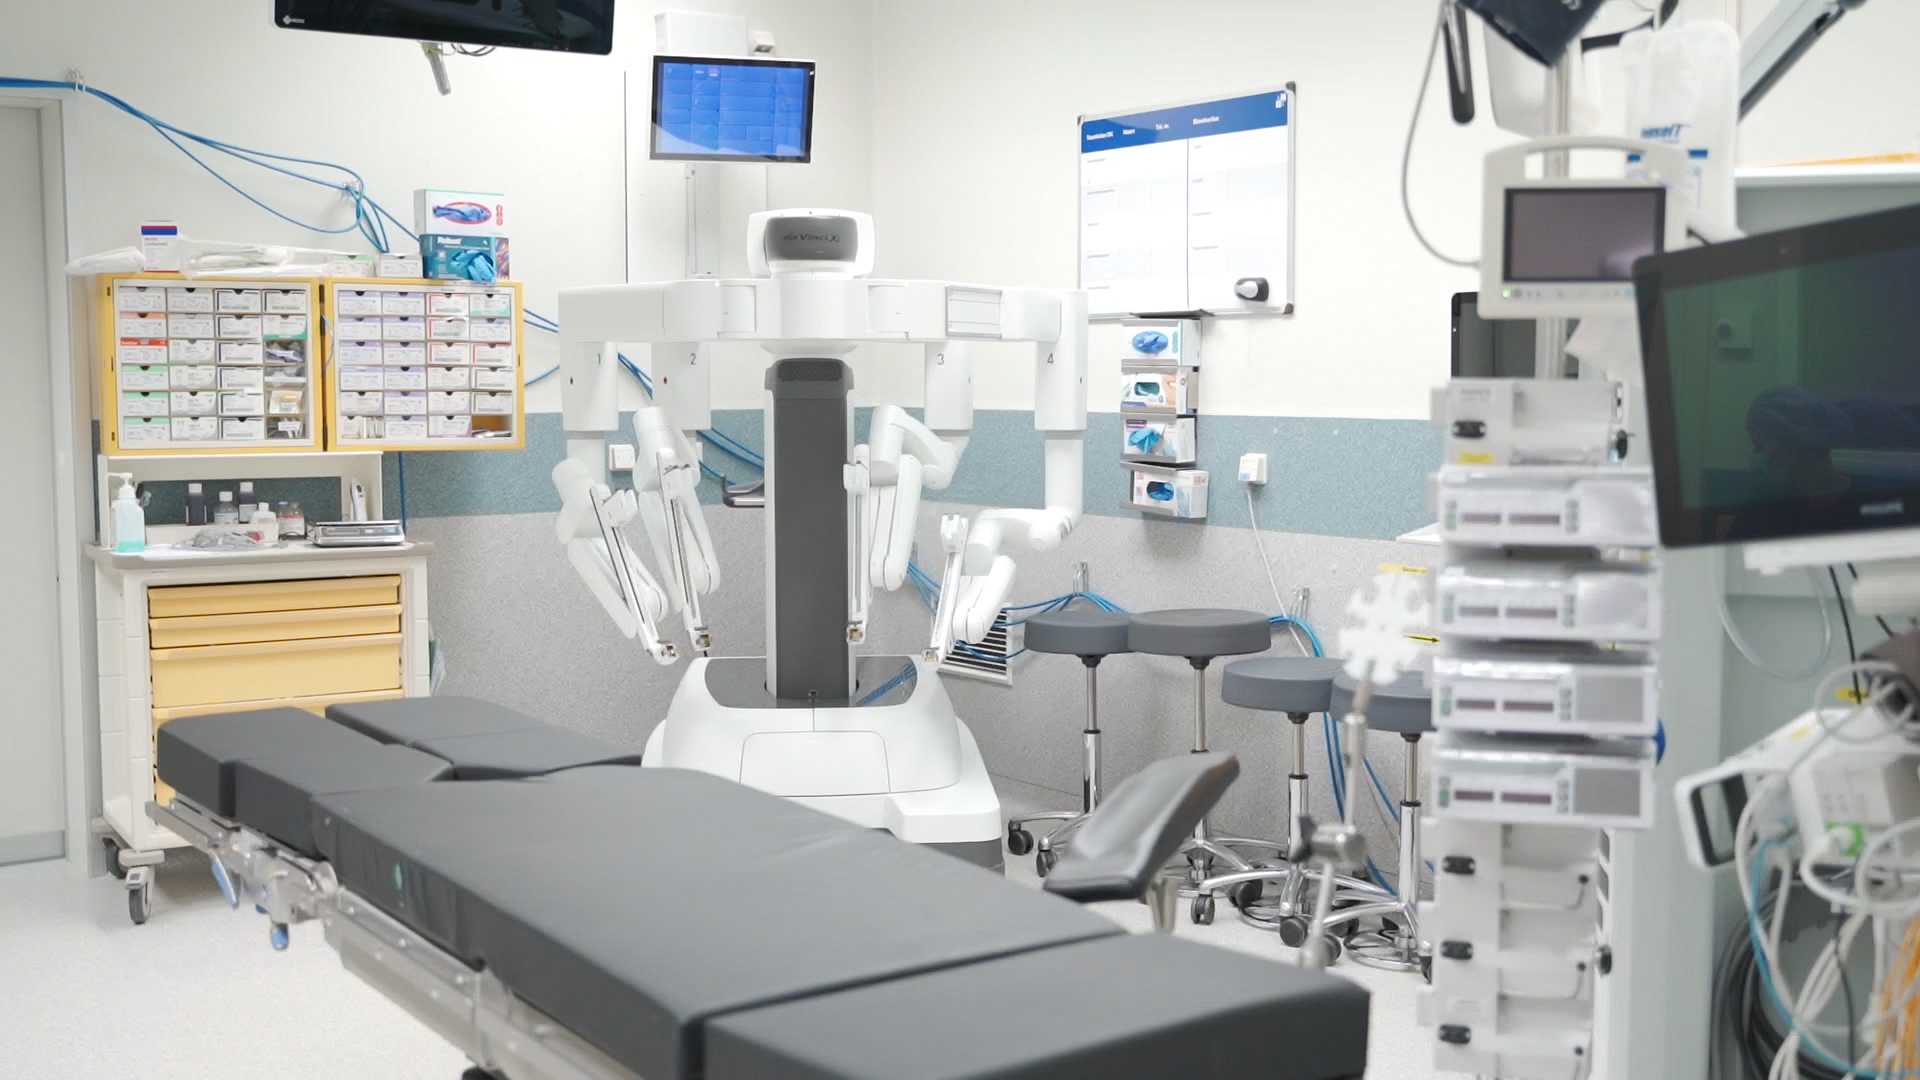
LUMC OR
LUMC Entree
Map Hix monitoring

Discover more monitoring insights and stories

Solution illustration

Solutions for all your monitoring needs

  • Healthcare IT Monitoring
  • SNMP Monitoring
  • NetFlow Monitoring
Content illustration

Powerful stories from the monitoring world

  • Customer success stories - Paessler
  • How LUMC monitors all its IT systems with Paessler PRTG ...
  • Video: PRTG Network Monitor – Smart Setup
Support illustration

Resources to master your monitoring challenges

  • How can I propose new features or sensors for PRTG?
  • Quick Start Guide
  • How can I speed up PRTG—especially for large installations?
Explore All Case Studies

Products

  • Paessler PRTG
    Paessler PRTGMonitor your whole IT infrastructure
    • PRTG Network Monitor
    • PRTG Enterprise Monitor
    • PRTG Hosted Monitor
    • PRTG UVexplorer
    • PRTG extensions
      Extensions for Paessler PRTGExtend your monitoring to a new level
  • Icon Features
    FeaturesExplore all monitoring features

Monitoring with PRTG

  • Network monitoring
  • Bandwidth monitoring
  • SNMP monitoring
  • Network mapping
  • Wi-Fi monitoring
  • Server monitoring
  • Network traffic analyzer
  • NetFlow monitoring
  • Syslog server

Useful Links

  • PRTG Manual
  • Knowledge Base
  • Customer Success Stories
  • About Paessler
  • Subscribe to newsletter
  • PRTG Support
  • PRTG Consulting
  • PRTG Feedback & Roadmap

Contact

Paessler GmbH
Thurn-und-Taxis-Str. 14, 
90411 Nuremberg 
Germany

[email protected]

+49 911 93775-0

  • Contact us
©2026 Paessler GmbHTerms & ConditionsPrivacy PolicyImprintReport VulnerabilityDownload & InstallSitemap
Privacy Policy Privacy Policy Privacy Policy