• Company
    • About Us
    • Case Studies
    • Press Center
    • Careers
    • Blog
    • Contact us
  • Contact us
  • Login
 
  • English
    • Deutsch
    • Español
    • Français
    • Italiano
    • Português
Paessler
                    - The Monitoring Experts
  • Products
    • Paessler PRTG
      Paessler PRTGMonitor your whole IT infrastructure
      • PRTG Network Monitor
      • PRTG Enterprise Monitor
      • PRTG Hosted Monitor
      • PRTG UVexplorer
      • PRTG extensionsExtensions for Paessler PRTGExtend your monitoring to a new level
    • Icon Features
      FeaturesExplore all monitoring features
      • Maps & dashboards
      • Alerts & notifications
      • Multiple user interfaces
      • Distributed monitoring
      • Customizable reporting
  • Solutions
    • By TeamFor your organization size
      • Small Business IT
      • Mid-Market IT
      • Enterprise IT
      • MSP Network Monitoring
    • Industries
      By IndustryFor your business sector
      • Industrial
      • Healthcare
      • Government
      • Education
      • Data Center
      • Finance
    • IT Topics
      By Use CaseFor every technical scenario
      • Network Monitoring
      • Server Monitoring
      • OT Monitoring
      • Distributed Monitoring
      • Network Topology Mapping
      • SNMP Monitoring
      • Bandwidth Monitoring
  • Pricing
  • Resources
    • Getting Started
      Getting StartedModules for self-paced learning
    • How-to Guides
      How-to GuidesGet the most out of PRTG
    • Videos & Webinars
      Videos & WebinarsLearn from Paessler experts
    • IT  Knowledge
      IT KnowledgeExpand your IT knowledge
    • PRTG Manual
      PRTG ManualFull documentation
    • Knowledge Base
      Knowledge BaseShare community knowledge
    • PRTG Sensor Hub
      PRTG Sensor HubGet sensors, scripts & templates
    • Trainings
      PRTG TrainingLearn how to work with PRTG
  • Partners
    • Icon Handshake
      Become a PartnerFor resellers and channel partners
    • Icon MSP
      Become an MSPDeliver monitoring as a managed service
    • icon partner
      Partner PortalLog in to your partner account
    • Deal Registration
      Deal RegistrationRegister your sales opportunities
    • icon search
      Find a PartnerFind partners selling Paessler products
    • icon technology
      Technology AlliancesSee Paessler technology partnerships
    • Partner HubTools for Your Success
  • Company
    • About Us
    • Case Studies
    • Press Center
    • Careers
    • Blog
    • Contact us
  • Contact us
  • Login
  • English
    • Deutsch
    • Español
    • Français
    • Italiano
    • Português
  • Get a quote
  • Free trial
  1. Home>
  2. Company>
  3. Case Studies>
  4. Leica Geosystems

From Tool Sprawl to One Platform: How Leica Geosystems Consolidated Global IT Monitoring with PRTG

Challenge: Replacing a fragmented mix of monitoring tools with a single, centralized platform covering SQL, SAP, servers, and global infrastructure

download PDF
Logo Company Leica Geosystems

COMPANY
Leica Geosystems

INDUSTRY
Manufacturing

COMPANY SIZE
Enterprise

COUNTRY
Switzerland

SCALE
4,500+ employees, 35 countries, 6 remote probes

Icon Sensor

Custom SQL and SAP sensors replace three separate monitoring tools

Icon Monitoring

Device templates standardize monitoring across all server types globally

Icon Alarm

All alerts acknowledged in PRTG, all incidents tracked in the ticketing system

The problem

Leica Geosystems provides high-availability IT services to more than 4,500 employees across 35 countries. The IT team works across different locations and time zones. Real-time status for all sites had to be accessible from a single place.

Monitoring was anything but centralized. The team was running WhatsUp Gold, BSM for SAP, and Systems Insight Manager alongside a new SQL monitoring project. Every tool added complexity. No single view existed. One platform was needed to replace them all.

What changed with PRTG

Leica Geosystems started with PRTG for SQL database monitoring, working with ITPS AG to build custom sensors for MS SQL, MySQL, and Oracle. The pilot proved the concept. The team then consolidated all other tools into PRTG.

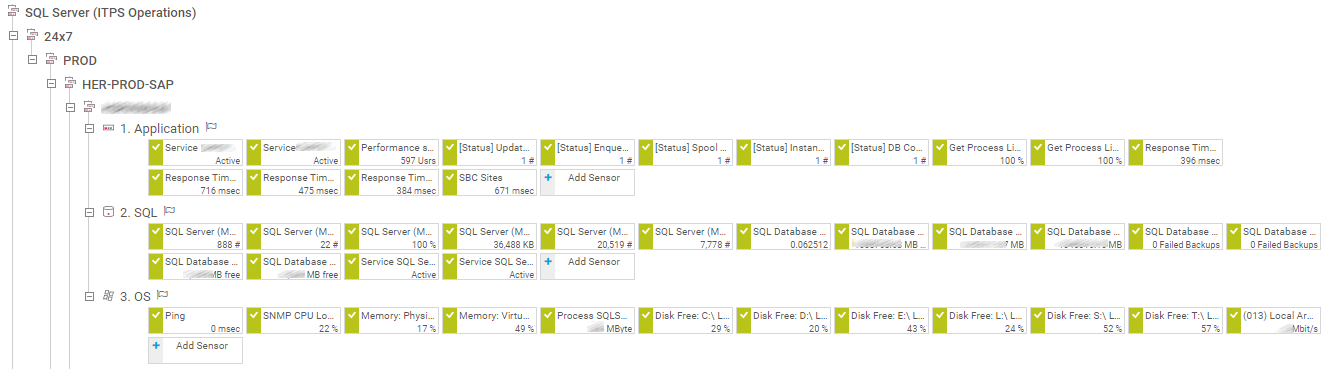
Today, a single PRTG server with six remote probes covers Switzerland, APAC, EMEA, the Americas, SQL databases, and internal teams. 17,000 sensors are active: 12,000 managed by central IT, 5,000 by internal teams. Custom SAP sensors monitor applications at the OS, database, and application level.

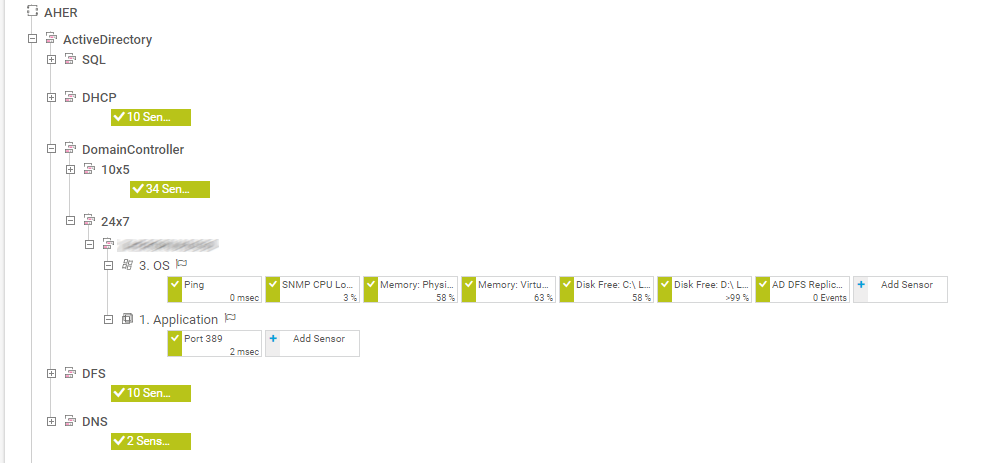
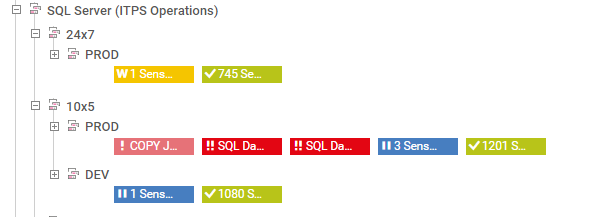
Device templates standardize configurations across server types, with five to ten sensors per device. SLA groups make it easy to assess incident severity.

The team disabled email alerts entirely. The service desk checks the PRTG console directly. When an alert appears, a ticket is opened, the alarm is acknowledged, and the ticket number is logged. The goal: everything green or acknowledged.

We were eager to try a centralized, all-in-one IT management tool for our monitoring. After evaluating our existing slate of tools, we quickly decided to go with PRTG as our default solution.

Michael Türtscher, IT Systems Engineer – Infrastructure and IT Service Owner Monitoring Manager
Leica Geosystems AG
PRTG Logo

PRTG monitors global enterprise infrastructure, SQL, SAP, and distributed networks from one platform.

CONTACT SALES
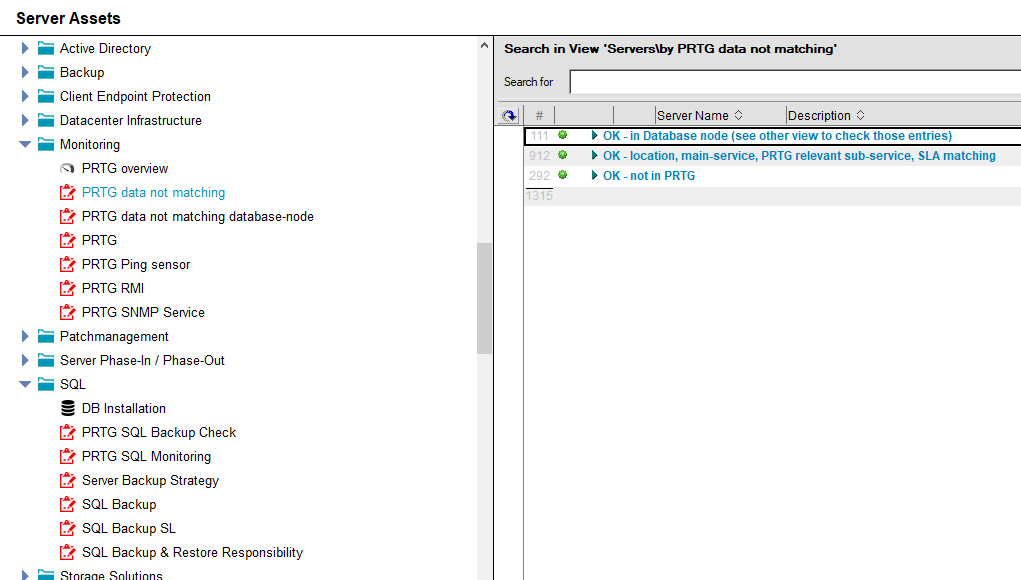
Leica Geosystems: Server Assets
Leica Geosystems: Screenshot Device Tree SQL Server
Leica Geosystems: Screenshot Device Tree
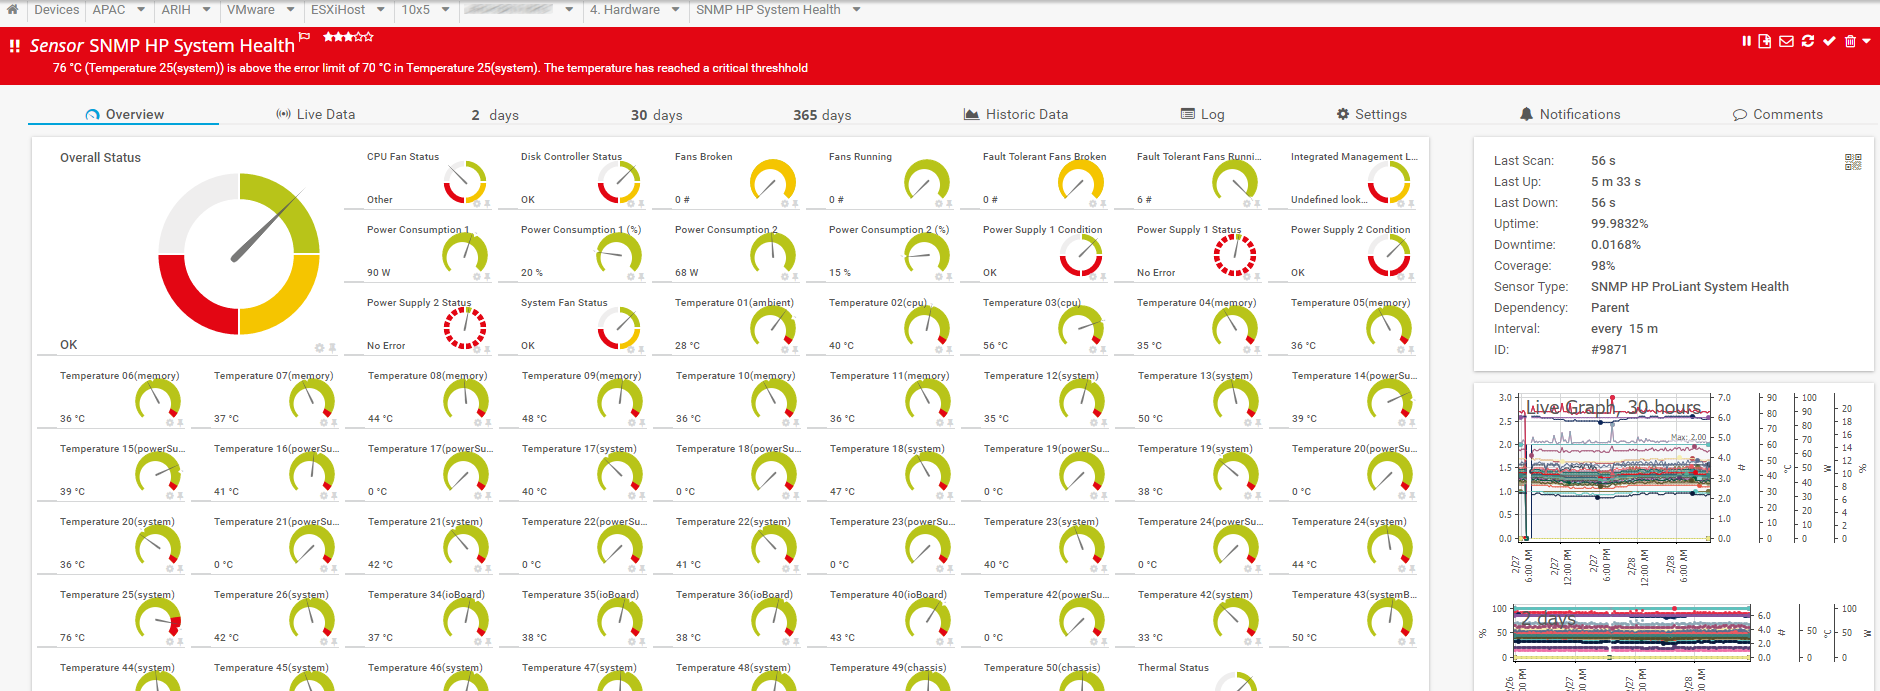
Leica Geosystems: Screenshot SNMP HP System Health Sensor

Discover more monitoring insights and stories

Solution illustration

Solutions for all your monitoring needs

  • LAN Monitoring
  • IP Monitoring
  • CPU Monitoring
Content illustration

Powerful stories from the monitoring world

  • Customer success stories - Paessler
  • Video: Making the lives of sysadmins easier
  • Customer success story: Bosch Energy and Building Solutions with PRTG
Support illustration

Resources to master your monitoring challenges

  • I run PRTG on VMware. How can I obtain best performance?
  • Device and Sensor Setup
  • Quick Start Guide
Explore All Case Studies

Products

  • Paessler PRTG
    Paessler PRTGMonitor your whole IT infrastructure
    • PRTG Network Monitor
    • PRTG Enterprise Monitor
    • PRTG Hosted Monitor
    • PRTG UVexplorer
    • PRTG extensions
      Extensions for Paessler PRTGExtend your monitoring to a new level
  • Icon Features
    FeaturesExplore all monitoring features

Monitoring with PRTG

  • Network monitoring
  • Bandwidth monitoring
  • SNMP monitoring
  • Network mapping
  • Wi-Fi monitoring
  • Server monitoring
  • Network traffic analyzer
  • NetFlow monitoring
  • Syslog server

Useful Links

  • PRTG Manual
  • Knowledge Base
  • Customer Success Stories
  • About Paessler
  • Subscribe to newsletter
  • PRTG Support
  • PRTG Consulting
  • PRTG Feedback & Roadmap

Contact

Paessler GmbH
Thurn-und-Taxis-Str. 14, 
90411 Nuremberg 
Germany

[email protected]

+49 911 93775-0

  • Contact us
©2026 Paessler GmbHTerms & ConditionsPrivacy PolicyImprintReport VulnerabilityDownload & InstallSitemap
vCenter Monitoring vCenter Monitoring vCenter Monitoring