


I rapporti personalizzati e la visualizzazione dei dati consentono di identificare e prevenire rapidamente i problemi di rete .
La scelta del miglior strumento di rapporto di rete dipende dalle vostre esigenze, ma ci sono alcuni requisiti di base da tenere a mente.
Definite l'elenco dei dispositivi che desiderate utilizzare come fonti di dati. Ad esempio, server, bilanciamento del carico, switch, router e così via. Questi determinano il numero di sensori e la larghezza di banda necessaria.
Più informazioni dettagliate si vogliono raccogliere, più risorse saranno necessarie e più alti saranno i costi. Inoltre, dovrebbe essere facile integrare dispositivi di produttori diversi.
Scegliete una soluzione di rapporto di rete in grado di raccogliere ed elaborare dati da diversi dispositivi di rete e di analizzarli tutti insieme. In questo modo, non è necessario passare da un'interfaccia utente all'altra per analizzare i dati provenienti da fonti diverse.
Si otterrà invece una visione chiara dello stato di salute della rete utilizzando un'unica finestra per la visualizzazione dei dati e la generazione di rapporti completi.
Come amministratore di rete, spesso si passa molto tempo a rivedere tutti i dati storici raccolti dai vari log. Per rendere questo processo più rapido e semplice, è necessario disporre di uno strumento di reporting di rete che non solo raccolga tutti i dati raccolti in un unico luogo, ma che consenta anche di configurare quando e dove ricevere i rapporti automatici.
Il costo di uno strumento di monitoraggio e rapporto di rete dipende solitamente dal numero di dispositivi e metriche della rete. Quando si espande la rete, è importante poter monitorare un maggior numero di dispositivi e le relative metriche, ossia scalare in modo semplice.
Inoltre, è importante che la soluzione scelta possa funzionare sia con infrastrutture on-premise e ibride che con soluzioni cloud.
Diagnosticare i problemi di rete monitorando e confrontando continuamente i dati in tempo reale e quelli storici e generando rapporti di rete approfonditi. Mostra la disponibilità, la salute e le prestazioni dell'infrastruttura di rete aziendale e altre metriche chiave in tempo reale. Visualizzate i dati di monitoraggio in grafici e dashboard chiari e utilizzate la mappa della rete per identificare più facilmente i problemi. Ottenete la Panoramica necessaria per la risoluzione dei problemi dell'intera rete.

Albero dei dispositivi dell'intera configurazione di monitoraggio

Grafico dei dati di traffico in tempo reale in PRTG
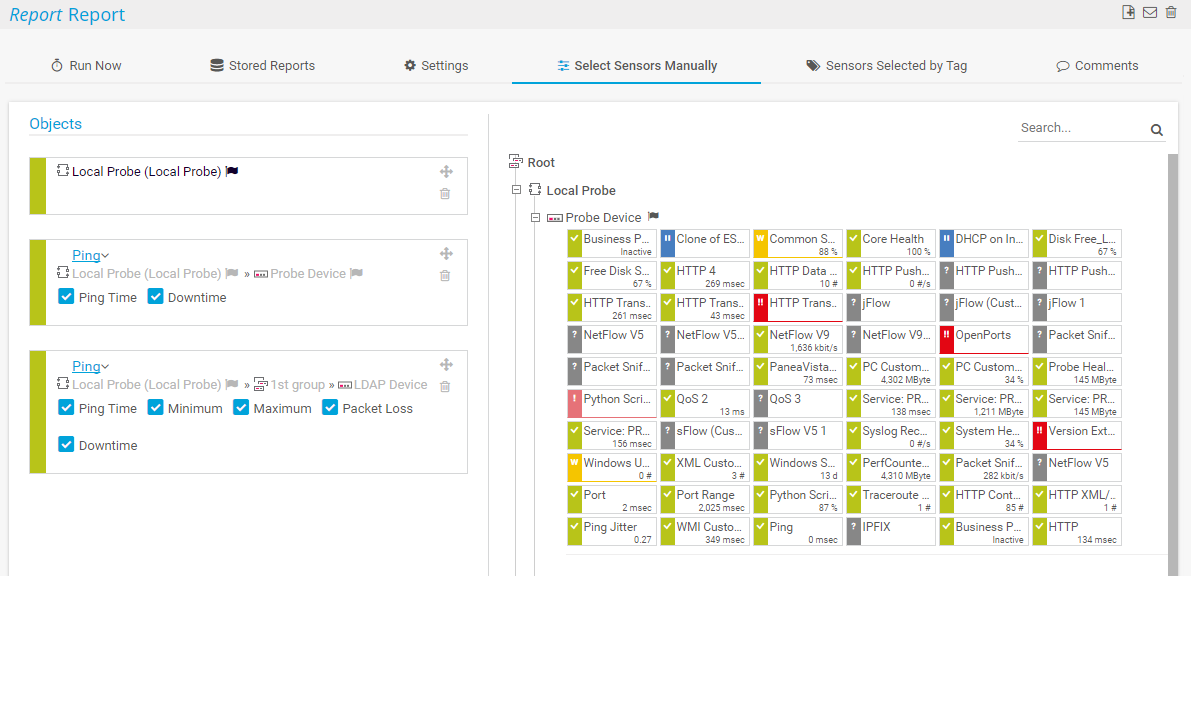
Selezione del sensore con PRTG
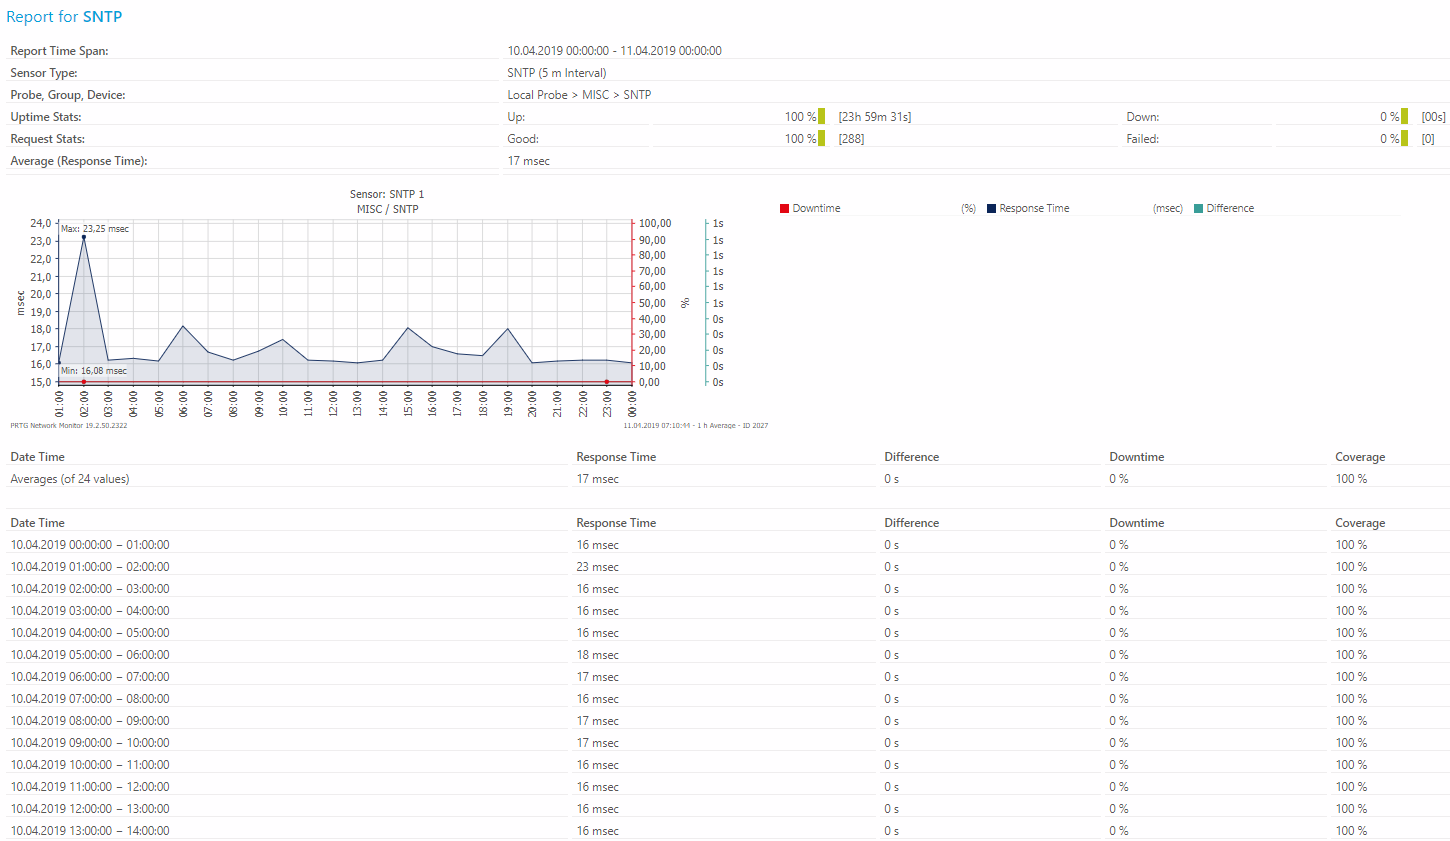
Rapporto SNTP con PRTG
Notifiche in tempo reale significano una risoluzione più rapida dei problemi, in modo da poter agire prima che si verifichino problemi più gravi.
“Monitor di rete vincente sotto tutti i punti di vista”
“La vera bellezza di PRTG sta nelle infinite possibilità che offre”
“PRTG Network Monitor
è molto difficile da superare”
Il PRTG di Paessler semplifica la creazione di rapporti e l'analisi dei dati in un periodo di tempo (compresi i dati storici). È possibile creare rapporti per tutti i sensori PRTG o solo per quelli specifici.
Il processo di creazione dei rapporti è semplice e intuitivo. Scegliete un modello e aggiungete i sensori da cui volete includere i dati nel rapporto. Impostare il periodo di tempo per il quale si desidera visualizzare i dati. Per motivi di prestazioni, il PRTG calcola automaticamente la media dei dati di monitoraggio quando calcola i dati per grandi periodi di tempo.
Inoltre, è necessario specificare se il rapporto verrà generato secondo una schedule o solo quando necessario. Se in base a una schedule, è necessario indicare a quali intervalli di tempo deve essere generato il rapporto. È possibile specificare l'indirizzo e-mail a cui inviare il rapporto finito.
È possibile generare rapporti su richiesta o tramite schedule. Il PRTG genera rapporti in formato HTML, PDF, CSV o XML. Inoltre, è possibile creare rapporti HTML specifici sulla configurazione del sistema.
I modelli di rapporto del PRTG definiscono l'aspetto generale del rapporto e la granularità dei dati di monitoraggio. È possibile includere nel rapporto, ad esempio, dati grezzi e tabelle di valori estese per i colleghi IT, oppure includere solo grafici di dati per una Panoramica di alto livello per la direzione, ad esempio.
Utilizzando il nostro strumento di monitoraggio della rete, potete essere sicuri che i dati di monitoraggio siano disponibili solo per voi e per gli utenti a cui avete dato accesso. PRTG utilizza tecnologie moderne per la sicurezza della rete:

PRTG è un software di monitoraggio e reporting di rete potente ed economico che facilita la generazione di diversi tipi di rapporti che consentono ai tecnici di visualizzare rapidamente le prestazioni della rete e prendere decisioni critiche.
I rapporti personalizzati e la visualizzazione dei dati consentono di identificare e prevenire rapidamente i problemi di rete .
PRTG si configura in pochi minuti e può essere utilizzato su un'ampia gamma di dispositivi mobili.


“Eccellente strumento per un monitoraggio dettagliato. Gli avvisi e le notifiche funzionano perfettamente. L'aggiunta dei dispositivi è intuitiva e la configurazione iniziale del server è molto semplice. ...acquistatelo tranquillamente se desiderate monitorare un vasto panorama di rete.”
Grazie alla collaborazione con fornitori IT innovativi, Paessler libera sinergie per creare nuovi e ulteriori vantaggi per i suoi clienti.
La combinazione dell'ampio set di funzioni di monitoraggio di PRTG con la garanzia di rete automatizzata di IP Fabric crea un nuovo livello di visibilità e affidabilità della rete.
L'integrazione dei risultati del monitoraggio di PRTG nelle mappe di NetBrain costituisce la base per l'automazione della rete.
Con ScriptRunner Paessler integra una potente piattaforma di automazione degli eventi in PRTG Network Monitor.
Notifiche in tempo reale significano una risoluzione più rapida dei problemi, in modo da poter agire prima che si verifichino problemi più gravi.
Software di monitoraggio della rete – Versione 26.1.116.1532 (February 9th, 2026)
Disponibile il download della versione per Windows e della versione cloud-based PRTG Hosted Monitor
Inglese, tedesco, spagnolo, francese, portoghese, olandese, russo, giapponese e cinese semplificato
Dispositivi di rete, larghezza di banda, server, applicazioni, ambienti virtuali, sistemi remoti, IoT e molto altro
Scegli l'abbonamento a PRTG Network Monitor più adatto a te


I rapporti di rete sono uno strumento importante per gli amministratori di rete che permette di visualizzare vari dati sulle prestazioni della rete. Utilizzando i rapporti di rete, gli amministratori possono identificare e correggere gli errori, ottimizzare le prestazioni della rete e prendere altre decisioni importanti.
Con l'aiuto dei rapporti di rete, è possibile strutturare e organizzare molte metriche importanti della rete in modo da facilitarne la visualizzazione e l'analisi. L'analisi dei rapporti consente di trovare i colli di bottiglia della rete, migliorare le prestazioni, prevedere le prestazioni future della rete e prendere decisioni critiche su modifiche e aggiornamenti.
Il software di monitoraggio della rete deve essere in grado di raccogliere e analizzare i dati provenienti da vari dispositivi di rete come router, switch, server, firewall, bilanciamento del carico e altri endpoint come sistemi e applicazioni. Gli strumenti di reporting di rete presentano questi dati raccolti sotto forma di rapporti collegati.
I rapporti di rete sono uno strumento prezioso per gli amministratori perché permettono di identificare le tendenze della rete, valutare le metriche delle prestazioni complessive, migliorare la produttività, trovare la causa principale degli errori e risolvere i problemi di prestazioni.
Poiché una rete è costituita da molti componenti e ha molti indicatori del suo funzionamento e delle sue prestazioni, esistono molti tipi diversi di rapporti. Il processo di creazione e analisi di questi ultimi può essere un compito piuttosto difficile. Pertanto, lo strumento di reporting di rete deve consentire agli amministratori di accedere ai dati storici e di personalizzare i rapporti in modo da includere solo i dati rilevanti.
Gli strumenti di rapporto di rete aiutano gli amministratori di rete a gestire efficacemente le loro reti. Le soluzioni di monitoraggio della rete, come il PRTG Network Monitor di Paessler, forniscono dati sulle prestazioni della rete e i rapporti di rete consentono di riassumere le informazioni ricevute in un formato conveniente che può essere facilmente analizzato, estratto e condiviso.
I principali compiti che gli strumenti di rapporto di rete possono risolvere sono:
Con il nostro strumento di monitoraggio della rete PRTG, è possibile raccogliere dati di monitoraggio della rete e creare e personalizzare rapporti di facile lettura.
I rapporti sulle prestazioni di rete possono visualizzare migliaia di metriche di rete che forniscono informazioni su prestazioni, disponibilità, problemi esistenti e altro ancora. Con l'aiuto dei rapporti, è possibile ottenere informazioni importanti sulle linee di base della rete, sulle specifiche e sullo stato dell'hardware, sull'esperienza dell'utente finale e su altri parametri di prestazione.
Esempi di informazioni che un rapporto di rete può contenere:
In PRTG, i “sensori” sono gli elementi base del monitoraggio. Un sensore monitora solitamente un valore misurato nella tua rete (ad esempio, il traffico di una porta switch, il carico della CPU di un server o lo spazio libero di un’unità disco). In media, occorrono circa 5-10 sensori per ogni dispositivo o un sensore per ogni porta switch.
Paessler ha condotto prove in oltre 600 dipartimenti IT in tutto il mondo per mettere a punto il suo software di monitoraggio di rete più vicino alle esigenze dei sysadmin. Il risultato è che più del 95% degli intervistati consiglierebbe PRTG – o lo ha già fatto.

Paessler PRTG è utilizzato da aziende di tutte le dimensioni. Gli amministratori di sistema adorano PRTG perché rende il loro lavoro molto più semplice.
Ampiezza di banda, server, ambienti virtuali, siti Web, servizi VoIP - PRTG tiene d'occhio la tua intera rete.
Tutti hanno esigenze di monitoraggio diverse. Ecco perché ti lasciamo provare PRTG gratuitamente. Inizia oggi stesso la tua prova.

