Quo Vadis, SNMP? (inglês)
White Paper Part 2: Putting SNMP into practice
Introduction
In the first part of this White Paper, we looked at the basic features of SNMP, the history, problems, and future prospects. Alternatives to the established, yet frequently problematic, protocol were also shown. This second part focuses on the technical side—from the use of MIBs to the practical setup of network monitoring. As the developer of an established network monitoring software, Paessler AG has been dealing with SNMP extensively since 1996 and has looked closely into its options—and inadequacies
Management Information Base (MIB)
To transfer measurements and therefore to monitor a network using SNMP it is a prerequisite to have functioning communication between both the SNMP client and server. For this, the available SNMP objects must have unique addresses that are known to
both sides.
The “Management Information Base” (MIB) was created as an independent format to store device information so that access can be gained regardless of the manufacturer, as well as when different client-server combinations are used.
In an MIB file, all searchable objects in a device are described using an “Object Identifier” (OID). Via these OIDs, SNMP objects are defined with a unique address, a name, and information on the type, access rights, and a description of the respective object.
MIB also supports tables that are used when access to several similar objects is necessary and the exact number of instances is unknown. Typical examples include the different ports of a switch or the load measurements of a server with several processors. First, the OIDs of all columns of a table’s line are defined. Access is given to the specific objects in a table via these OIDs in an attached index value.
For a program to be able to manage SNMP capable devices, it should ideally be able to import and interpret the MIB definition files. These files for defining MIB can usually be recognized by file names ending in .mib or .my.
So that not every file has to define the tree from the top, there is a mechanism to import other MIB data into an existing file that can in turn be interwoven infinitely.
FIGURE 1: Example of a typical OID entry in the mib file IF-MIB.mib
ifInOctets OBJECT-TYPE
  SYNTAX Counter32
  ACCESS read-only
  STATUS mandatory
  DESCRIPTION
   “The total number of octets received on the interface,
   including framing characters.”
  ::= { ifEntry 10 }
Figure 1 shows a typical OID-Entry in an MIB: This is the counter for incoming traffic from the MIB file for standard interfaces, e.g. for a switch. This OID has the address 1.3.6.1.2.1.2.2.1.10.[index]. If the incoming traffic at the third port is to be evaluated, access is gained through 1.3.6.1.2.1.2.2.1.10.3.
Challenges When Setting up SNMP
Although SNMP generally works reliably, in our first White Paper we discussed several obstacles which an administrator can encounter, especially during the first setup of network monitoring via this protocol. The challenges related to this shouldn’t be off-putting. With the relevant knowledge, any problems can be solved. Knowing the possible variations is the first step. The following section gives deeper insight into the subject, with several practical scenarios and examples of operational experience from a monitoring specialist’s point of view.
The four most common stumbling blocks when setting up SNMP
1. Load Problems
Normally, when monitoring with SNMP, each measurement is requested individually. If information is collected from many SNMP objects, countless requests are generated per interval when gathering very detailed monitoring data. Not every device and not every
application can easily deal with this volume. If the request intervals are set up too close together, it could put an additional, heavy load on the network. That is why it is important to begin with moderate standard settings (for example: every minute, one retrieval from all counters) and to observe the actual load. A suitable monitoring solution supports the administrator in doing this and helps him to identify load problems very early on. This way he is able to adapt the request intervals accordingly and to find out the ideal settings.
The more often the data is requested, the more detailed the monitoring data will be. Should the balance between load and accuracy of the results be maintained, then hugely detailed data is not advisable for every use. It is also important to take into consideration how short a request interval should be allowed to be. This depends on how often a device provides measurements internally. With the SNMP object type “Counter,” it is important to avoid too long a request interval. If it is a 32-bit counter, then the data wouldn’t be requested often enough. This can lead to wrong measurements due to the buffer overflow.
2. Setup Effort
Hardware manufacturers often provide suitable MIB files. If this is not the case, finding the suitable information in independent internet databases can involve a lot of effort. And once you have found the suitable MIB file, it often needs to include more files that
are ideally delivered with it. However, in worst cases these are also very difficult to get. In addition, protocols and MIBs are frequently only implemented superficially or inaccurately. If the MIB parser stumbles, the data often has to be patched manually to be able to
get it to run on the available parser. Paessler supports the user with its Knowledge Base which includes links to find MIB files
and the respective software to import it.
It is even easier to do this with an Auto-Discovery function. If the SNMP client has this kind of automatic search at his disposal, then the devices in a network are often recognized automatically. The SNMP client scans the network to find existing devices and sets up the SNMP objects to be monitored automatically, so that the administrator doesn’t even have to think about MIB files. “Intelligent” network monitoring software is tolerant of mistakes, so SNMP implementation faults on the hardware manufacturer’s side can be caught in the background without anyone noticing anything.
3. Altered OIDs
Some devices change their SNMP objects at every reboot. It is normal that fixed OIDs are listed in the configuration when monitoring, but this can lead to obstacles. If the SNMP objects cannot be found at their former OID address by the client software, no more data can be requested—and the monitoring comes to a standstill. This problem can be avoided by using software that automatically re-assigns the OIDs. This ensures that SNMP objects are still available for monitoring at a different OID.
4. Encryption
It is not easy to set up encrypted transfer. Especially when one needs complex encryption (SNMP V3), it can be too much for an inexperienced administrator to handle. If the setup is incomplete, clear text transfer can unexpectedly take place, creating a real safety risk. A responsible professional should carefully check the devices’ configuration, for example, by using Paessler’s free SNMP Tester. This allows for uncomplicated requests for the SNMP data from any given device in a network. SNMP V1 to V3 are supported.
A small example (command line)
It is not difficult to start SNMP communication with a device. The way this kind of connection works is shown in the following short example in which some data is requested by a Cisco-Switch at the commando line level. Here, the Open Source Net- SNMP library is at work, which is available as a download for Windows and Linux. The calls are identical for both operating systems.
First, a single counter is requested using snmpget, in this case, the uptime of the switch (see figure 2).
FIGURE 2: Requesting a single value with snmpget; here the uptime of a switch is polled
>snmpget -c public -v 1 -O f 10.0.0.127 1.3.6.1.2.1.1.3.0
.iso.org.dod.internet.mgmt.mib-2.system.sysUpTime.sysUpTimeInstance =
Timeticks: (128229595) 14 days, 20:11:35.95
The options of the request in detail:
Option
-c public
-v 1
-O f
10.0.0.127
1.3.6.1.2.1.1.3.0
Description
The “SNMP Community String”, i.e. the password for access (here: “public”)
Sets SNMP version 1
Sets an option for printing the whole OID
This is the IP address of the requested switch
This is the OID to request the uptime
snmpwalk asks for a part of the MIB tree. The walk gives back all the OIDs underneath the given OID. For this, it uses a getnext internally to get from the current OID to the next.
FIGURE 3: Requesting parts of an MIB tree with snmpwalk
>snmpwalk -c public -v 1 -O f 10.0.0.127 1.3.6.1.2.1.1
.iso.org.dod.internet.mgmt.mib-2.system.sysDescr.0 = STRING: 48-Port
10/100/1000 Gigabit Switch with WebView
.iso.org.dod.internet.mgmt.mib-2.system.sysObjectID.0 = OID: .iso.org.dod.
internet.private.enterprises.3955.6.1.2048.1
.iso.org.dod.internet.mgmt.mib-2.system.sysUpTime.sysUpTimeInstance =
Timeticks: (128404187) 14 days, 20:40:41.87
.iso.org.dod.internet.mgmt.mib-2.system.sysContact.0 = STRING:
.iso.org.dod.internet.mgmt.mib-2.system.sysName.0 = STRING: Core Switch 1
.iso.org.dod.internet.mgmt.mib-2.system.sysLocation.0 = STRING: BSX
Serverraum
.iso.org.dod.internet.mgmt.mib-2.system.sysServices.0 = INTEGER: 2
.iso.org.dod.internet.mgmt.mib-2.system.sysORLastChange.0 = Timeticks: (0)
0:00:00.00
.iso.org.dod.internet.mgmt.mib-2.system.sysORTable.sysOREntry.sysORID.1 =
OID: .iso.org.dod.internet.private.enterprises.89.73
.iso.org.dod.internet.mgmt.mib-2.system.sysORTable.sysOREntry.sysORDescr.1
= STRING: RS capabilities
.iso.org.dod.internet.mgmt.mib-2.system.sysORTable.sysOREntry.
sysORUpTime.1 = Timeticks: (0) 0:00:00.00
FIGURE 4: With Net-SNMP library the switch’s data can be requested
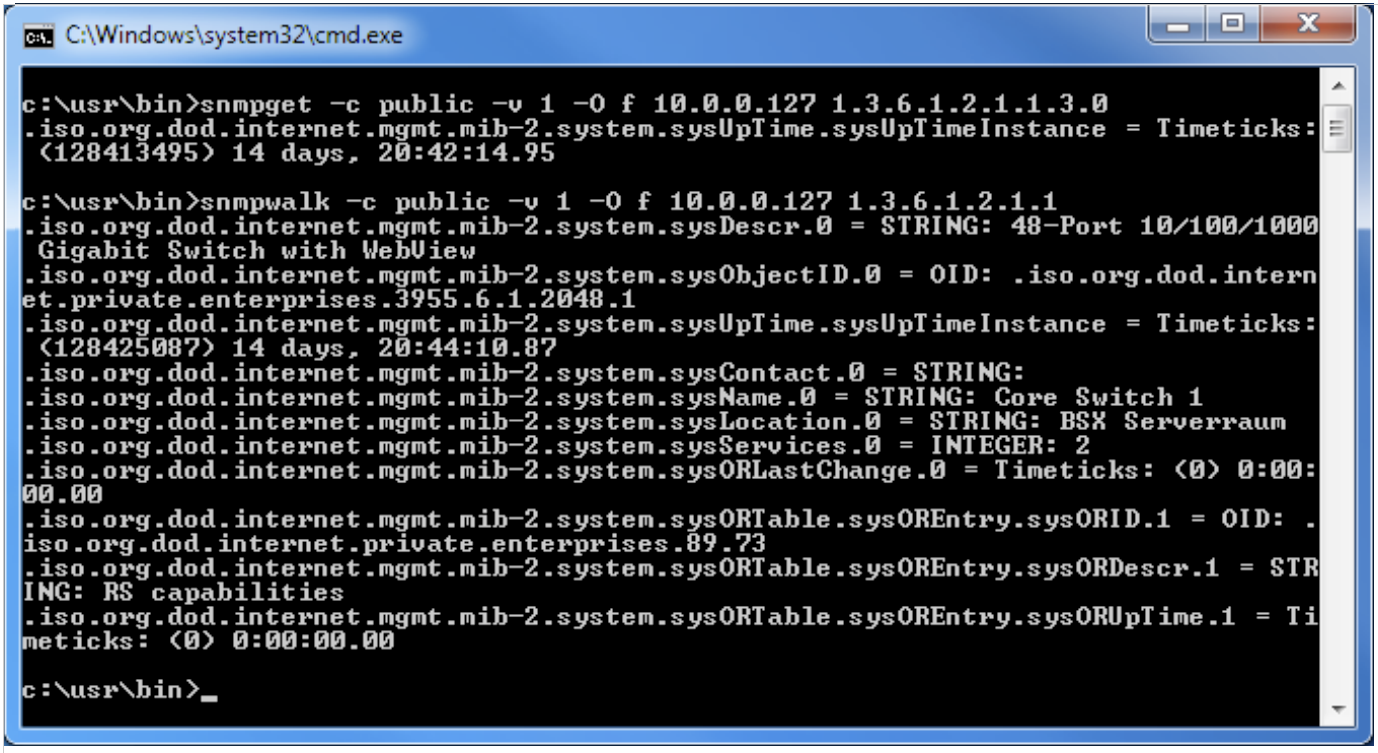
This function is also useful when debugging. In the output in figure 3 the uptime is included again. It is the same value which was requested above with the OID [...].3.0 (figure 2).
Practical Use of SNMP
A network monitoring solution deals with the request and evaluation of the data collected via SNMP. How this monitoring works is shown by the practical use of SNMP in the case of both the MRTG (available for Unix, Windows, and NetWare) and PRTG (for Windows) programs.
Both solutions monitor a Cisco switch that acts as a firewall between a LAN and a 4 Mbit line. The IP address is 10.0.0.127, the community string is “public,” and the SNMP version is V1.
MRTG Multi Router Traffic Grapher
A configuration has to be generated before MRTG can be set up for network monitoring. This happens using a Shell-Script (figure 5).
FIGURE 5: This shell script creates a configuration file for MRTG
cfgmaker   --global ‘WorkDir: /home/httpd/mrtg’ \
  --global ‘Options[_]: bits,growright’ \
  --output /home/mrtg/cfg/mrtg.cfg \
  [email protected]
Creating Configuration Data Via Script
After calling the script, MRTG connects to the given device, reads the retrievable interfaces and lists them in a configuration file as in figure 6. MRTG uses this file later to monitor the switch.
FIGURE 6: Abstract from the MRTG configuration file for a Cisco switch monitoring
# Created by
#cfgmaker [email protected] --global ‘WorkDir: /home/httpd/mrtg’ --global
´Options[_]: bits,growright’ --output /home/mrtg/cfg/mrtg.cfg
### Global Config Options
# for UNIX
# WorkDir: /home/http/mrtg
# or for NT
# WorkDir: c:\mrtgdata
### Global Defaults
# to get bits instead of bytes and graphs growing to the right
# Options[_]: growright, bits
EnableIPv6: no
RunAsDaemon: yes
Options[_]: bits,growright
#####################################################################
# System: cisco.bsx
# Description: Cisco Internetwork Operating System Software
# IOS (tm) 3600 Software (C3620-IK9O3S7-M), Version 12.3(15a), RELEASE
SOFTWARE (fc2)
# Technical Support: http://www.cisco.com/techsupport
# Copyright (c) 1986-2005 by cisco Systems, Inc.
# Compiled Fri 22-Jul-05
# Contact: [email protected]
# Location: BSX-Datacenter
The option RunAsDaemon: yes should be worked into the finished configuration file and MRTG should be run as cronjob so that there is continual monitoring. A more precise description is available in the “MRTG Installation Guide.”
Following the general settings, there are several sections that represent the interfaces found (in this case, these are the network ports in the switch). Figure 7 shows the section for the internal interface as an example.
FIGURE 7: Abstract from the MRTG configuration file; section for configuration of the internal Cisco interface
### Interface 2 >> Descr: ‘Ethernet0/1’ | Name: ‘Et0/1’ | Ip: ‘10.0.0.127’
| Eth: ‘00-02-16-48-a8-e1’ ###
Target[10.0.0.127_2]: 2:[email protected]:
SetEnv[10.0.0.127_2]: MRTG_INT_IP=”10.0.0.127” MRTG_INT_
DESCR=”Ethernet0/1”
MaxBytes[10.0.0.127_2]: 1250000
Title[10.0.0.127_2]: Traffic Analysis for 2 -- cisco.bsx
PageTop[10.0.0.127_2]: <h1>Traffic Analysis for 2 -- cisco.bsx</h1>
  <div id=”sysdetails”>
   <table>
    <tr>
     <td>System:</td>
     <td>cisco.bsx in BSX-Datacenter</td>
    </tr>
    <tr>
     <td>Maintainer:</td>
     <td>[email protected]</td>
    </tr>
    <tr>
     <td>Description:</td>
     <td>Ethernet0/1 1:private-bsx.paessler.com
[10.0.0.0/16] </td>
    </tr>
    <tr>
     <td>ifType:</td>
     <td>ethernetCsmacd (6)</td>
    </tr>
    <tr>
     <td>ifName:</td>
     <td>Et0/1</td>
    </tr>
    <tr>
     <td>Max Speed:</td>
     <td>1250.0 kBytes/s</td>
    </tr>
    <tr>
     <td>Ip:</td>
     <td>10.0.0.127 (firewall1.bsx)</td>
    </tr>
   </table>
  </div>
Changes to the settings can be made by editing the configuration file in a text editor. '“MRTG Configuration Reference” is useful for this.
The Results are Filed in an HTML-File
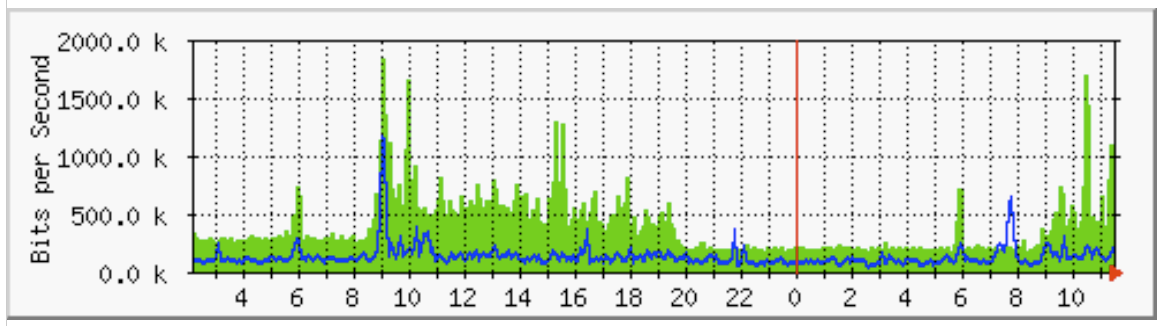
In the end, the monitoring result can be viewed in an HTML file, which MRTG stores in the given output path. Graphic overviews are also created (see figure 8).
FIGURE 8: Example of a graph, created by MRTG
PRTG Network Monitor
In PRTG setting up the monitoring of a switch takes place in a graphical, web- based user interface (see figure 9 and 10). A wizard takes you through the three configuration steps and helps with this.
A Wizard Provides Support when Setting up the Devices
FIGURE 9: Start screen of the PRTG web interface
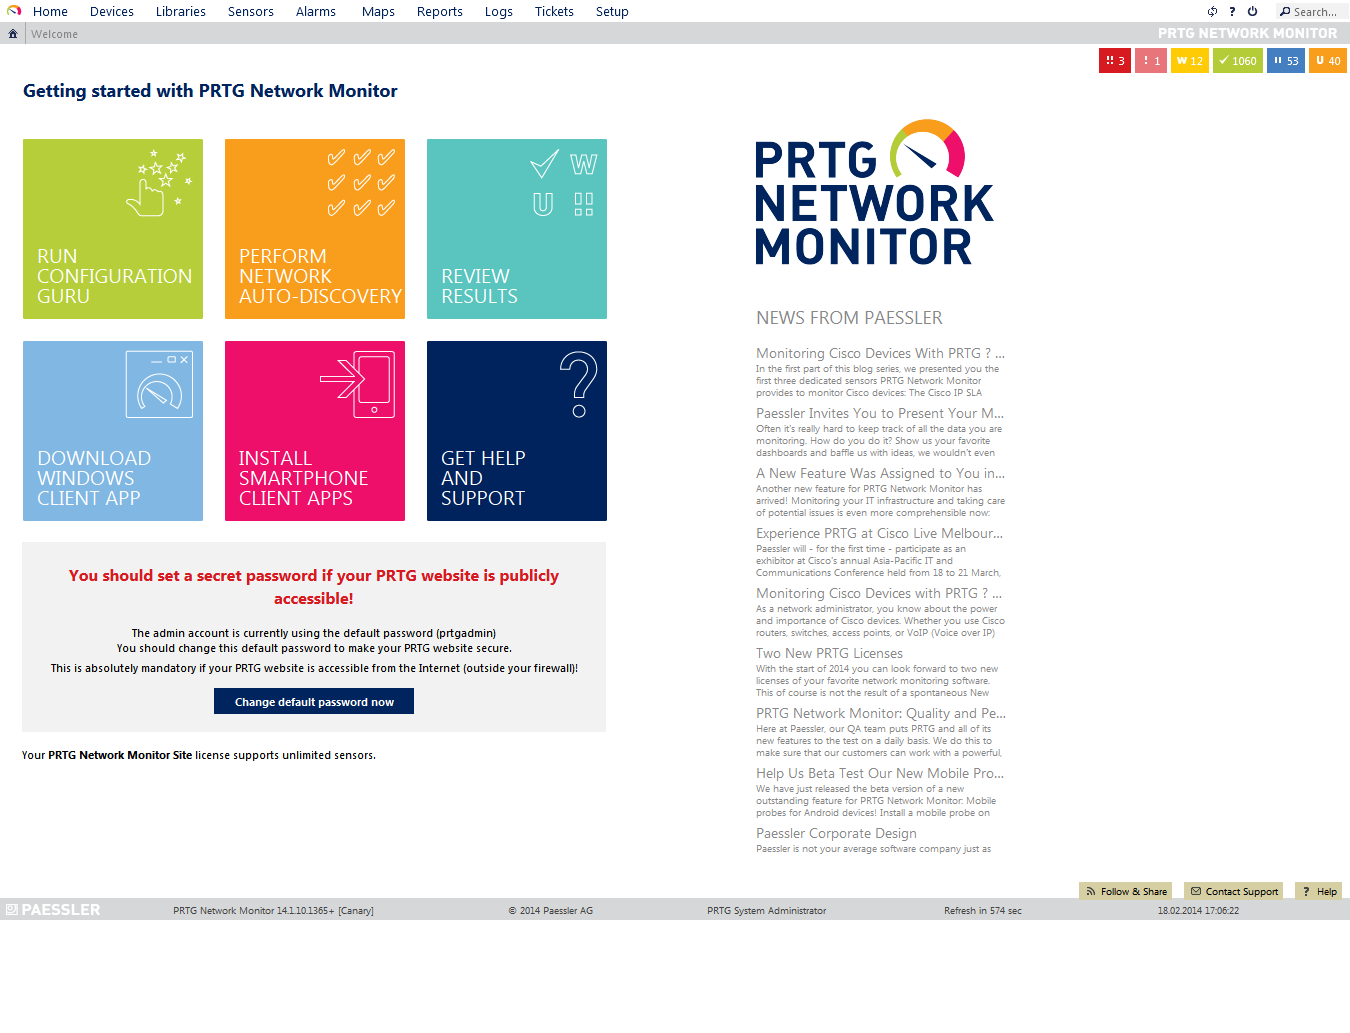
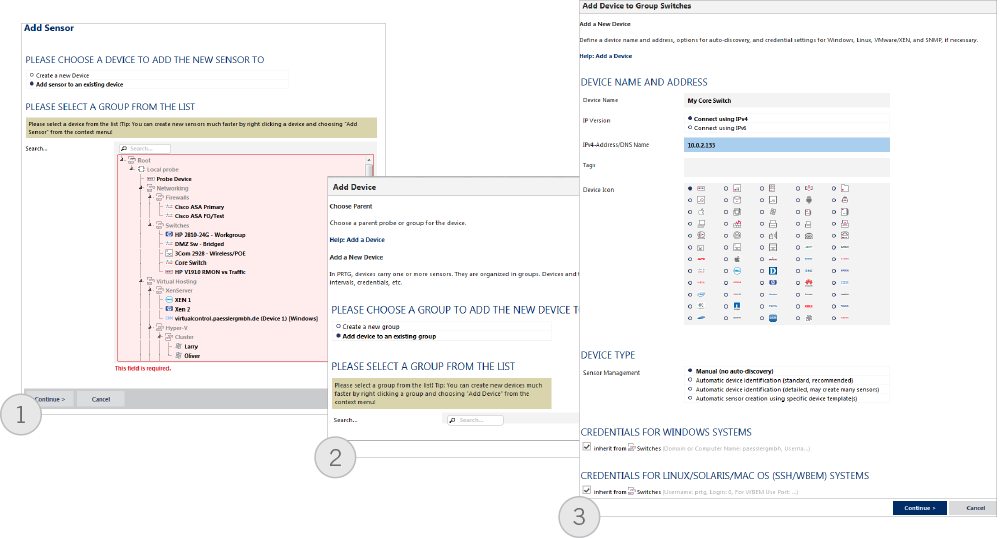
First, a “device” is set up with the switch’s IP address. If the standard settings for the SNMP port and the access data differ, these can also be changed with the help of the wizard. After that, PRTG connects to the switch and checks it using its built-in function to automatically recognize available SNMP objects.
FIGURE 10: Setting up your devices in three steps using a graphic user interface
Within a few minutes, a “sensor” for each SNMP counter is automatically added; in our example, this means 31 sensors, mainly of the type “SNMP Traffic.” Additionally, the automatic search sets up a Ping sensor to monitor the general availability of the device. This is a simple way to support debugging. It also means that, if at some point the switch stops receiving data, the administrator can quickly realize the reason for this: If the Ping sensor is “down,” then there is probably an interruption in the physical connection to the switch and not actually a changed setting in the device—for example, newly assigned credentials.
FIGURE 11: Switch with 31 sensors which were detected automatically
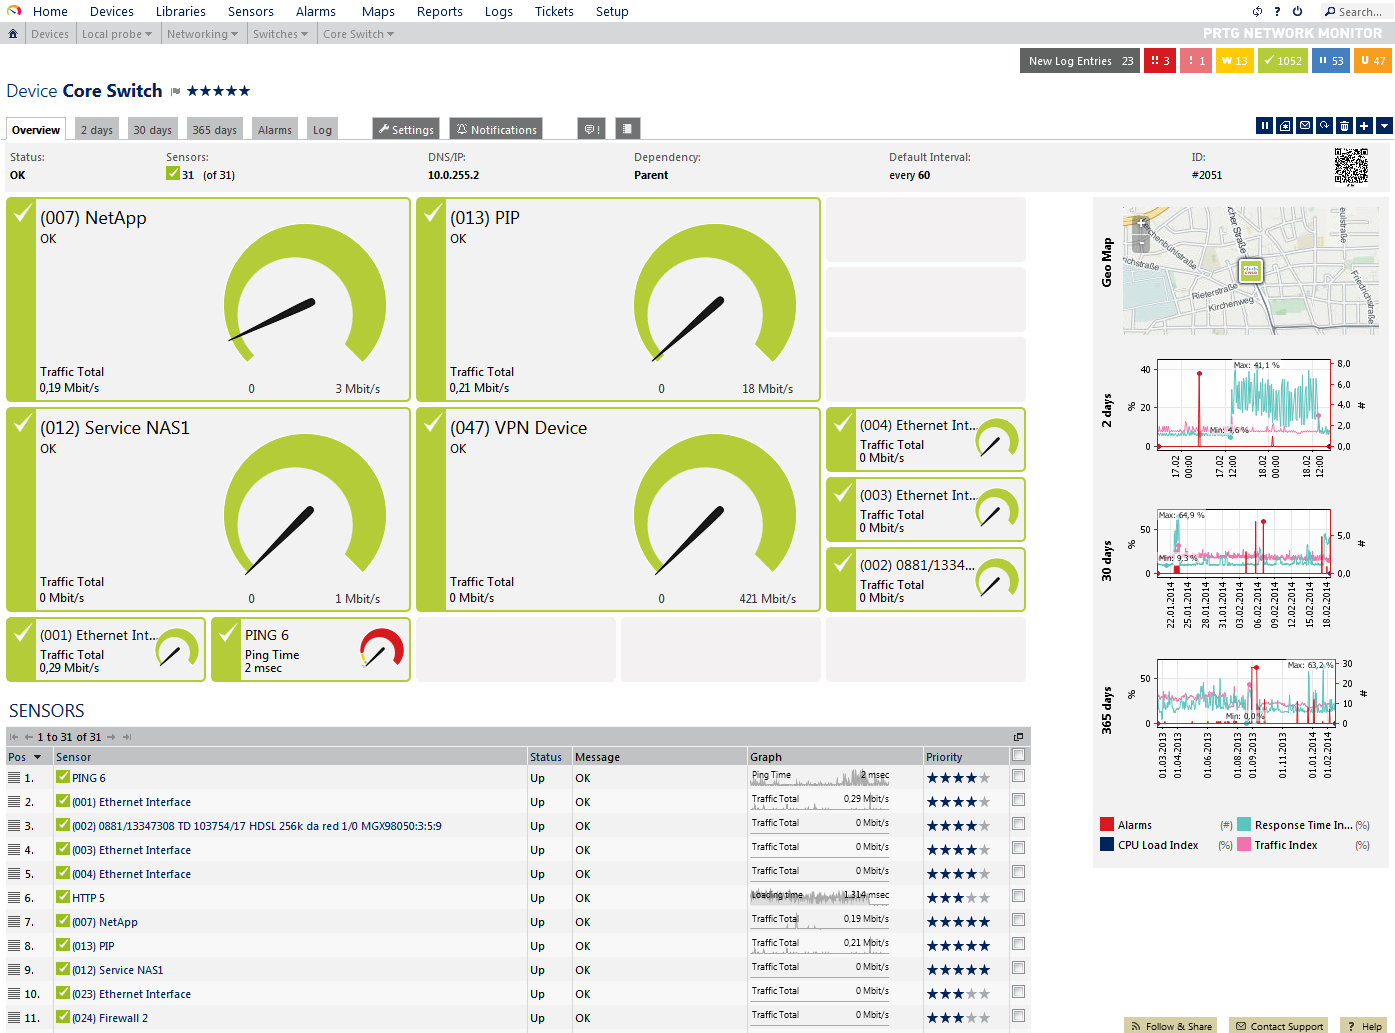
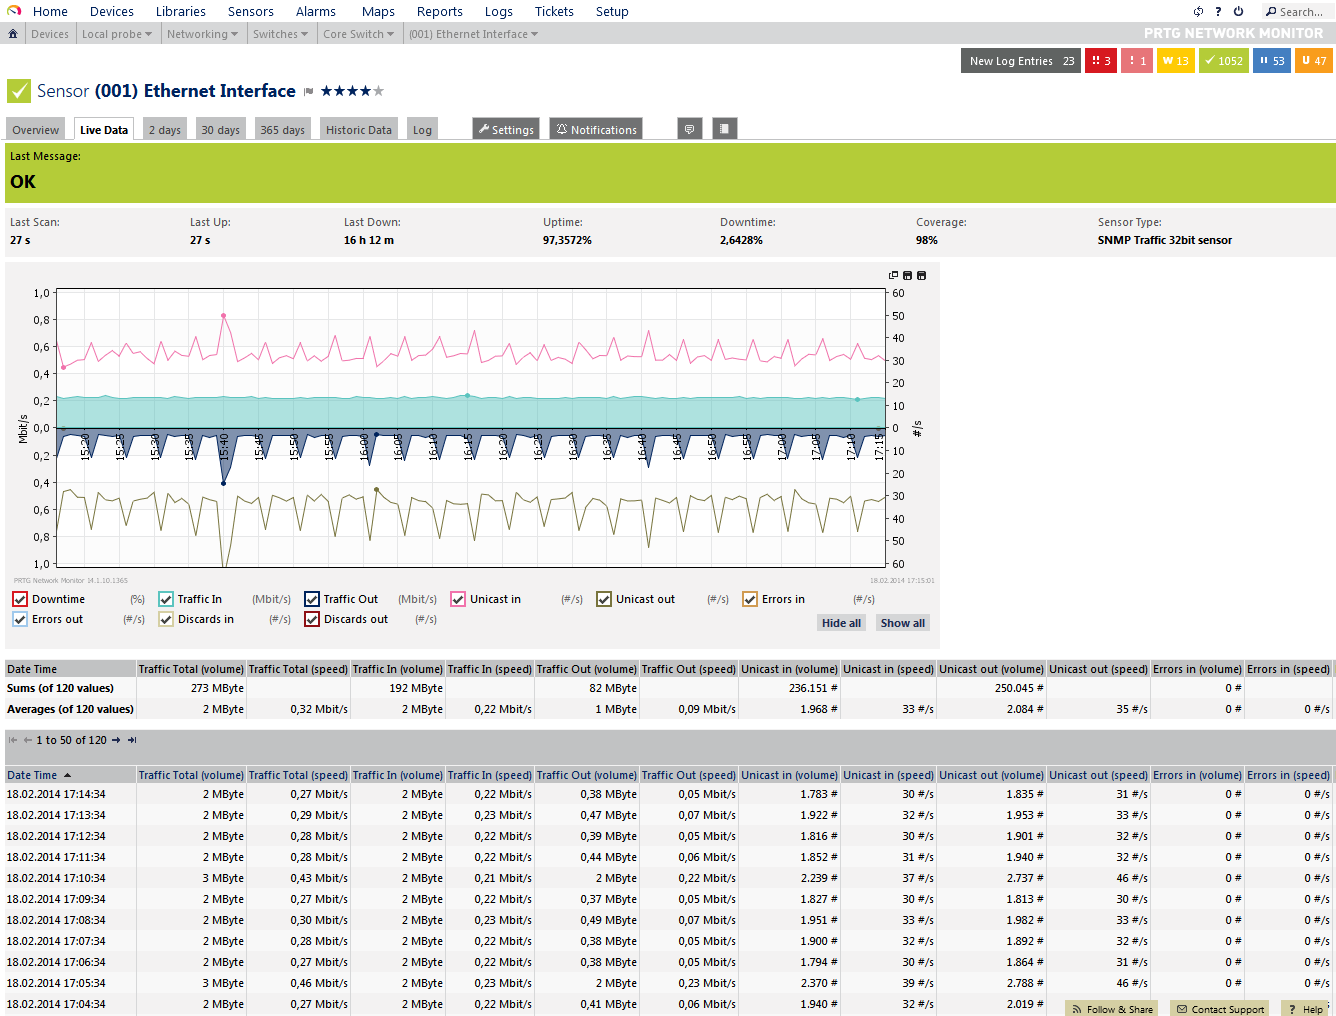
Each sensor immediately starts monitoring the network. The data is retrieved from the device at an interval of one minute using the standard setting. In the device overview (figure 11), the administrator can look at all the available counters and request further details and statistics. Graphs that show the networks’ activity clearly are also created (figure 12).
FIGURE 12: Detail view of a sensor with graph (live data)
Alternatively, the Manufacturer’s MIB Files Can be Used
For devices for which the automatic search cannot find any or all SNMP objects, MIB files can be imported from which PRTG in turn retrieves the necessary device informati-on. For this the MIB files are first converted into an “OIDlib” file that PRTG can process.
Network Monitoring Works Via a Local Probe
PRTG is operated via the web interface; the actual network monitoring takes place with a so-called “local probe.” This is a Windows-Service that runs constantly in the background and regularly retrieves data from the network devices. The other sensors “Probe Health,” “Disk Free” and the sensors for the network adaptor monitor the probe PC and give the administrator the chance to notice an overload early on. This would manifest itself as a high processor load, a large SNMP interval delay, a huge amount of used RAM memory, a full hard drive, or an especially high amount of traffic on the network card. All these problems can be independently recognized by the system so that the administrator can reduce the scanning-intervals or the amount of stored data if necessary.
Creating Reports of the Collected Data
As time goes by, a large amount of historic data is stored; this can be accessed via a reporting function and gives an overview of the network usage over a certain period of time.
In the freeware version, PRTG can be used with a limited number of sensors. For bigger projects, the temporary Trial-Version or the Commercial Edition is available.
SNMP Still Standard
This White Paper shows just how variable SNMP is in its usage—which is mainly due to its simplicity and in spite of several limitations. If the administrator is aware of the main obstacles from the outset, he can set up an effective network monitoring system for his devices and computers fairly quickly by using this protocol. A suitable monitoring solution supports the configuration, helps minimize the setup effort, and provides a powerful engine for producing statistical reports on the stored monitoring data, providing even greater value.