Os alertas personalizados e a visualização de dados permitem que você identifique e evite rapidamente a baixa largura de banda e outros problemas de desempenho da rede.
O gerenciamento da largura de banda nunca foi tão conveniente e abrangente como com as poderosas ferramentas de monitoramento da largura de banda da rede Paessler PRTG. Nosso verificador de largura de banda lhe dá as informações necessárias para otimizar rapidamente a eficiência da rede e evitar gargalos de tráfego incômodos - de qualquer lugar do mundo.
A verificação aprofundada da largura de banda do PRTG usa SNMP, NetFlow, sFlow, jFlow, IPFIX e sniffing de pacotes para detectar atividades incomuns que podem indicar problemas potenciais.
Quando algo não bate certo, o PRTG o ajuda a isolar dispositivos problemáticos ou a desativar seletivamente aplicativos suspeitos, garantindo o mínimo de interrupção em sua rede.
O conforto e a familiaridade com suas ferramentas o tornam melhor em seu trabalho. A verificação de largura de banda do PRTG se encaixa em sua caixa de ferramentas como um velho amigo, mas opera como a mais nova ferramenta de energia.
Combine nossos poderosos sensores integrados com chamadas API robustas para criar a receita perfeita para atender às suas necessidades de verificação de largura de banda e nunca mais perder outro gargalo.
Não é possível aumentar o número de olhos para observar os dispositivos de rede toda vez que um novo dispositivo entra em sua rede. Use a descoberta automática para garantir que não haja pontos cegos em sua infraestrutura.
O PRTG lhe dá um nível profundo de percepção da sua infraestrutura de rede e do uso da largura de banda, tudo através de um painel único e conveniente.
Diagnostique problemas de rede rastreando continuamente os dados de tráfego e a quantidade de dados que influenciam a taxa de transferência da rede. Mostre o fluxo de tráfego da rede, a utilização da largura de banda de seus principais locutores e outras métricas importantes em tempo real. Visualize os dados de monitoramento em gráficos e painéis claros para identificar problemas mais facilmente. Obtenha a Visão Geral de que você precisa para solucionar todos os tipos de problemas de largura de banda.

Visualização em árvore de dispositivos da configuração completa de monitoramento

Painel PRTG personalizado para manter um olho em toda a infraestrutura de TI

Gráfico de dados de tráfego ao vivo no PRTG
“Ganha tudo monitor
de rede”
“A verdadeira beleza do PRTG são as infinitas possibilidades que oferece”
“O PRTG Network Monitor é muito difícil de ser superado”
O PRTG monitora todos os aspectos do uso da largura de banda da sua rede, mantendo o controle dos padrões de tráfego, das taxas de transferência de dados e dos dispositivos conectados.
Ao consolidar várias funcionalidades de monitoramento em uma única solução, o PRTG elimina a complexidade do gerenciamento de rede. Você terá todas as informações de que precisa na ponta dos dedos.
O PRTG verifica sua largura de banda 24/7 e fornece estatísticas detalhadas sobre o consumo de largura de banda. Veja o uso da largura de banda de seus dispositivos em listas e gráficos fáceis de ler, filtrados por número de porta, endereço IPS ou protocolo.
Seus elementos críticos de rede estão sob um microscópio 24 horas por dia, deixando-o livre para coisas mais importantes, como aquela pausa para o almoço que você sempre quis fazer.
Mantenha-se informado sobre o status da largura de banda de sua rede em todos os momentos, esteja você no escritório, em casa ou na praia.
Monitore o uso da largura de banda em movimento através de mapas gráficos e painéis intuitivos, enquanto nossos aplicativos móveis PRTG garantem que você possa gerenciar a largura de banda remotamente com facilidade.
Defina e esqueça - nós o protegemos. Basta definir seus limites individuais de aviso e erro e deixar que o PRTG bandwidth check faça o trabalho por você.
Nosso sistema de alarme integrado envia notificações por e-mail, SMS, notificação push e outros métodos ao primeiro sinal de um problema de largura de banda, ajudando a manter as interrupções breves ou evitá-las completamente.
A maioria dos backups ou processos de sincronização de banco de dados requer muita largura de banda. O PRTG lhe mostra a hora do dia em que a menor quantidade de largura de banda é consumida.
Ao cronograma de backups durante períodos de baixo pico, você otimizará suas capacidades e evitará que processos de negócios importantes e aplicativos críticos sejam interrompidos.
O seu ISP está realmente fornecendo a quantidade de largura de banda que foi prometida? O PRTG lhe mostrará exatamente a quantidade de largura de banda que está sendo entregue à sua rede.
Estatísticas abrangentes, incluindo uma riqueza de dados históricos, podem ajudá-lo a provar se os termos de um acordo de nível de serviço (SLA) não estão sendo cumpridos.
Está se preparando para instalar um novo software ERP que requer 5 Mbps de largura de banda? O PRTG lhe informará se você tem largura de banda suficiente para executar o software em uma base sustentada.
Se você precisar fazer um upgrade, não há problema. Nosso software de verificação de largura de banda é projetado para escalabilidade e otimização, e vem com licenciamento flexível que cresce com suas necessidades.
O PRTG vem com mais de 250 tipos de sensores nativos para monitorar todo o seu ambiente local, na nuvem e na nuvem híbrida. Confira alguns exemplos abaixo!
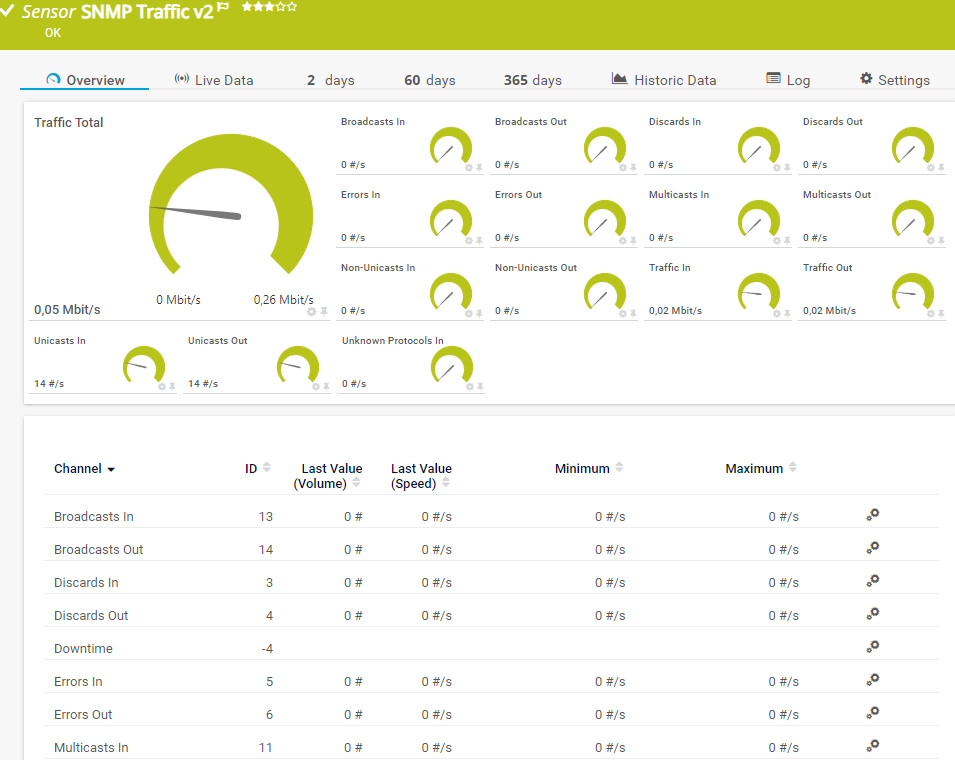
O sensor Tráfego (SNMP) v2 monitora a largura de banda e o tráfego em um dispositivo. Ele pode mostrar o seguinte:
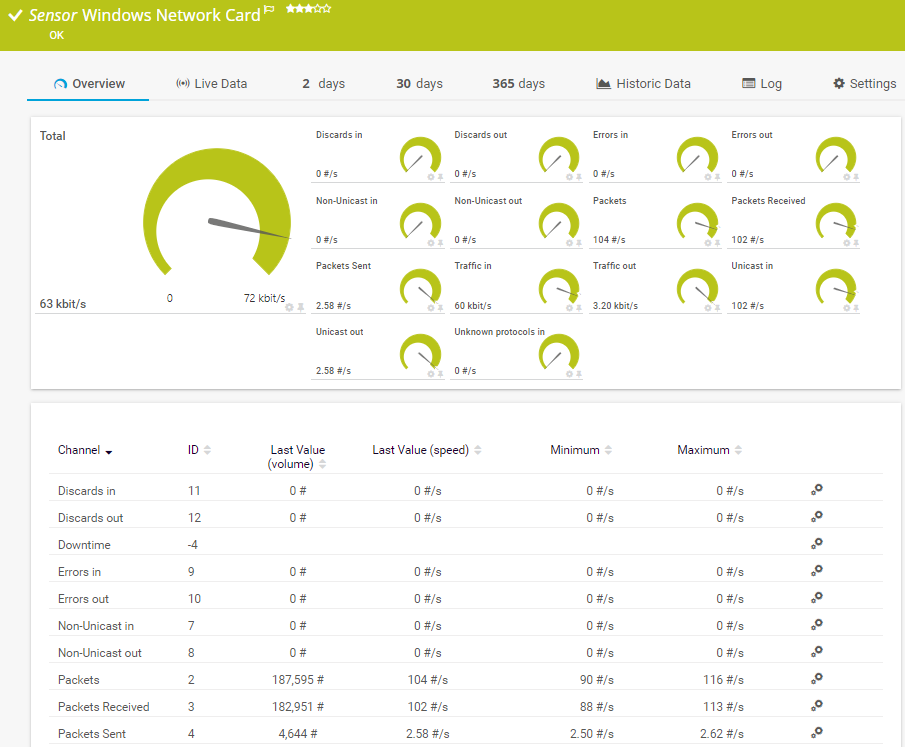
O sensor Adaptador de rede Windows monitora o uso da largura de banda e o tráfego de uma interface de rede por meio do Windows Management Instrumentation (WMI) ou dos contadores de desempenho do Windows. Ele pode mostrar o seguinte:
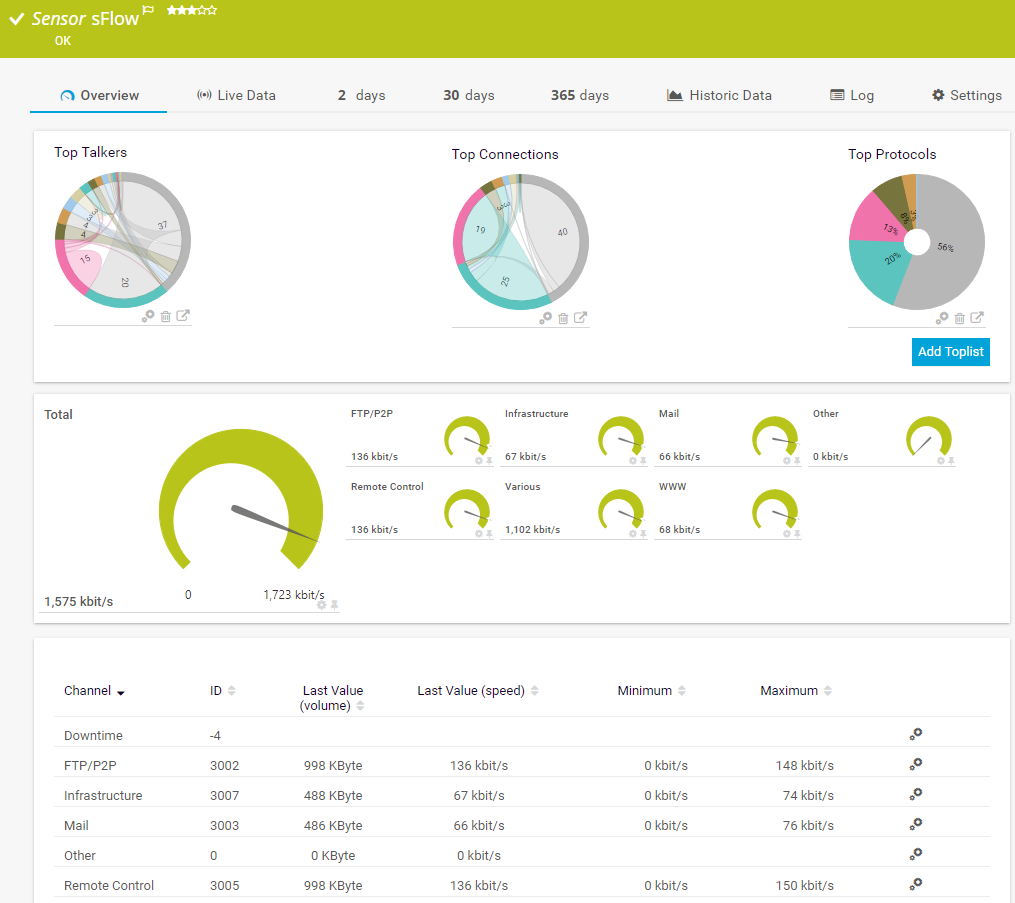
O sensor sFlow recebe dados de tráfego de um dispositivo compatível com sFlow v5 e mostra o tráfego por tipo. Esse sensor tem várias opções de filtro para dividir o tráfego em diferentes canais. Ele pode mostrar o seguinte e muito mais:
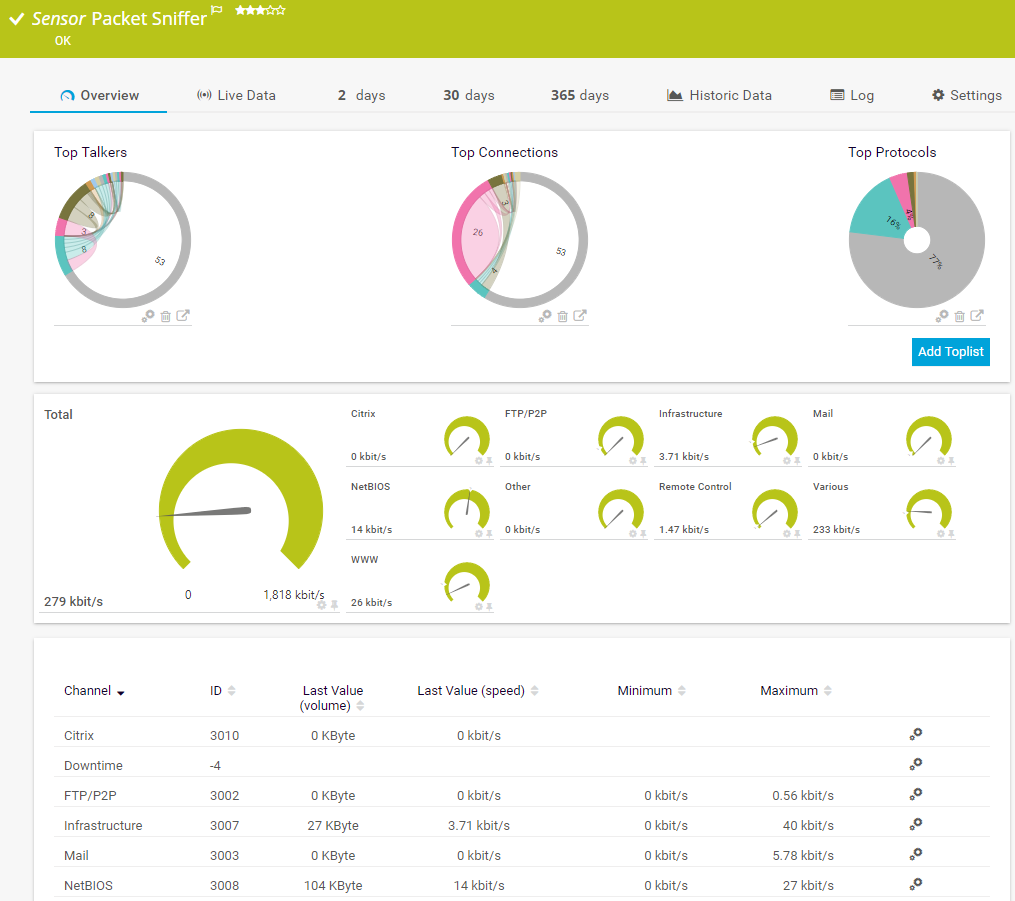
O sensor Sniffer de pacotes monitora os cabeçalhos dos pacotes de dados que passam por uma placa de rede local usando um sniffer de pacotes integrado. Você pode escolher entre canais predefinidos. Ele pode mostrar o seguinte e muito mais:
Consulte o Manual do PRTG para obter uma lista de todos os tipos de sensores disponíveis.

Os alertas personalizados e a visualização de dados permitem que você identifique e evite rapidamente a baixa largura de banda e outros problemas de desempenho da rede.
O PRTG é configurado em questão de minutos e pode ser usado em uma ampla variedade de dispositivos móveis.

Em parceria com fornecedores de TI inovadores, a Paessler libera sinergias para criar benefícios novos e adicionais para os clientes associados.
A baramundi e o PRTG criam uma infraestrutura de TI segura, confiável e poderosa, onde você tem tudo sob controle - desde o tráfego no seu firewall até a configuração dos seus clientes.
A integração dos resultados de monitoramento do PRTG aos mapas do NetBrain constitui a base para a automação da rede.
Combine o monitoramento de tudo do PRTG com as percepções profundas do SQmediator em sua infraestrutura de comunicações para garantir e melhorar a planta de comunicações da sua empresa e as habilidades de solução de problemas.
As notificações em tempo real significam uma solução de problemas mais rápida para que você possa agir antes que ocorram problemas mais sérios.
Software de monitoramento de rede – Versão 26.1.116.1532 (February 9th, 2026)
Download para Windows e versão baseada em nuvem do PRTG Hosted Monitor disponível
Inglês, alemão, espanhol, francês, português, holandês, russo, japonês e chinês simplificado
Dispositivos de rede, largura de banda, servidores, aplicativos, ambientes virtuais, sistemas remotos, IoT e muito mais
Escolha a assinatura do PRTG Network Monitor que é melhor para você


Uma verificação de largura de banda é um processo ou teste usado para medir a taxa de transferência de dados de uma conexão com a Internet. A TI avalia a quantidade de dados que pode ser transmitida por uma conexão de rede em um determinado período de tempo. Veja a seguir os principais aspectos envolvidos em uma verificação de largura de banda:
Verificar a largura de banda da rede é importante por vários motivos, garantindo que sua conexão com a Internet atenda às suas necessidades e opere com eficiência. Aqui estão alguns dos principais motivos pelos quais você deve verificar regularmente a largura de banda da sua rede:
1. Monitoramento do desempenho
2. Solução de problemas
3. Otimização do uso
4. Qualidade de serviço (QoS)
5. Segurança
O PRTG pode monitorar vários tipos de tráfego, incluindo HTTP, FTP, VoIP e muito mais. Usamos NetFlow, sFlow, jFlow, IPFIX e sniffing de pacotes para fornecer uma análise detalhada do tráfego.
De fato, ele o faz. O PRTG monitora efetivamente ambientes físicos, virtuais e de nuvem, fornecendo uma visão abrangente do uso da largura de banda de toda a sua rede.
Sim, os recursos detalhados de monitoramento e relatórios do PRTG podem ajudar a atender a vários requisitos de conformidade, fornecendo documentação completa das atividades e do desempenho da largura de banda da rede.
Sim, o PRTG pode identificar dispositivos ou aplicativos que estão consumindo muita largura de banda.
Sim, o PRTG armazena dados históricos, permitindo que você analise as tendências de uso da largura de banda ao longo do tempo.
No PRTG, “sensores” são os elementos básicos de monitoramento. Um sensor geralmente monitora um valor medido na sua rede, por exemplo, o tráfego em uma porta de switch, a carga de CPU de um servidor ou o espaço livre em uma unidade de disco. Em média, você precisa de 5-10 sensores por dispositivo ou um sensor por porta de switch.
A Paessler realizou testes em mais de 600 departamentos de TI em todo o mundo para sintonizar seu software de monitoramento de rede mais próximo às necessidades dos administradores. O resultado da pesquisa: mais de 95% dos participantes recomendaria PRTG – ou já o fizeram.

Paessler PRTG é usado por empresas de todos os tamanhos. Os administradores adoram PRTG porque ele facilita muito o trabalho.
Largura de banda, servidores, ambientes virtuais, websites, serviços VoIP – PRTG monitora toda a sua rede.
As necessidades de monitoramento variam. Por isso deixamos você experimentar PRTG gratuitamente. Comece agora mesmo o seu período de testes.