Os alertas personalizados e a visualização de dados permitem que você identifique e evite rapidamente a sobrecarga da rede e possíveis gargalos.
Ao filtrar e analisar o tráfego de sua rede usando o jFlow, o PRTG da Paessler o ajuda das seguintes maneiras:

o monitoramento do jFlow com o PRTG é caracterizado pelo uso mínimo de largura de banda, bem como por um alto grau de detalhe, e é especialmente adequado para redes de alto tráfego.
Diagnostique problemas de rede rastreando continuamente a utilização da largura de banda em seus roteadores e switches, bem como em toda a sua infraestrutura de TI. Mostre dados de tráfego baseados em fluxo filtrados por endereço IPS, porta e aplicativo, além de outras métricas importantes em tempo real. Visualize os dados de monitoramento em gráficos e painéis claros para identificar problemas com mais facilidade. Obtenha a Visão Geral necessária para solucionar problemas de desempenho de sua rede.

Visualização em árvore de dispositivos da configuração completa de monitoramento

Painel PRTG personalizado para manter um olho em toda a infraestrutura de TI

Gráfico de dados de tráfego ao vivo no PRTG
“Ganha tudo monitor
de rede”
“A verdadeira beleza do PRTG são as infinitas possibilidades que oferece”
“O PRTG Network Monitor é muito difícil de ser superado”
Durante o monitoramento da largura de banda por meio do protocolo jFlow, o roteador ou switch coleta pacotes de dados e os agrupa em fluxos. Essas informações sobre os fluxos são enviadas ao PRTG via UDP.
Você pode classificar o fluxo automaticamente por tipo de tráfego (correio, FTP ou WWW) e usá-lo para processamento e visualização estatística. Isso permite que você veja imediatamente quais aplicativos e dispositivos usam a largura de banda na rede.
Você também pode minimizar a largura de banda e o uso da CPU ativando a amostragem (se o seu roteador suportar) para que apenas cada n-ésimo pacote de dados seja enviado ao PRTG.
Você detecta os originadores do tráfego de dados em sua rede, classificados por IPS de remetente/destino, porta de remetente/destino, protocolo IP e tipo de serviço.
A apresentação visual dos dados de monitoramento nas chamadas listas principais fornece condições adicionais de análise ideais. O PRTG o alertará imediatamente sobre aumentos repentinos no uso da largura de banda de um determinado endereço de rede ou aplicativo.
O PRTG vem com mais de 250 tipos de sensores nativos para monitorar todo o seu ambiente local, na nuvem e na nuvem híbrida. Confira alguns exemplos abaixo!
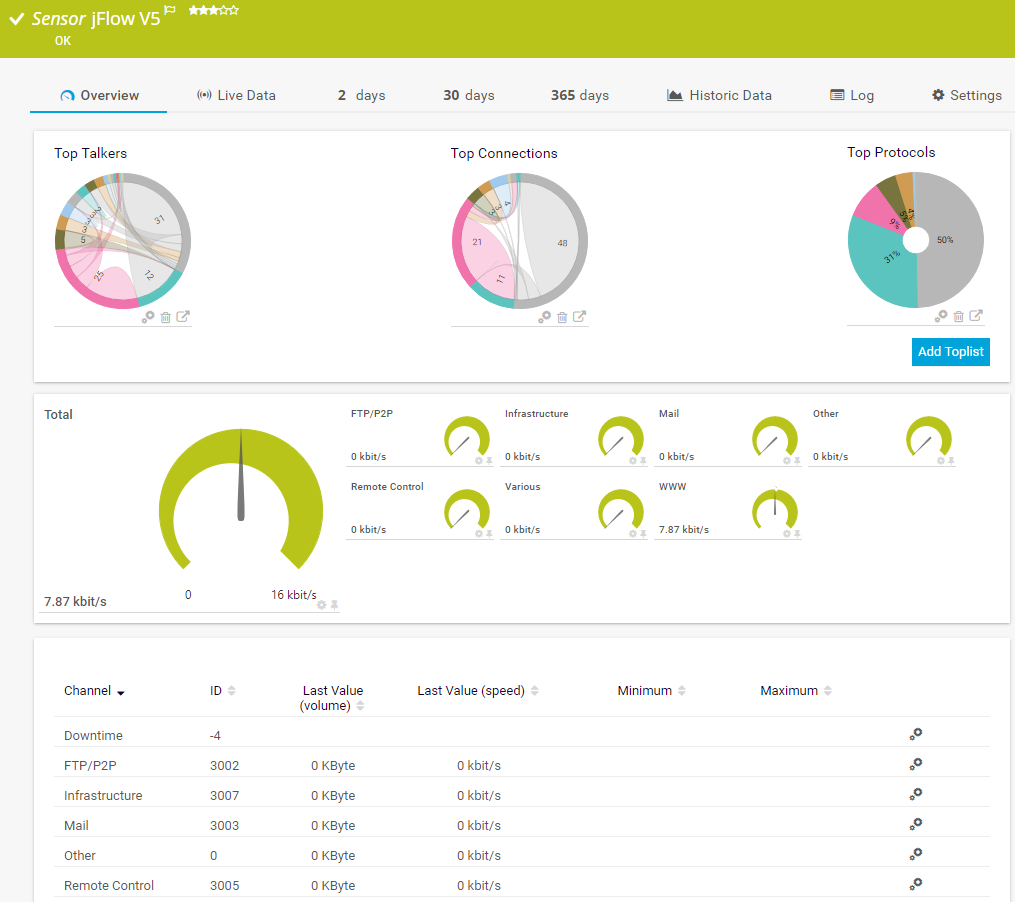
O sensor jFlow v5 recebe dados de tráfego de um dispositivo compatível com o jFlow v5 e mostra o tráfego por tipo. Ele pode mostrar o seguinte e muito mais:
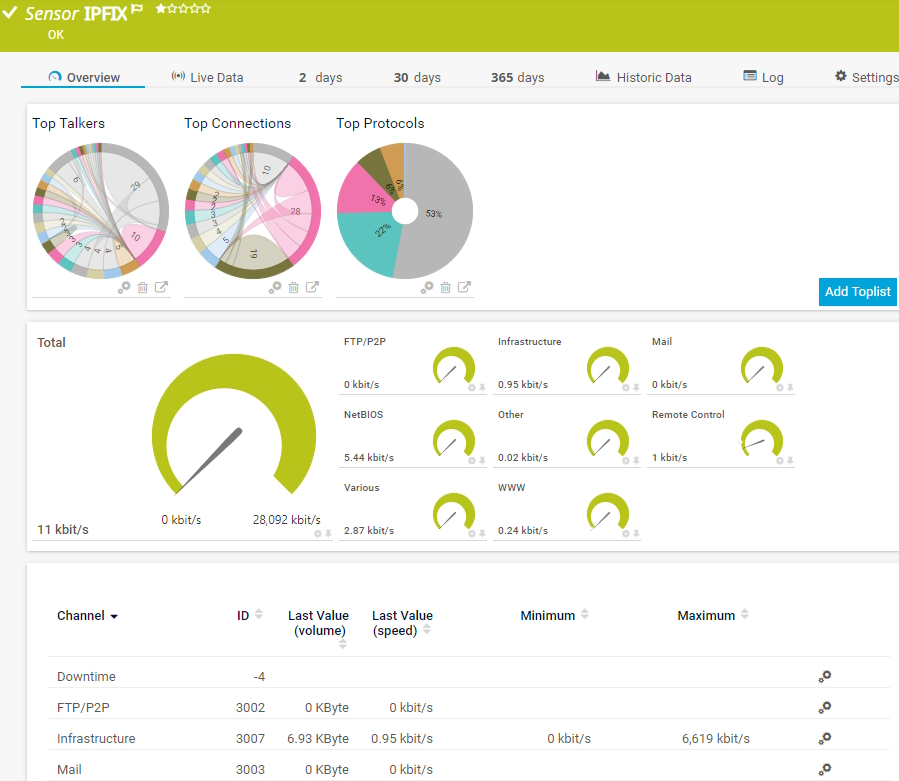
O sensor IPFIX recebe dados de tráfego de um dispositivo compatível com o IPFIX (Internet Protocol Flow Information Export) e mostra o tráfego por tipo. Ele pode mostrar o seguinte e muito mais:
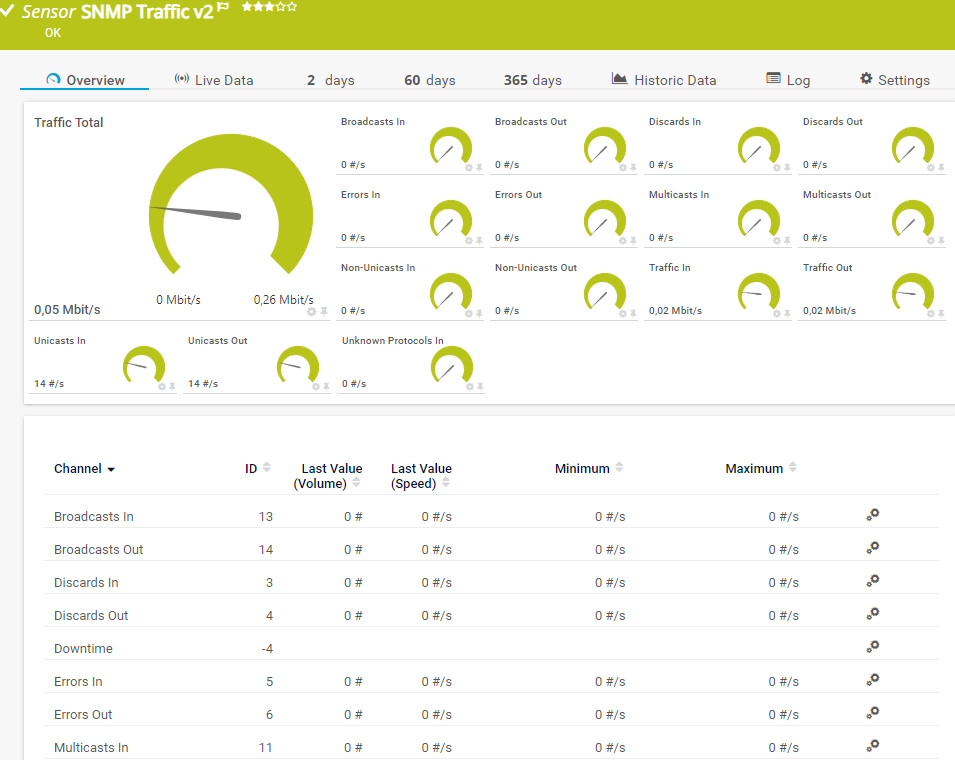
O sensor Tráfego (SNMP) v2 monitora a largura de banda e o tráfego em um dispositivo. Ele pode mostrar o seguinte:
Consulte o Manual do PRTG para obter uma lista de todos os tipos de sensores disponíveis.

Os alertas personalizados e a visualização de dados permitem que você identifique e evite rapidamente a sobrecarga da rede e possíveis gargalos.
O PRTG é configurado em questão de minutos e pode ser usado em uma ampla variedade de dispositivos móveis.


“Excelente ferramenta para monitoramento detalhado. Alarmes e notificações funcionam muito bem. A adição de equipamentos é simples e a configuração inicial do servidor é bem fácil. ...sinta-se tranquilo em comprá-lo se você pretende monitorar um grande cenário de rede.”
Em parceria com fornecedores de TI inovadores, a Paessler libera sinergias para criar benefícios novos e adicionais para os clientes associados.
A Paessler e a Plixer fornecem uma solução completa, acrescentando análise de fluxo e metadados a uma poderosa ferramenta de monitoramento de rede.
A TI que funciona constitui uma base essencial para o sucesso de uma empresa. A disponibilidade e a segurança devem ser definidas para a respectiva finalidade e monitoradas de perto, tanto pela OT quanto pela TI.
A Siemon e a Paessler reúnem tecnologia de construção inteligente e monitoramento avançado e tornam realidade sua visão de edifícios e data centers inteligentes.
As notificações em tempo real significam uma solução de problemas mais rápida para que você possa agir antes que ocorram problemas mais sérios.
Software de monitoramento de rede – Versão 26.1.116.1532 (February 9th, 2026)
Download para Windows e versão baseada em nuvem do PRTG Hosted Monitor disponível
Inglês, alemão, espanhol, francês, português, holandês, russo, japonês e chinês simplificado
Dispositivos de rede, largura de banda, servidores, aplicativos, ambientes virtuais, sistemas remotos, IoT e muito mais
Escolha a assinatura do PRTG Network Monitor que é melhor para você


o jFlow é um protocolo de monitoramento de fluxo desenvolvido pela Juniper Networks. TI é usado para coletar e analisar o tráfego de rede monitorando os fluxos que passam por um dispositivo de rede, como um roteador ou switch. Um "fluxo" refere-se a uma série de pacotes com atributos compartilhados, como IPS de origem/destino, números de porta e tipos de protocolo. Os recursos incluem:
A principal diferença entre o jFlow, o sFlow e o NetFlow está em suas origens, nos métodos de implementação e na forma como coletam e analisam os dados de fluxo de rede.
O NetFlow e o jFlow funcionam capturando dados de fluxo completos para fluxos de tráfego (por exemplo, IPs de origem/destino, portas, protocolos). Normalmente, eles não se baseiam em amostras, o que significa que podem fornecer percepções detalhadas, mas podem consumir mais recursos. O sFlow usa amostragem estatística, capturando apenas uma fração dos pacotes ou fluxos. Isso significa que ele fornece percepções menos detalhadas, mas com uso eficiente de recursos, o que o torna escalável para redes de alta velocidade.
o monitoramento do jFlow refere-se ao processo de observação e análise do tráfego de rede usando o protocolo jFlow, que é a tecnologia de monitoramento de fluxo da Juniper Networks. A TI permite que os administradores de rede obtenham insights sobre a atividade da rede, coletando e analisando dados sobre os fluxos de pacotes que passam pelos dispositivos da Juniper, como roteadores e switches.
Os coletores de fluxo e as ferramentas de análise, como o PRTG, analisam os dados para gerar relatórios e visualizações, fornecendo informações sobre padrões de tráfego, uso da largura de banda, desempenho de aplicativos e possíveis ameaças à segurança.
O PRTG coleta e mostra os seguintes dados ao usar o jFlow para monitoramento:
No PRTG, “sensores” são os elementos básicos de monitoramento. Um sensor geralmente monitora um valor medido na sua rede, por exemplo, o tráfego em uma porta de switch, a carga de CPU de um servidor ou o espaço livre em uma unidade de disco. Em média, você precisa de 5-10 sensores por dispositivo ou um sensor por porta de switch.
A Paessler realizou testes em mais de 600 departamentos de TI em todo o mundo para sintonizar seu software de monitoramento de rede mais próximo às necessidades dos administradores. O resultado da pesquisa: mais de 95% dos participantes recomendaria PRTG – ou já o fizeram.

Paessler PRTG é usado por empresas de todos os tamanhos. Os administradores adoram PRTG porque ele facilita muito o trabalho.
Largura de banda, servidores, ambientes virtuais, websites, serviços VoIP – PRTG monitora toda a sua rede.
As necessidades de monitoramento variam. Por isso deixamos você experimentar PRTG gratuitamente. Comece agora mesmo o seu período de testes.