Gli avvisi personalizzati e la visualizzazione dei dati consentono di identificare e prevenire rapidamente i problemi di rete causati da dispositivi non disponibili.
La vostra rete è un campo di battaglia e, che vi piaccia o no, siete il generale incaricato di vincere la guerra contro tutto ciò che mette a rischio la vostra infrastruttura. Sempre all'erta, individuate un nemico mortale: l'alta latenza del ping. Prendete la vostra arma più potente: il PRTG di Paessler. IT osserva il nemico e riferisce ogni sua mossa. Conducendo continui test di ping e latenza su vari indirizzi IPS, PRTG vi aiuta a identificare i cattivi attori prima che facciano crollare le mura della vostra rete.
Diagnosticare i problemi di rete monitorando continuamente la latenza media e i tempi di risposta con il ping. Mostra l'utilizzo della larghezza di banda, la perdita di pacchetti, il jitter, i tempi di carico e altre metriche chiave in tempo reale. Visualizzate i dati di monitoraggio in grafici e dashboard chiari per identificare più facilmente i problemi. Ottenete la Panoramica necessaria per risolvere i problemi di rete causati da latenza elevata e dispositivi di rete poco reattivi.

Albero dei dispositivi dell'intera configurazione di monitoraggio

Dashboard PRTG personalizzato per tenere sotto controllo l'intera infrastruttura IT

Grafico dei dati di traffico in tempo reale in PRTG
“Monitor di rete vincente sotto tutti i punti di vista”
“La vera bellezza di PRTG sta nelle infinite possibilità che offre”
“PRTG Network Monitor
è molto difficile da superare”
PRTG Network Monitor offre una soluzione di monitoraggio della rete completa che va oltre i controlli di base della latenza.
Dall'utilizzo della larghezza di banda al tempo di attività, è il vostro centro di comando per la gestione della rete, come un arsenale ben attrezzato per la vostra infrastruttura IT.
Impostate le vostre soglie di latenza, perdita di pacchetti e altro ancora. Il sistema di allerta flessibile di PRTG garantisce la ricezione di notifiche solo quando è importante, riducendo le distrazioni inutili.
IT è preciso come il coordinamento di un attacco tattico e garantisce che siate avvisati dei problemi che richiedono attenzione immediata.
Nonostante le sue funzioni avanzate, PRTG è facile da usare. Che si tratti di monitorare tramite UPS (alimentazione elettrica ininterrotta), WMI, SSH, TCP o di impostare complesse regole di avviso, l'interfaccia è intuitiva come un piano di battaglia ben disegnato.
Indipendentemente dal fatto che si tratti di sistemi Windows o Linux o che si gestisca una serie di dispositivi diversi, PRTG rende la gestione della rete un'esperienza senza soluzione di continuità.
Grazie al supporto di varie API e strumenti di terze parti, PRTG si integra senza problemi nel flusso di lavoro esistente. Automatizza le risposte a determinate condizioni di rete, rendendo le difese della rete efficienti come una macchina ben oliata.
Questo livello di automazione consente di allocare le risorse in modo più efficace, concentrandosi sull'innovazione piuttosto che sulla lotta agli incendi.
PRTG è dotato di oltre 250 tipi di sensori nativi per il monitoraggio dell'intero ambiente on-premises, cloud e cloud ibrido. Dai un'occhiata ad alcuni esempi qui sotto!
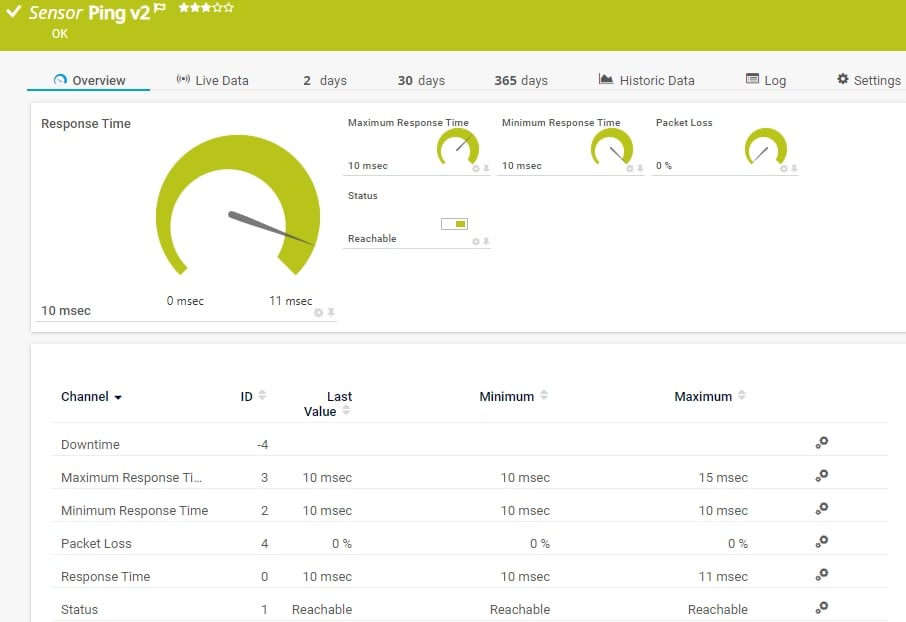
Il sensore Ping v2 invia una richiesta di eco ICMP (Internet Control Message Protocol) (“ping”) dal sistema sonda al dispositivo principale per monitorarne la disponibilità. Può mostrare quanto segue:
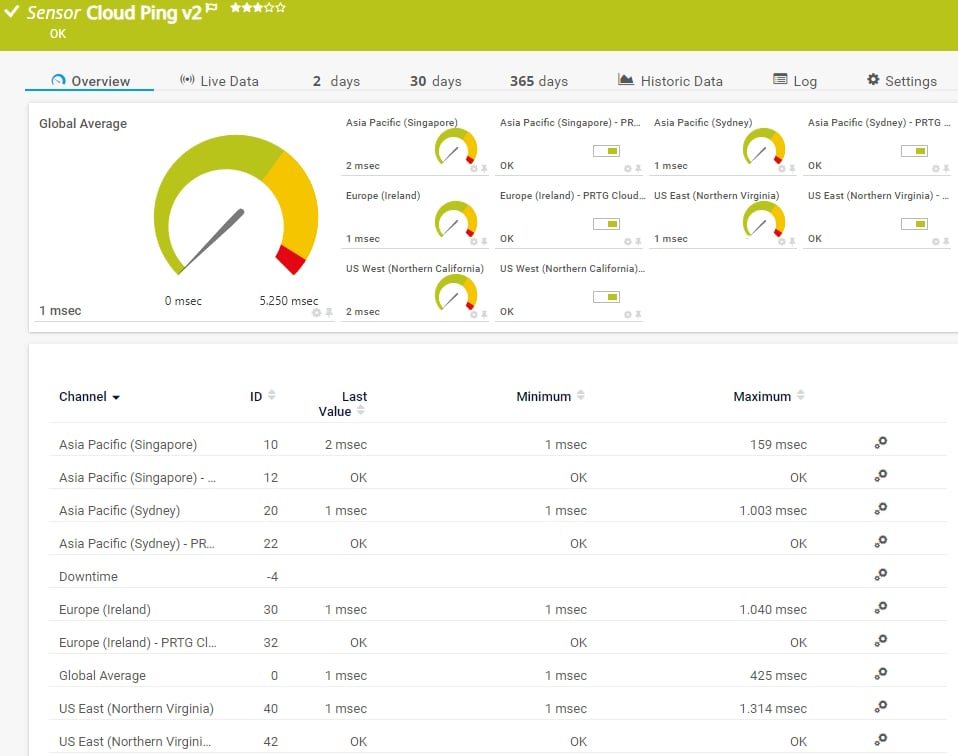
Il sensore Cloud Ping v2 monitora i tempi di ping del Transmission Control Protocol (TCP) verso il suo dispositivo madre da diverse località del mondo (Asia Pacifico: Singapore, Asia Pacifico: Sydney, Europa: Irlanda, Stati Uniti Est: Virginia del Nord, Stati Uniti Ovest: California settentrionale) tramite PRTG Cloud. Può mostrare i seguenti dati:
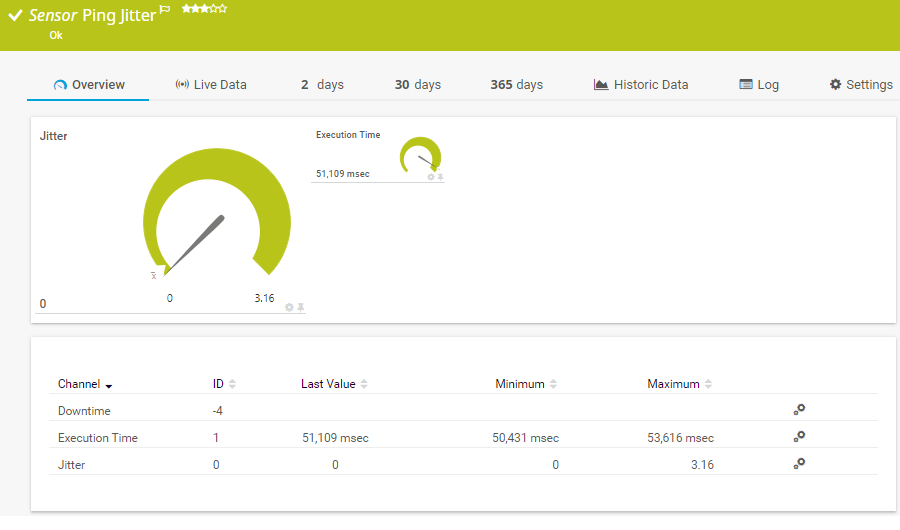
Il sensore Ping Jitter invia una serie di richieste di eco ICMP (Internet Control Message Protocol) a un URI per determinare il jitter statistico. Può mostrare quanto segue:
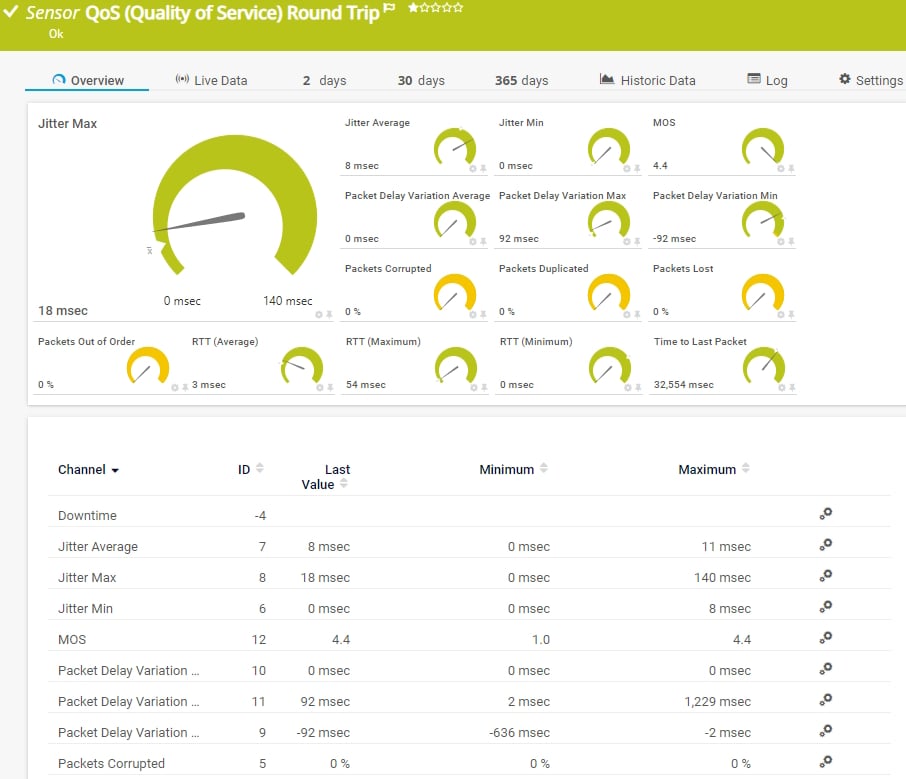
Il sensore QoS (Quality of Service) Round Trip monitora i parametri relativi alla qualità della connessione di rete tra due sonde. Può mostrare quanto segue:
Consulta il manuale di PRTG per un elenco di tutti i tipi di sensore disponibili.

Gli avvisi personalizzati e la visualizzazione dei dati consentono di identificare e prevenire rapidamente i problemi di rete causati da dispositivi non disponibili.
PRTG si configura in pochi minuti e può essere utilizzato su un'ampia gamma di dispositivi mobili.


“Eccellente strumento per un monitoraggio dettagliato. Gli avvisi e le notifiche funzionano perfettamente. L'aggiunta dei dispositivi è intuitiva e la configurazione iniziale del server è molto semplice. ...acquistatelo tranquillamente se desiderate monitorare un vasto panorama di rete.”
Grazie alla collaborazione con fornitori IT innovativi, Paessler libera sinergie per creare nuovi e ulteriori vantaggi per i suoi clienti.
L'IT che funziona costituisce una base critica per il successo di un'azienda. La disponibilità e la sicurezza devono essere definite per il rispettivo scopo e monitorate attentamente, sia da parte dell'OT che dell'IT.
L'integrazione dei risultati del monitoraggio di PRTG nelle mappe di NetBrain costituisce la base per l'automazione della rete.
Con ScriptRunner Paessler integra una potente piattaforma di automazione degli eventi in PRTG Network Monitor.
Notifiche in tempo reale significano una risoluzione più rapida dei problemi, in modo da poter intervenire prima che si verifichino problemi più gravi.
Software di monitoraggio della rete – Versione 26.1.116.1532 (February 9th, 2026)
Disponibile il download della versione per Windows e della versione cloud-based PRTG Hosted Monitor
Inglese, tedesco, spagnolo, francese, portoghese, olandese, russo, giapponese e cinese semplificato
Dispositivi di rete, larghezza di banda, server, applicazioni, ambienti virtuali, sistemi remoti, IoT e molto altro
Scegli l'abbonamento a PRTG Network Monitor più adatto a te


PRTG utilizza il protocollo ICMP per inviare richieste di eco (comandi ping) a indirizzi IP specificati e attende le risposte. In questo modo si misura il round trip time (RTT), fornendo informazioni in tempo reale sulla latenza della rete. È come inviare esploratori e cronometrare il loro ritorno, assicurando che le linee di comunicazione siano chiare ed efficienti.
Il monitoraggio della latenza del ping è fondamentale per mantenere prestazioni di rete ottimali. Una latenza elevata può causare tempi di risposta lenti, aumento del jitter e persino tempi di inattività. Tenendo d'occhio le metriche di latenza, è possibile rilevare e risolvere i problemi prima che si ripercuotano sull'organizzazione, mantenendo le operazioni senza intoppi e la soddisfazione delle truppe, sia del personale che dei clienti.
Assolutamente sì. PRTG è in grado di monitorare la latenza dei vari servizi e provider cloud, garantendo l'affidabilità delle connessioni al cloud. Ciò consente di mantenere prestazioni ottimali per le applicazioni e i servizi basati sul cloud, estendendo la sorveglianza della rete a tutti i fronti del campo di battaglia digitale.
PRTG offre notifiche altamente personalizzabili. È possibile impostare più soglie per diverse metriche, come latenza, perdita di pacchetti e jitter, e definire azioni specifiche quando queste soglie vengono superate. È come impostare dei sistemi di allarme rapido che vi segnalano le potenziali minacce, consentendovi di reagire di conseguenza e di mantenere forti le vostre difese.
Sì, PRTG supporta il monitoraggio su diversi sistemi operativi, tra cui Windows, Linux e macOS. IT monitora anche un'ampia gamma di dispositivi di rete, da router e switch a server e virtual machine. Pensate a come dotare l'intero esercito degli strumenti necessari per operare in modo efficace, garantendo l'interoperabilità e la comunicazione continua tra tutte le unità.
PRTG fornisce strumenti come il traceroute e metriche dettagliate sui percorsi di rete, aiutandovi a individuare i problemi di latenza. Analizzando i dati da più punti, è possibile identificare se il problema risiede in endpoint, router o segmenti di rete specifici. È come avere rapporti di ricognizione che aiutano a individuare ed eliminare la fonte del problema in modo rapido ed efficiente.
In PRTG, i “sensori” sono gli elementi base del monitoraggio. Un sensore monitora solitamente un valore misurato nella tua rete (ad esempio, il traffico di una porta switch, il carico della CPU di un server o lo spazio libero di un’unità disco). In media, occorrono circa 5-10 sensori per ogni dispositivo o un sensore per ogni porta switch.
Paessler ha condotto prove in oltre 600 dipartimenti IT in tutto il mondo per mettere a punto il suo software di monitoraggio di rete più vicino alle esigenze dei sysadmin. Il risultato è che più del 95% degli intervistati consiglierebbe PRTG – o lo ha già fatto.

Paessler PRTG è utilizzato da aziende di tutte le dimensioni. Gli amministratori di sistema adorano PRTG perché rende il loro lavoro molto più semplice.
Ampiezza di banda, server, ambienti virtuali, siti Web, servizi VoIP - PRTG tiene d'occhio la tua intera rete.
Tutti hanno esigenze di monitoraggio diverse. Ecco perché ti lasciamo provare PRTG gratuitamente. Inizia oggi stesso la tua prova.