Gli avvisi personalizzati e le visualizzazioni dei dati consentono di identificare e prevenire rapidamente la congestione delle porte, le vulnerabilità della sicurezza e altri problemi di prestazioni della rete.
Email che non vengono inviate. Schermi bloccati. Connessioni interrotte.
Le porte sovraccariche o poco performanti causano ogni sorta di problemi fastidiosi e dirompenti. E questo prima ancora di parlare dei rischi per la sicurezza..
L'analizzatore di porte PRTG di Paessler utilizza SNMP per monitorare lo stato di salute di tutte le porte della rete, in modo da poter prevenire le interruzioni, mantenere la produttività dei colleghi e bloccare i malintenzionati dalla rete.

Gestite la rete e la comunicazione tra tutti gli elementi dell'infrastruttura in modo più efficace. PRTG lavora instancabilmente in background, monitorando le statistiche chiave e facendovi sapere che una porta è prossima al sovraccarico prima che ciò accada realmente, in modo da poter prevenire le interruzioni.
Con tante cose da fare, i problemi di sicurezza potenzialmente critici possono facilmente passare inosservati. PRTG tiene sotto controllo le porte di switch, router, server e altre infrastrutture di rete, individuando i punti deboli, come le porte aperte, prima che i malintenzionati possano sfruttarli.
Per impostazione predefinita, PRTG memorizza i dati grezzi per un anno. Ciò significa che è possibile andare indietro fino a quando è necessario per individuare l'inizio di un problema. Inoltre, è possibile individuare le tendenze e intraprendere azioni proattive. Ad esempio, per evitare di ritrovarsi con troppi dispositivi e poche porte.
Diagnosticare i problemi di rete monitorando continuamente le porte della rete. Mostra lo stato delle porte, la velocità di trasferimento dei dati e altre metriche chiave in tempo reale. Visualizzate i dati di monitoraggio in grafici e dashboard chiari per identificare più facilmente i problemi. Ottenete la Panoramica necessaria per risolvere problemi di velocità, vulnerabilità di sicurezza e altri problemi di prestazioni di rete.

Albero dei dispositivi dell'intera configurazione di monitoraggio

Dashboard PRTG personalizzato per tenere sotto controllo l'intera infrastruttura IT

Grafico dei dati di traffico in tempo reale in PRTG
“Monitor di rete vincente sotto tutti i punti di vista”
“La vera bellezza di PRTG sta nelle infinite possibilità che offre”
“PRTG Network Monitor
è molto difficile da superare”
PRTG è dotato di oltre 250 tipi di sensori nativi per il monitoraggio dell'intero ambiente on-premises, cloud e cloud ibrido. Dai un'occhiata ad alcuni esempi qui sotto!
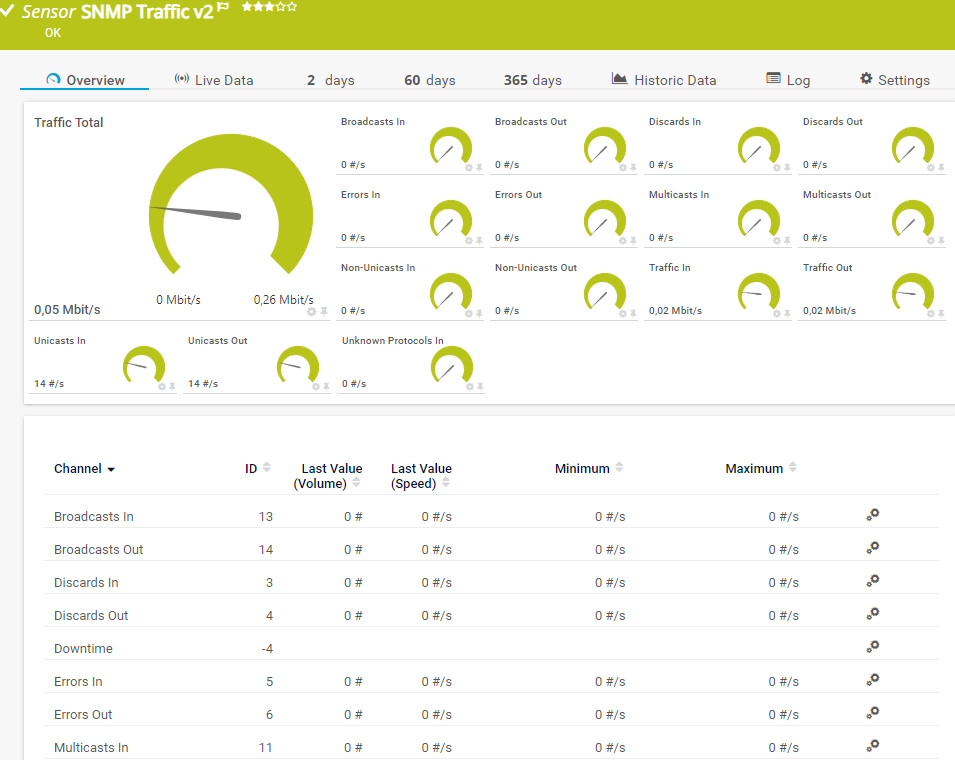
Il sensore SNMP Traffic v2 monitora la larghezza di banda e il traffico di un dispositivo. Può mostrare quanto segue:
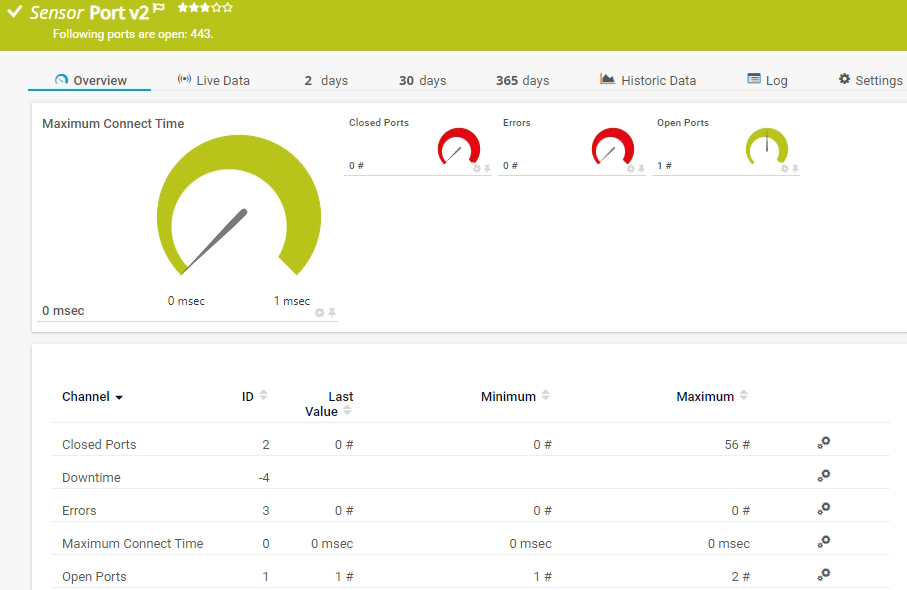
Il sensore Port v2 monitora un servizio di rete collegandosi a una o più porte TCP/IP. Può mostrare quanto segue:
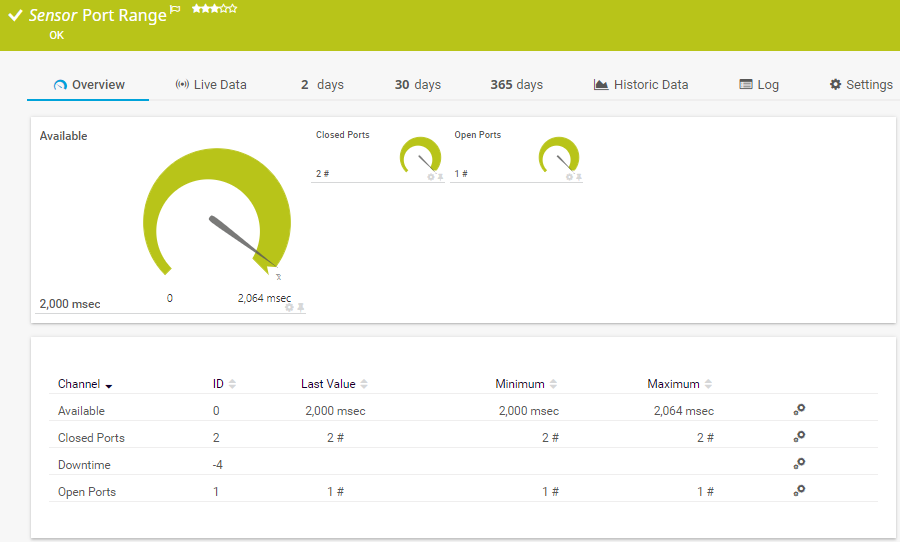
Il sensore Port Range monitora un servizio di rete collegandosi a varie porte TCP/IP. Cerca di connettersi in successione ai numeri di porta TCP/IP specificati di un dispositivo e attende che il dispositivo accetti ogni richiesta. Può mostrare quanto segue:
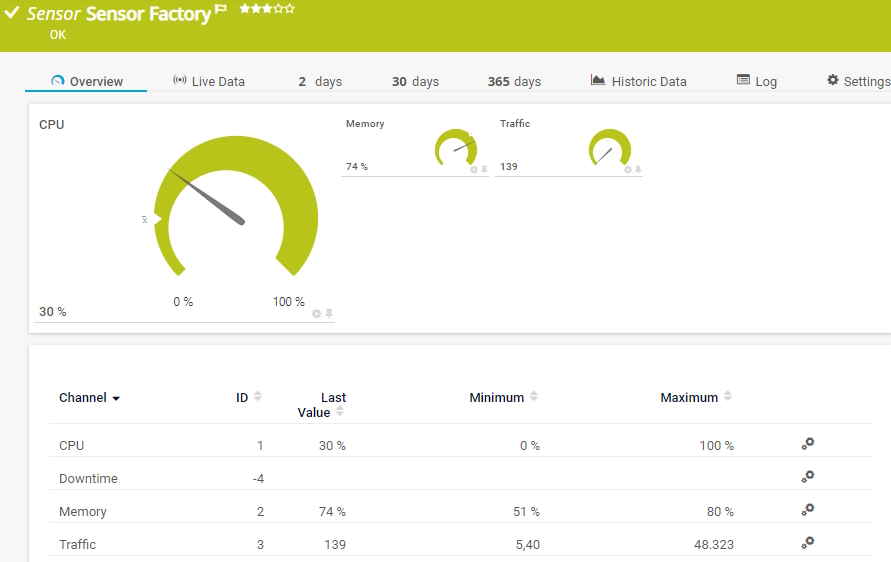
Il Sensor Factory monitora interi processi aziendali che coinvolgono diversi componenti. È possibile creare un sensore personalizzato con canali basati sui dati di altri sensori. Può mostrare quanto segue:
Consulta il manuale di PRTG per un elenco di tutti i tipi di sensore disponibili.

Gli avvisi personalizzati e le visualizzazioni dei dati consentono di identificare e prevenire rapidamente la congestione delle porte, le vulnerabilità della sicurezza e altri problemi di prestazioni della rete.
Configurate PRTG in pochi minuti e utilizzatelo su quasi tutti i dispositivi mobili.


“Eccellente strumento per un monitoraggio dettagliato. Gli avvisi e le notifiche funzionano perfettamente. L'aggiunta dei dispositivi è intuitiva e la configurazione iniziale del server è molto semplice. ...acquistatelo tranquillamente se desiderate monitorare un vasto panorama di rete.”
Grazie alla collaborazione con fornitori IT innovativi, Paessler libera sinergie per creare nuovi e ulteriori vantaggi per i suoi clienti.
Integrando PRTG con Martello iQ, puoi aggiungere un livello di analisi veloce per migliorare i tempi di attività, visualizzare il tuo ambiente IT e integrare tutti i tuoi sistemi IT in un unico pannello di vetro.
L'integrazione dei risultati del monitoraggio di PRTG nelle mappe di NetBrain costituisce la base per l'automazione della rete.
Siemon e Paessler uniscono la tecnologia degli edifici intelligenti e il monitoraggio avanzato e fanno sì che la tua visione di edifici e data center intelligenti diventi realtà.
Notifiche in tempo reale significano una risoluzione più rapida dei problemi, in modo da poter intervenire prima che si verifichino problemi più gravi.
Software di monitoraggio della rete – Versione 26.1.116.1532 (February 9th, 2026)
Disponibile il download della versione per Windows e della versione cloud-based PRTG Hosted Monitor
Inglese, tedesco, spagnolo, francese, portoghese, olandese, russo, giapponese e cinese semplificato
Dispositivi di rete, larghezza di banda, server, applicazioni, ambienti virtuali, sistemi remoti, IoT e molto altro
Scegli l'abbonamento a PRTG Network Monitor più adatto a te


Le porte sono endpoint che facilitano il dialogo tra i diversi processi e servizi della rete. Quando le porte funzionano come dovrebbero, i dati fluiscono liberamente e la rete funziona senza problemi. Ma quando le porte sono mal configurate o presentano altri problemi, possono rallentare la rete e renderla più vulnerabile ai trojan e ad altri rischi per la sicurezza.
Il protocollo SNMP (Simple Network Management Protocol) è un protocollo standard utilizzato per gestire e monitorare dispositivi di rete come router, switch, server, stampanti e altro hardware collegato a una rete. SNMP consente agli amministratori di rete di monitorare in remoto le prestazioni dei dispositivi, di raccogliere e analizzare i dati e persino di modificare le configurazioni di questi dispositivi per garantire il funzionamento regolare ed efficiente della rete.
I componenti chiave di SNMP includono:
SNMP consente diverse operazioni chiave:
Versioni di SNMP:
Esistono tre versioni principali di SNMP, ognuna delle quali offre diversi livelli di sicurezza e funzionalità.
Il monitoraggio delle porte è una sorta di sorveglianza, mentre la scansione delle porte è un'ispezione. Uno strumento di monitoraggio delle porte aiuta a monitorare le prestazioni generali e a identificare le tendenze a lungo termine. Uno scanner di porte, invece, consente di individuare le minacce potenzialmente imminenti, come i numeri di porta aperti quando dovrebbero essere chiusi.
L'analizzatore di porte SNMP di PRTG raccoglie continuamente informazioni sulle porte della rete eseguendo il polling delle metriche SNMP. IT è in grado di identificare quante porte sono aperte, quante sono chiuse, quali dispositivi, applicazioni o altri servizi sono collegati ad esse e il tempo di risposta di ogni porta.
Il monitoraggio delle porte tramite il Simple Network Management Protocol (SNMP) prevede la configurazione di SNMP sui dispositivi di rete e l'utilizzo di uno strumento di analisi delle porte SNMP per raccogliere e analizzare i dati. Ecco i passaggi generali per monitorare le porte tramite SNMP:
2. Identificare gli OID per il monitoraggio delle porte:
3. Impostare PRTG come analizzatore di porte SNMP:
In PRTG, i “sensori” sono gli elementi base del monitoraggio. Un sensore monitora solitamente un valore misurato nella tua rete (ad esempio, il traffico di una porta switch, il carico della CPU di un server o lo spazio libero di un’unità disco). In media, occorrono circa 5-10 sensori per ogni dispositivo o un sensore per ogni porta switch.
Paessler ha condotto prove in oltre 600 dipartimenti IT in tutto il mondo per mettere a punto il suo software di monitoraggio di rete più vicino alle esigenze dei sysadmin. Il risultato è che più del 95% degli intervistati consiglierebbe PRTG – o lo ha già fatto.

Paessler PRTG è utilizzato da aziende di tutte le dimensioni. Gli amministratori di sistema adorano PRTG perché rende il loro lavoro molto più semplice.
Ampiezza di banda, server, ambienti virtuali, siti Web, servizi VoIP - PRTG tiene d'occhio la tua intera rete.
Tutti hanno esigenze di monitoraggio diverse. Ecco perché ti lasciamo provare PRTG gratuitamente. Inizia oggi stesso la tua prova.