Gli avvisi personalizzati e la visualizzazione dei dati consentono di identificare e prevenire rapidamente problemi di salute, prestazioni e sicurezza della rete.
Nell'intricata rete moderna, avere una comprensione dettagliata del traffico è fondamentale sia per le prestazioni che per la sicurezza. Paessler PRTG si distingue come analizzatore di protocollo per offrire una visibilità e un controllo completi sul traffico di rete, assicurando che la vostra infrastruttura funzioni in modo continuo e sicuro e mantenendo la vostra sanità mentale.
Il PRTG va oltre il monitoraggio di superficie offrendo funzionalità di ispezione profonda dei pacchetti e di monitoraggio dei flussi. Questa analisi avanzata dei protocolli consente di eliminare gli strati del traffico di rete in tempo reale, fornendo informazioni sull'utilizzo della larghezza di banda, sulle fonti di traffico e sulle potenziali minacce alla sicurezza.
Bastano pochissimi clic per arrivare al centro delle interruzioni del traffico. Grazie al supporto dei più diffusi protocolli di flusso come NetFlow, sFlow, jFlow e IPFIX, PRTG semplifica l'acquisizione e l'analisi dei pacchetti di dati sulla rete, garantendo che nessun dettaglio passi inosservato.
La flessibilità è fondamentale nella gestione della rete e PRTG offre una personalizzazione senza precedenti per l'analisi dei protocolli. La configurazione di monitoraggio può essere personalizzata come un abito nuovo, con sensori specifici per i protocolli più utilizzati, e le soglie di allarme possono essere adattate ai modelli di traffico della rete.
Questa personalizzazione vi garantisce di essere sempre i primi a conoscere i potenziali problemi, consentendovi di reagire rapidamente per mantenere l'integrità e le prestazioni della rete.
PRTG semplifica la complessa attività di analisi dei protocolli di rete fornendo un unico endpoint unificato per tutte le esigenze di monitoraggio. L'approccio onnicomprensivo di PRTG elimina la necessità di utilizzare più strumenti, riducendo i problemi di compatibilità e le vulnerabilità di sicurezza.
Inoltre, l'architettura sicura di PRTG, che include comunicazioni crittografate, garantisce la sicurezza e la riservatezza dei dati di rete.
Con PRTG, la rete può essere monitorata utilizzando un'ampia gamma di protocolli, garantendo una copertura completa e approfondimenti.
Da HTTP a SNMP, da WMI a UDP a SSH, il nostro software di packet sniffer e analizzatore di protocolli è in grado di fornire analisi dettagliate che aiutano a ottimizzare le prestazioni, a risolvere i problemi e a proteggere la rete dalle minacce.
Diagnostica i problemi di rete tracciando continuamente il traffico di rete nella LAN basata su Ethernet o nella rete wireless utilizzando diversi protocolli. Mostra i modelli di traffico, l'utilizzo della larghezza di banda, i pacchetti di dati catturati e altre metriche chiave delle prestazioni in tempo reale. Visualizzate i dati di monitoraggio in grafici e dashboard chiari per identificare più facilmente i problemi. Ottenere la Panoramica necessaria per la risoluzione dei problemi e il debug dei problemi con la cattura dei pacchetti di rete, il comportamento irregolare del traffico e i colli di bottiglia della larghezza di banda colli di bottiglia della larghezza di banda.

Albero dei dispositivi dell'intera configurazione di monitoraggio

Dashboard PRTG personalizzato per tenere sotto controllo l'intera infrastruttura IT

Grafico dei dati di traffico in tempo reale in PRTG
“Monitor di rete vincente sotto tutti i punti di vista”
“La vera bellezza di PRTG sta nelle infinite possibilità che offre”
“PRTG Network Monitor
è molto difficile da superare”
PRTG è dotato di oltre 250 tipi di sensori nativi per il monitoraggio dell'intero ambiente on-premises, cloud e cloud ibrido. Dai un'occhiata ad alcuni esempi qui sotto!
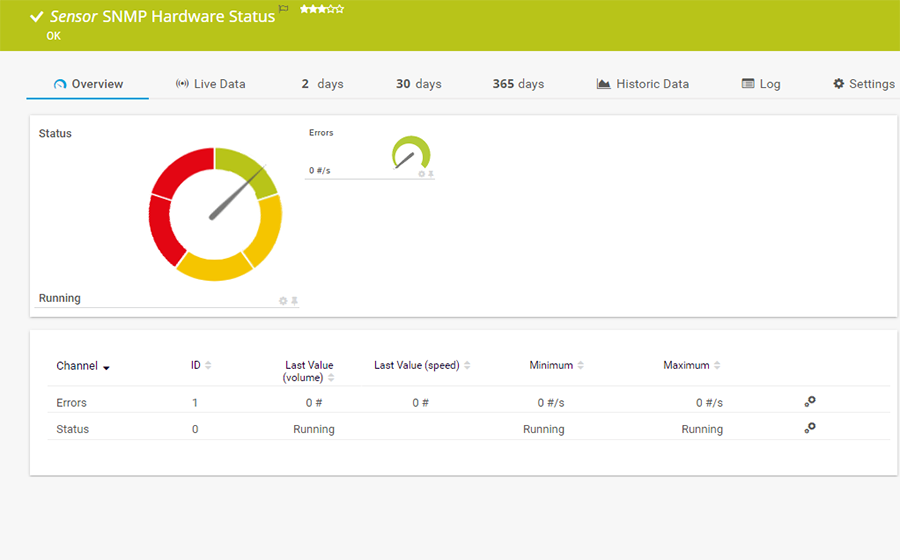
Il sensore SNMP Hardware Status monitora lo stato del componente hardware di un server. Può mostrare quanto segue:
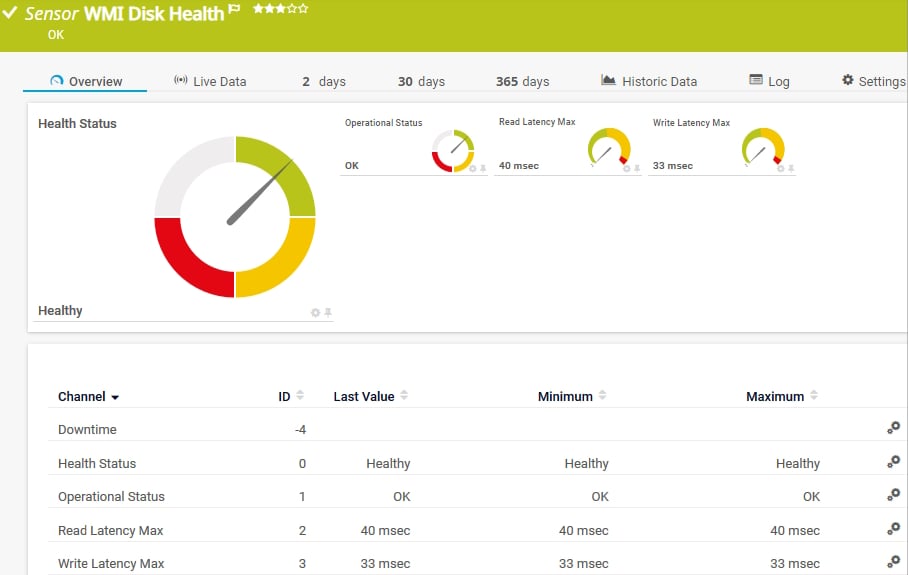
Il sensore WMI Disk Health monitora lo stato di salute di un disco fisico su un sistema Windows. Può mostrare quanto segue:
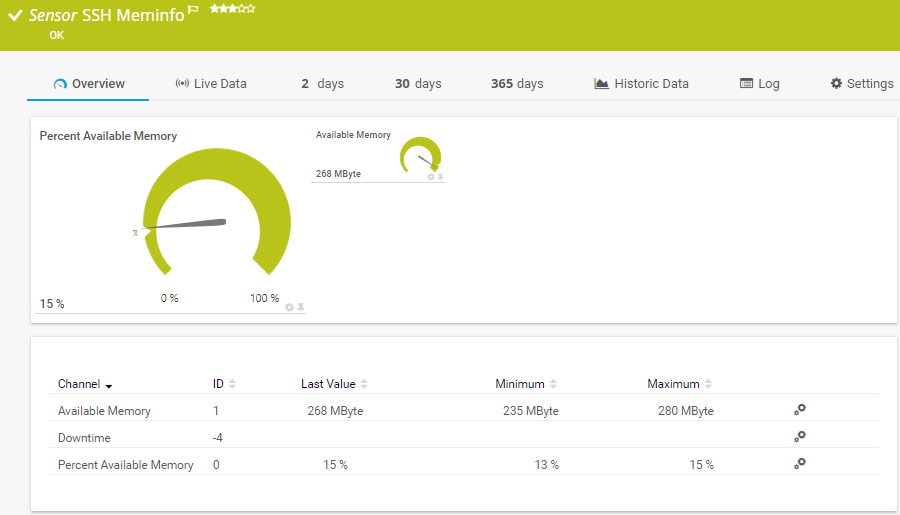
Il sensore SSH Meminfo monitora l'utilizzo della memoria di un sistema Linux/Unix utilizzando Secure Shell (SSH). Può mostrare quanto segue:
Il sensore HTTP Full Web Page monitora il tempo di download completo di una pagina web, comprese le risorse come le immagini. In background, apre la pagina web in un'istanza del browser per eseguire la misurazione. Può mostrare i seguenti dati:
Consulta il manuale di PRTG per un elenco di tutti i tipi di sensore disponibili.

Gli avvisi personalizzati e la visualizzazione dei dati consentono di identificare e prevenire rapidamente problemi di salute, prestazioni e sicurezza della rete.
Configurate il PRTG in pochi minuti e utilizzatelo su quasi tutti i dispositivi mobili.


“Eccellente strumento per un monitoraggio dettagliato. Gli avvisi e le notifiche funzionano perfettamente. L'aggiunta dei dispositivi è intuitiva e la configurazione iniziale del server è molto semplice. ...acquistatelo tranquillamente se desiderate monitorare un vasto panorama di rete.”
Grazie alla collaborazione con fornitori IT innovativi, Paessler libera sinergie per creare nuovi e ulteriori vantaggi per i suoi clienti.
L'integrazione dei risultati del monitoraggio di PRTG nelle mappe di NetBrain costituisce la base per l'automazione della rete.
Paessler e Plixer forniscono una soluzione completa che aggiunge l'analisi dei flussi e dei metadati a un potente strumento di monitoraggio della rete.
UVexplorer si integra perfettamente con PRTG per offrire una scoperta rapida e accurata della rete, un inventario dettagliato dei dispositivi e una mappatura automatica della rete alla piattaforma PRTG.
Notifiche in tempo reale significano una risoluzione più rapida dei problemi, in modo da poter intervenire prima che si verifichino problemi più gravi.
Software di monitoraggio della rete – Versione 26.1.116.1532 (February 9th, 2026)
Disponibile il download della versione per Windows e della versione cloud-based PRTG Hosted Monitor
Inglese, tedesco, spagnolo, francese, portoghese, olandese, russo, giapponese e cinese semplificato
Dispositivi di rete, larghezza di banda, server, applicazioni, ambienti virtuali, sistemi remoti, IoT e molto altro
Scegli l'abbonamento a PRTG Network Monitor più adatto a te


Un analizzatore di protocollo (anche strumento di analisi del protocollo, analizzatore di traffico, analizzatore di pacchetti o strumento di analisi dei pacchetti) è un software che può essere utilizzato per registrare e analizzare il traffico di dati in una rete. In concreto, ciò significa che il traffico di rete viene suddiviso in base a vari parametri. I flussi di dati vengono quindi visualizzati in diagrammi e tabelle per l'analisi.
PRTG include funzionalità di analisi dei protocolli per tracciare e analizzare lo sniffing dei pacchetti e i diversi protocolli di flusso. Il traffico di rete viene classificato per connessione, indirizzo IPS e protocollo.
Nel contesto del monitoraggio dei flussi, il termine "flusso" si riferisce al flusso di pacchetti di dati tra due endpoint, come dispositivi o applicazioni. La registrazione del flusso di dati avviene per lo più esportando i dati di flusso di un dispositivo (ad esempio un router, un firewall o uno switch). Inoltre, è necessario un raccoglitore di dati. Il suo compito è quello di logare i dati in modo che possano essere analizzati in seguito.
PRTG offre diversi sensori preconfigurati per la raccolta, l'analisi e il monitoraggio dei dati di monitoraggio.
PRTG incorpora tecnologie di monitoraggio dei flussi come NetFlow, sFlow e jFlow nel suo toolkit di analisi dei protocolli. Ciò consente di esaminare in modo approfondito i modelli di traffico di rete, aiutando a identificare i tipi di traffico e i protocolli utilizzati, nonché a individuare le fonti di elevato consumo di larghezza di banda. Il monitoraggio dei flussi è essenziale per capire come si muovono i dati nella rete e per identificare potenziali minacce alla sicurezza o inefficienze.
Sì, anche se PRTG rispetta la crittografia non decifrando il contenuto, analizza i dati del flusso di traffico crittografato per fornire informazioni sull'utilizzo della larghezza di banda, sui modelli di comunicazione e sulle metriche di origine/destinazione. Questo livello di analisi è fondamentale per gestire le prestazioni e la sicurezza della rete, anche quando il contenuto del traffico rimane privato.
PRTG offre ampie opzioni di personalizzazione per l'analisi dei protocolli e dei flussi, compresa la possibilità di impostare sensori e filtri specifici per il monitoraggio di particolari protocolli o tipi di traffico. Questa flessibilità garantisce che gli amministratori di rete possano concentrarsi sul traffico più importante per gli obiettivi di sicurezza e prestazioni della loro organizzazione.
Sfruttando l'analisi dei protocolli e i dati di flusso, PRTG è in grado di rilevare le anomalie confrontando i modelli di traffico attuali con le linee di base storiche. Questa capacità consente di rilevare tempestivamente attività insolite, come picchi di utilizzo della larghezza di banda o la comparsa di protocolli sconosciuti, che potrebbero indicare problemi di sicurezza o di rete.
Le capacità di monitoraggio dei flussi del PRTG Network Monitor si estendono sia al traffico di rete interno che a quello esterno diretto a Internet. Ciò garantisce una visibilità completa su tutti i flussi di dati, consentendo una gestione efficace e una supervisione della sicurezza sull'intera infrastruttura di rete.
In PRTG, i “sensori” sono gli elementi base del monitoraggio. Un sensore monitora solitamente un valore misurato nella tua rete (ad esempio, il traffico di una porta switch, il carico della CPU di un server o lo spazio libero di un’unità disco). In media, occorrono circa 5-10 sensori per ogni dispositivo o un sensore per ogni porta switch.
Paessler ha condotto prove in oltre 600 dipartimenti IT in tutto il mondo per mettere a punto il suo software di monitoraggio di rete più vicino alle esigenze dei sysadmin. Il risultato è che più del 95% degli intervistati consiglierebbe PRTG – o lo ha già fatto.

Paessler PRTG è utilizzato da aziende di tutte le dimensioni. Gli amministratori di sistema adorano PRTG perché rende il loro lavoro molto più semplice.
Ampiezza di banda, server, ambienti virtuali, siti Web, servizi VoIP - PRTG tiene d'occhio la tua intera rete.
Tutti hanno esigenze di monitoraggio diverse. Ecco perché ti lasciamo provare PRTG gratuitamente. Inizia oggi stesso la tua prova.