Os alertas personalizados e a visualização de dados permitem que você identifique e evite rapidamente os gargalos no desempenho da rede.
O gerenciamento de rede está cheio de problemas de rede constantes e muitas vezes imprevisíveis que aparecem aleatoriamente, como qualquer administrador de sistema sabe. Todos eles precisam de atenção imediata, seja um problema de segurança de rede, agentes mal-intencionados no sistema ou um dispositivo de rede inoperante. O PRTG da Paessler elimina o "frenesi" da administração de rede com um monitoramento de rede abrangente e personalizável.
Diagnostique problemas de rede rastreando continuamente a atividade e o tráfego da rede. Mostre o uso da largura de banda, o tempo de atividade, o tempo de resposta, a latência, a perda de pacotes e outras métricas importantes em tempo real. Visualize os dados de monitoramento em gráficos e painéis claros para identificar problemas mais facilmente. Obtenha a Visão Geral de que você precisa para solucionar problemas de ineficiência da rede.

Visualização em árvore de dispositivos da configuração completa de monitoramento

Painel PRTG personalizado para manter um olho em toda a infraestrutura de TI

Gráfico de dados de tráfego ao vivo no PRTG
“Ganha tudo monitor
de rede”
“A verdadeira beleza do PRTG são as infinitas possibilidades que oferece”
“O PRTG Network Monitor é muito difícil de ser superado”
Nós o ouvimos, e é por isso que o PRTG não apenas monitora sua rede; ele o ajuda a otimizá-la. O PRTG fornece insights detalhados em um painel único e personalizável.
Essas informações, juntamente com alertas em tempo real (também personalizáveis), ajudam você a tomar decisões proativas e informadas sobre atualizações de rede e alocação de recursos, bem como outras ações.
A qualidade de serviço (QoS) é fundamental se você quiser ter certeza de manter o alto desempenho e a confiabilidade de seus aplicativos sensíveis.
O PRTG o ajuda a monitorar e medir suas métricas de QoS, para que aplicativos importantes obtenham a largura de banda e os recursos de que precisam.
Você não precisa trocar sua ferramenta de monitoramento toda vez que sua organização cresce. Felizmente, o PRTG foi projetado para crescer com sua rede, por isso é adequado para redes de qualquer tamanho.
Suas opções de licenciamento flexíveis e a capacidade de monitorar milhares de dispositivos significam que ele pode ser dimensionado para pequenas e grandes empresas.
Nós trabalhamos duro para garantir que você não precise fazer isso. O PRTG tem uma interface intuitiva que o torna fácil de usar tanto por profissionais de TI novatos quanto experientes. (Isso é o que nossos clientes dizem...)
Você pode personalizar o painel para mostrar as visualizações que você precisa, para que você seja mais produtivo e menos frustrado enquanto mantém sua rede funcionando sem problemas.
O PRTG vem com mais de 250 tipos de sensores nativos para monitorar todo o seu ambiente local, na nuvem e na nuvem híbrida. Confira alguns exemplos abaixo!
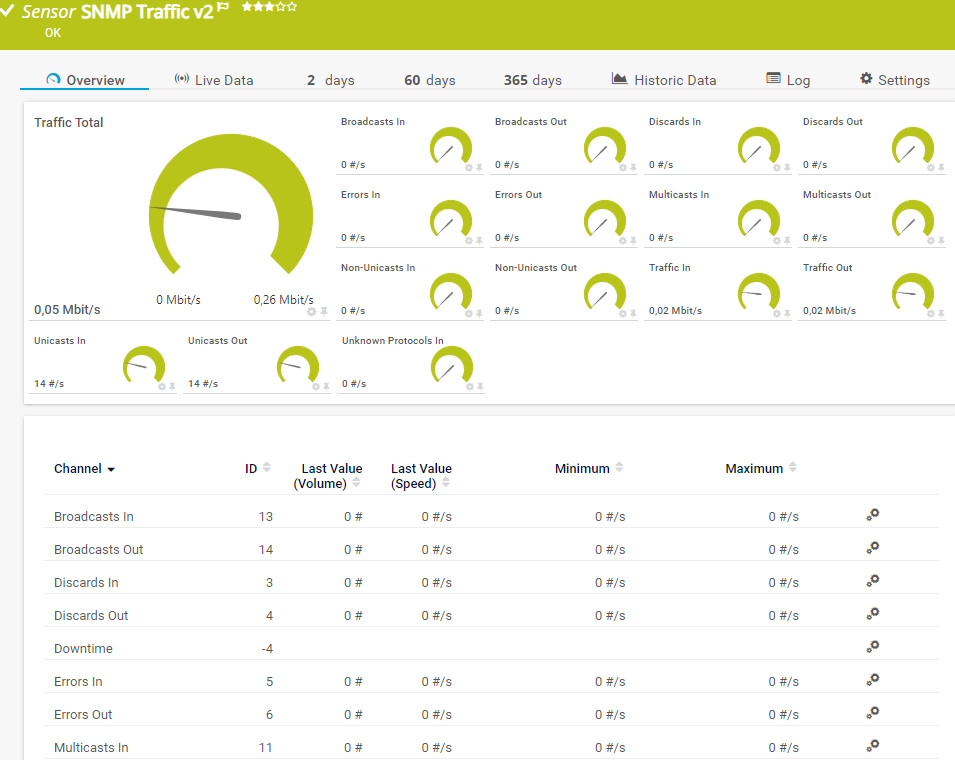
O sensor Tráfego (SNMP) v2 monitora a largura de banda e o tráfego em um dispositivo. Ele pode mostrar o seguinte:
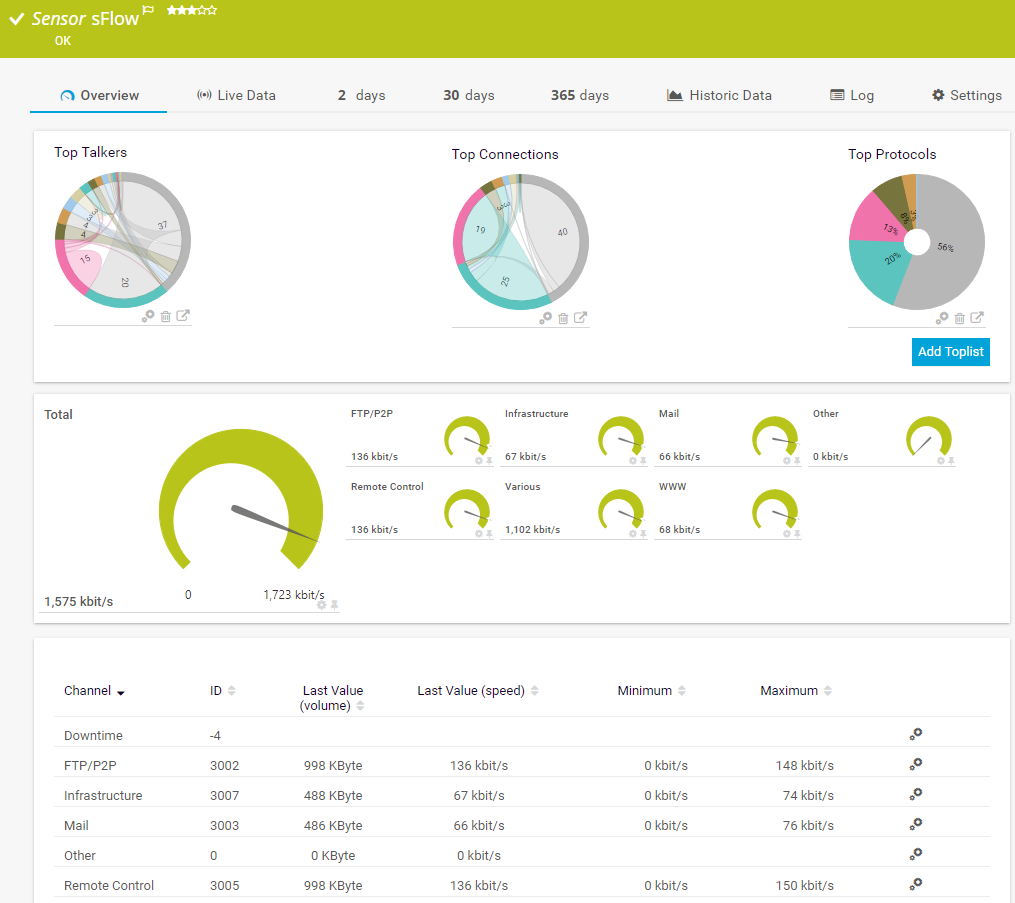
O sensor sFlow recebe dados de tráfego de um dispositivo compatível com sFlow v5 e mostra o tráfego por tipo. Esse sensor tem várias opções de filtro para dividir o tráfego em diferentes canais. Ele pode mostrar o seguinte e muito mais:
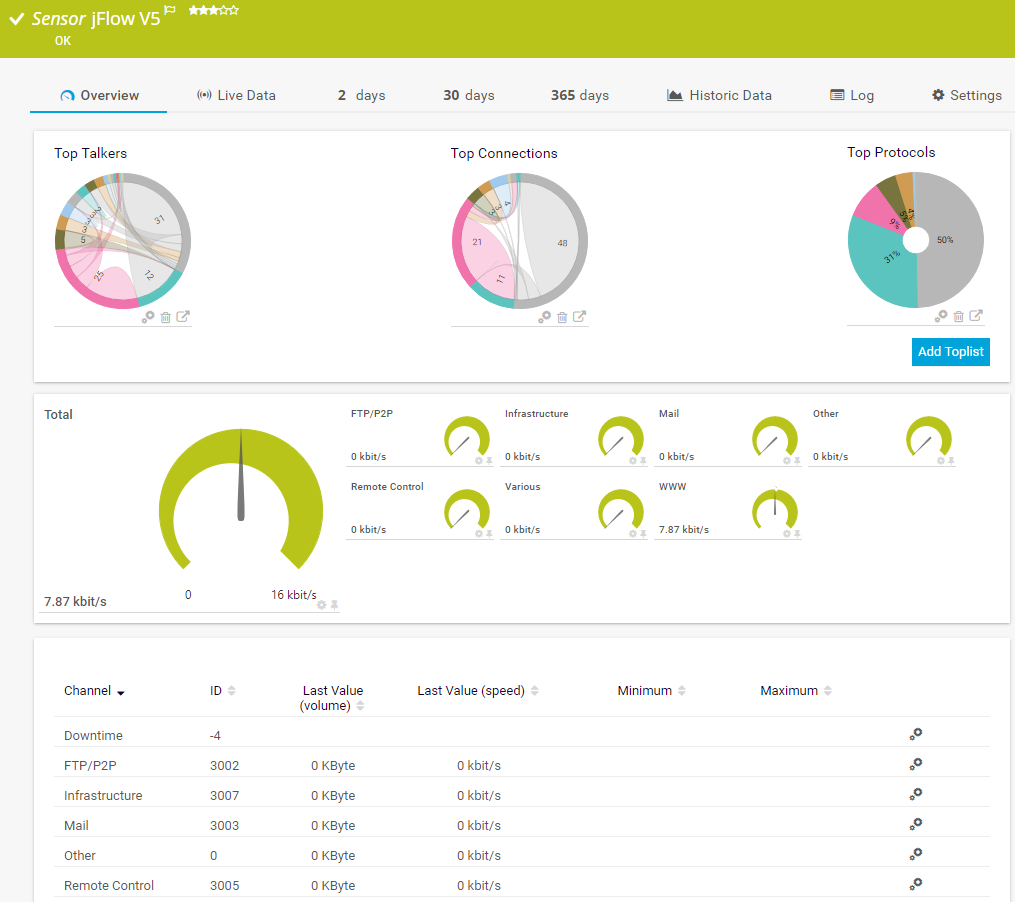
O sensor jFlow v5 recebe dados de tráfego de um dispositivo compatível com o jFlow v5 e mostra o tráfego por tipo. Ele pode mostrar o seguinte e muito mais:
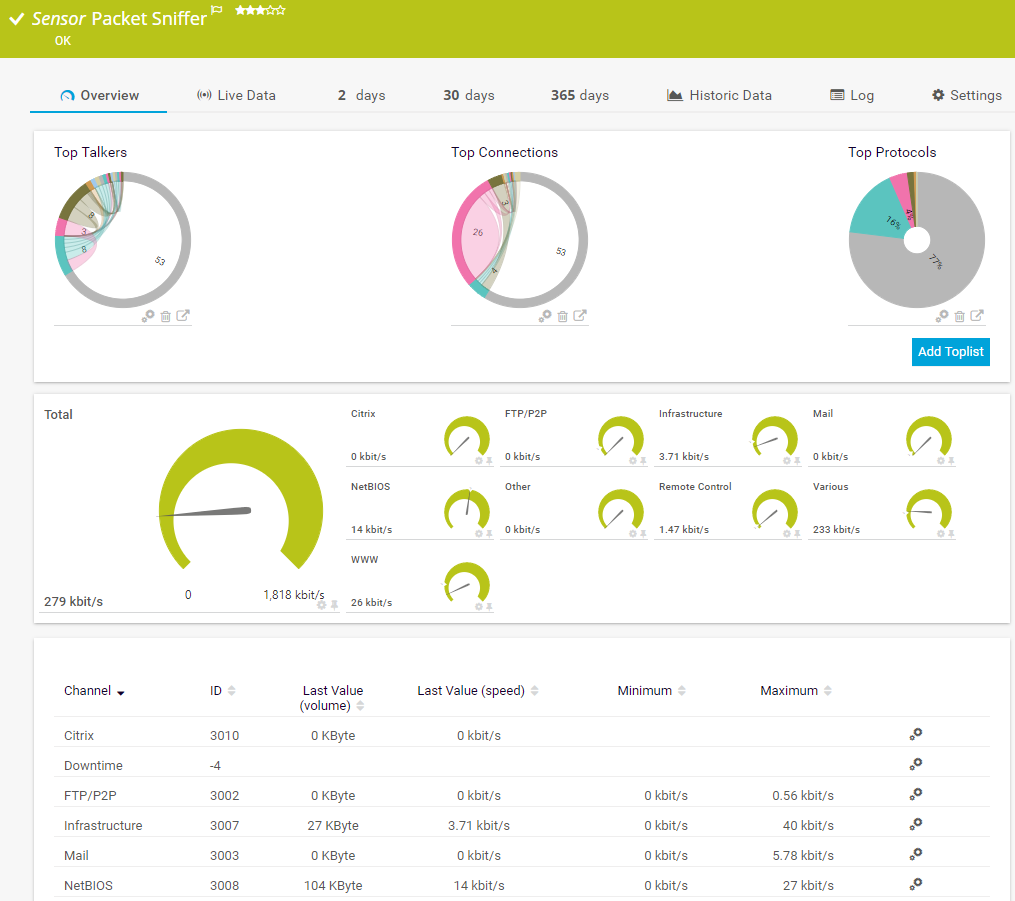
O sensor Sniffer de pacotes monitora os cabeçalhos dos pacotes de dados que passam por uma placa de rede local usando um sniffer de pacotes integrado. Você pode escolher entre canais predefinidos. Ele pode mostrar o seguinte e muito mais:
Consulte o Manual do PRTG para obter uma lista de todos os tipos de sensores disponíveis.

As notificações em tempo real significam uma solução de problemas mais rápida para que você possa agir antes que ocorram problemas mais sérios.
Configure o PRTG em minutos e use-o em praticamente qualquer dispositivo móvel.


“Excelente ferramenta para monitoramento detalhado. Alarmes e notificações funcionam muito bem. A adição de equipamentos é simples e a configuração inicial do servidor é bem fácil. ...sinta-se tranquilo em comprá-lo se você pretende monitorar um grande cenário de rede.”
Em parceria com fornecedores de TI inovadores, a Paessler libera sinergias para criar benefícios novos e adicionais para os clientes associados.
A combinação do amplo conjunto de recursos de monitoramento do PRTG com a garantia de rede automatizada do IP Fabric cria um novo nível de visibilidade e confiabilidade da rede.
A Paessler e a Plixer fornecem uma solução completa, acrescentando análise de fluxo e metadados a uma poderosa ferramenta de monitoramento de rede.
O UVexplorer integra-se perfeitamente ao PRTG para proporcionar descoberta de rede rápida e precisa, inventário detalhado de dispositivos e mapeamento automático de rede para a plataforma PRTG.
Os alertas personalizados e a visualização de dados permitem que você identifique e evite rapidamente os gargalos no desempenho da rede.
Software de monitoramento de rede – Versão 26.1.116.1532 (February 9th, 2026)
Download para Windows e versão baseada em nuvem do PRTG Hosted Monitor disponível
Inglês, alemão, espanhol, francês, português, holandês, russo, japonês e chinês simplificado
Dispositivos de rede, largura de banda, servidores, aplicativos, ambientes virtuais, sistemas remotos, IoT e muito mais
Escolha a assinatura do PRTG Network Monitor que é melhor para você


A utilização da rede é a proporção entre o tráfego atual da rede e o volume máximo de tráfego que pode ser tratado. TI indica o consumo de largura de banda na rede. Enquanto o alto tráfego de rede significa que a rede está sobrecarregada, o baixo tráfego de rede significa que a rede não está ocupada. Se a carga da rede atingir ou exceder o limite em condições normais, isso resultará em baixa velocidade da rede, interrupções, tempos limite etc. A carga da rede é um indicador da utilização da rede.
A taxa de utilização da rede é a porcentagem da largura de banda total que está sendo usada em um determinado momento. Essa métrica indica o grau de eficiência da sua rede. Altas taxas de utilização podem indicar que a rede está se aproximando da capacidade, enquanto taxas baixas podem sugerir que os recursos estão sendo subutilizados.
Sim, de fato! O monitoramento da utilização da rede fornece uma linha de base de como é um padrão de tráfego normal para a sua organização. Qualquer desvio - um pico no uso da largura de banda, padrões de tráfego incomuns, fluxos de dados inesperados - pode indicar uma ameaça potencial à segurança. O PRTG também pode detectar o acesso não autorizado e a varredura de portas, bem como monitorar os volumes de transferência de dados.
Há várias métricas importantes. Elas incluem o uso da largura de banda, que mede a quantidade de dados que está sendo enviada pela rede. As métricas também incluem rendimento, latência, perda de pacotes e taxas de erro. Ao observar essas métricas, você pode identificar corretamente os possíveis problemas antes que eles se tornem graves e afetem a experiência do usuário.
Quando o uso da rede não é otimizado, várias áreas podem ser prejudicadas. Os links de WAN, por exemplo, são um local comum para gargalos. Dispositivos de usuários finais, sistemas VoIP e até mesmo roteadores e switches que lidam com altos volumes de tráfego são áreas possivelmente afetadas pela má alocação da largura de banda.
No PRTG, “sensores” são os elementos básicos de monitoramento. Um sensor geralmente monitora um valor medido na sua rede, por exemplo, o tráfego em uma porta de switch, a carga de CPU de um servidor ou o espaço livre em uma unidade de disco. Em média, você precisa de 5-10 sensores por dispositivo ou um sensor por porta de switch.
A Paessler realizou testes em mais de 600 departamentos de TI em todo o mundo para sintonizar seu software de monitoramento de rede mais próximo às necessidades dos administradores. O resultado da pesquisa: mais de 95% dos participantes recomendaria PRTG – ou já o fizeram.

Paessler PRTG é usado por empresas de todos os tamanhos. Os administradores adoram PRTG porque ele facilita muito o trabalho.
Largura de banda, servidores, ambientes virtuais, websites, serviços VoIP – PRTG monitora toda a sua rede.
As necessidades de monitoramento variam. Por isso deixamos você experimentar PRTG gratuitamente. Comece agora mesmo o seu período de testes.