Gli avvisi personalizzati e la visualizzazione dei dati consentono di identificare e prevenire rapidamente errori, problemi di sicurezza dei dati, attività sospette, minacce interne e altri problemi con i computer dei dipendenti.
Avete postazioni di lavoro dedicate che utilizzate per la progettazione 3D, le simulazioni complesse o altre attività che richiedono molta CPU?
Dato che un piccolo inconveniente potrebbe cancellare mesi di lavoro, ogni sysadmin degno di nota (leggi, voi) ha un sistema di monitoraggio per tenere d'occhio le attività degli utenti, come gli accessi, e le prestazioni della rete.
Ma dovreste includere nel vostro ambiente di monitoraggio ogni stazione di lavoro connessa alla rete. Anche quelle su cui i vostri dipendenti lavorano quotidianamente.
Dopo tutto, la maggior parte delle violazioni dei dati può essere ricondotta ad azioni compiute su un computer di un dipendente: minacce interne o errori genuini come cliccare su link sui social media. Inoltre, con il lavoro a distanza sempre più diffuso e i membri dei team remoti che accedono a dati sensibili da qualsiasi luogo, i rischi per la sicurezza dei dati (e per la sicurezza della vostra rete) non sono mai stati così alti.
Con PRTG di Paessler è più facile identificare le attività sospette, prevenire le violazioni dei dati e gestire una rete più veloce e stabile. I sensori preconfigurati della nostra soluzione di monitoraggio della rete monitorano le principali statistiche di salute durante l'intera giornata lavorativa (e anche la sera, nel fine settimana e in altri momenti inattivi).
Inoltre, le automazioni personalizzate vi avvisano in caso di problemi, rendendo più facile la risoluzione dei problemi, garantendo un ambiente di lavoro più sicuro e mantenendo la rete efficiente, anche se avete una forza lavoro prevalentemente remota.

Grazie a un gran numero di sensori preconfigurati, la nostra soluzione software di monitoraggio è in grado di monitorare ogni parametro e metrica immaginabile: salute e disponibilità dell'hardware e delle applicazioni, traffico di rete e prestazioni dei dispositivi, e di generare rapporti dettagliati per i vostri superiori.
Rimanete al corrente dei problemi, senza interrompere il vostro flusso di lavoro. Una volta impostate le soglie di errore preferite, non c'è bisogno di monitorare o controllare manualmente le attività. PRTG vi avvisa automaticamente tramite e-mail, SMS o altri metodi se qualcosa non quadra, mentre voi continuate la vostra giornata.
Il modo migliore per prevenire problemi, violazioni dei dati, colli di bottiglia della larghezza di banda, tempi di inattività e altro è quello di risolverli prima che si aggravino. RESTG monitora l'intera infrastruttura IT 24 ore su 24, in modo da garantire che non si perda uno sviluppo potenzialmente dannoso.
PRTG supporta la maggior parte dei protocolli principali, tra cui SNMP, WMI, SSH, HTTP e HTTPS e le tecnologie Flow, nonché i principali produttori di workstation come Dell, Microsoft e HPE. Ciò significa che è possibile configurare l'ambiente di monitoraggio in modo rapido, senza interrompere la giornata lavorativa.
Diagnosticare i problemi di rete monitorando continuamente le workstation mission-critical e i computer dei dipendenti, compresi i desktop remoti. Mostra la disponibilità, l'uso della CPU, la memoria, la larghezza di banda, la latenza e altre metriche chiave in tempo reale. Visualizzate i dati di monitoraggio in grafici e dashboard chiari per identificare più facilmente i problemi. Ottenete la Panoramica necessaria per risolvere i colli di bottiglia, i tempi di inattività non pianificati e altri problemi di prestazioni di rete.

Albero dei dispositivi dell'intera configurazione di monitoraggio

Dashboard PRTG personalizzato per tenere sotto controllo l'intera infrastruttura IT

Grafico dei dati di traffico in tempo reale in PRTG
“Monitor di rete vincente sotto tutti i punti di vista”
“La vera bellezza di PRTG sta nelle infinite possibilità che offre”
“PRTG Network Monitor
è molto difficile da superare”
Il nostro software di monitoraggio delle postazioni di lavoro e dei computer dei dipendenti dispone di una gamma completa di sensori preconfigurati per un monitoraggio preciso di ogni parametro che potrebbe influire, ad esempio, sulla sicurezza e sulle prestazioni della rete:
PRTG è dotato di oltre 250 tipi di sensori nativi per il monitoraggio dell'intero ambiente on-premises, cloud e cloud ibrido. Dai un'occhiata ad alcuni esempi qui sotto!
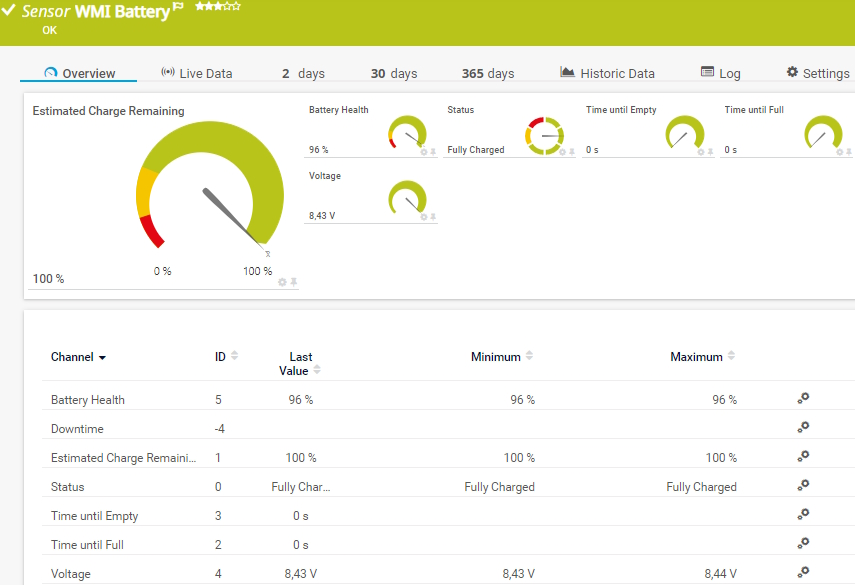
Il sensore WMI Battery monitora la capacità disponibile e lo stato delle batterie o dei gruppi di continuità (UPS) collegati a un dispositivo basato su Windows. Può mostrare quanto segue:
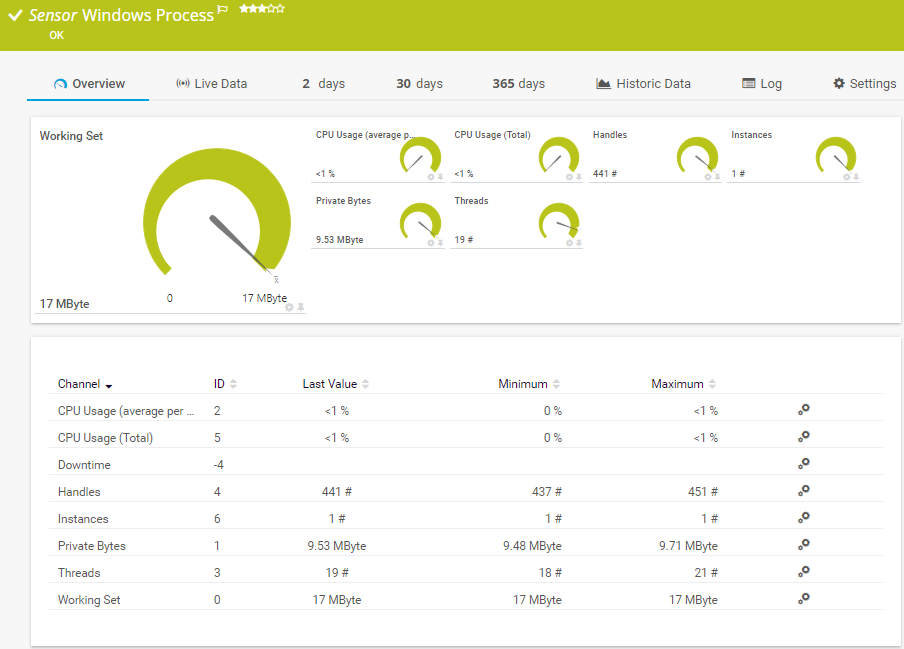
Il sensore Windows Process monitora un processo Windows tramite Windows Management Instrumentation (WMI) o i contatori di prestazioni di Windows. Può mostrare quanto segue:
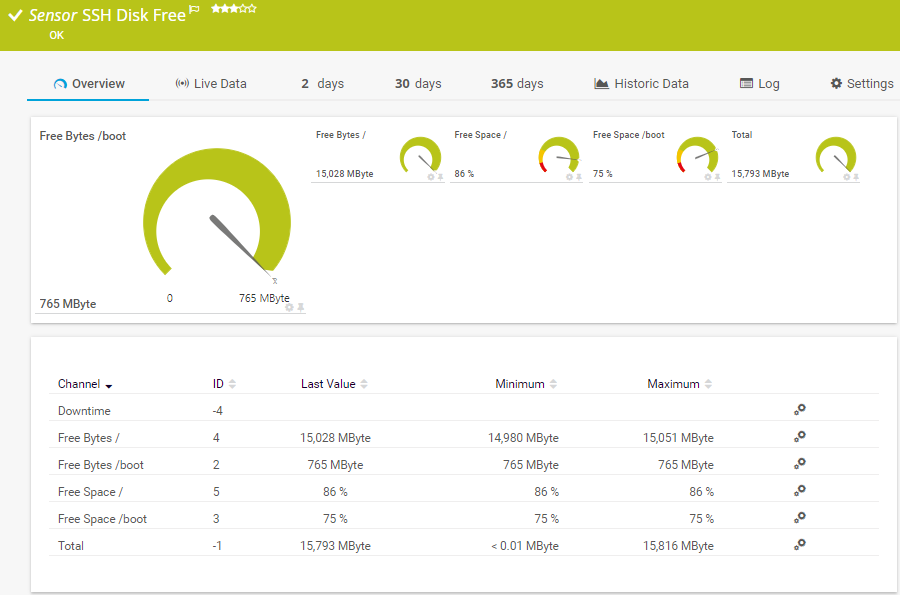
Il sensore SSH Disk Free controlla lo spazio libero sui dischi di un sistema Linux/Unix utilizzando Secure Shell (SSH). Può mostrare quanto segue:
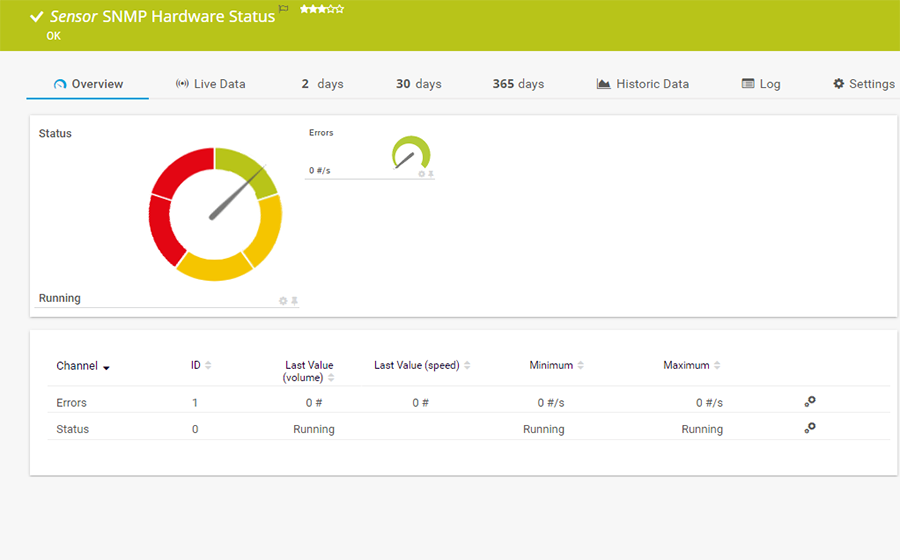
Il sensore SNMP Hardware Status monitora lo stato del componente hardware di un server. Può mostrare quanto segue:
Consulta il manuale di PRTG per un elenco di tutti i tipi di sensore disponibili.

Notifiche in tempo reale significano una risoluzione più rapida dei problemi, in modo da poter intervenire prima che si verifichino problemi più gravi.
PRTG si configura in pochi minuti e può essere utilizzato su un'ampia gamma di dispositivi mobili.


“Eccellente strumento per un monitoraggio dettagliato. Gli avvisi e le notifiche funzionano perfettamente. L'aggiunta dei dispositivi è intuitiva e la configurazione iniziale del server è molto semplice. ...acquistatelo tranquillamente se desiderate monitorare un vasto panorama di rete.”
Grazie alla collaborazione con fornitori IT innovativi, Paessler libera sinergie per creare nuovi e ulteriori vantaggi per i suoi clienti.
L'IT che funziona costituisce una base critica per il successo di un'azienda. La disponibilità e la sicurezza devono essere definite per il rispettivo scopo e monitorate attentamente, sia da parte dell'OT che dell'IT.
L'integrazione dei risultati del monitoraggio di PRTG nelle mappe di NetBrain costituisce la base per l'automazione della rete.
Con ScriptRunner Paessler integra una potente piattaforma di automazione degli eventi in PRTG Network Monitor.
Gli avvisi personalizzati e la visualizzazione dei dati consentono di identificare e prevenire rapidamente errori, problemi di sicurezza dei dati, attività sospette, minacce interne e altri problemi con i computer dei dipendenti.
Software di monitoraggio della rete – Versione 26.1.116.1532 (February 9th, 2026)
Disponibile il download della versione per Windows e della versione cloud-based PRTG Hosted Monitor
Inglese, tedesco, spagnolo, francese, portoghese, olandese, russo, giapponese e cinese semplificato
Dispositivi di rete, larghezza di banda, server, applicazioni, ambienti virtuali, sistemi remoti, IoT e molto altro
Scegli l'abbonamento a PRTG Network Monitor più adatto a te
Le workstation sono computer speciali che vengono utilizzati per eseguire compiti che non sarebbero sufficienti per i computer tradizionali. Tra le altre cose, questi compiti includono la progettazione di modelli 3D complessi e simulazioni ad alta intensità di calcolo. Solo per questo motivo, le workstation devono essere monitorate 24 ore al giorno. Infatti, un'anomalia in una di queste macchine ad alte prestazioni può avere un grave impatto sulle operazioni e sulla produttività di un'azienda.
PRTG è uno strumento software proprietario che tiene traccia della salute e delle prestazioni di server, unità fisiche e logiche, ambienti virtualizzati, computer dei dipendenti e altri dispositivi collegati alla rete. Disponibile per server on-premises o come soluzione basata sul cloud, è in grado di monitorare un numero illimitato di dispositivi locali, ambienti virtuali e desktop remoti, riunendo i dati critici del sistema in un'unica interfaccia semplice e intuitiva a cui è possibile accedere da qualsiasi luogo: in ufficio, a casa o in viaggio.
La funzionalità di monitoraggio di PRTG si estende a sensori preconfigurati specifici per Linux, che possono essere utilizzati per monitorare l'attività degli utenti, lo stato dei dispositivi, la disponibilità e altre metriche delle prestazioni sulle workstation eseguite su Linux. È comunque necessario installare un server centrale PRTG su Windows. Ma, una volta fatto questo, è possibile utilizzare la nostra nuova multi-platform probe che funziona anche su sistemi Linux/Unix e macOS. In alternativa, se la vostra rete funziona esclusivamente su Linux, provate la nostra soluzione in hosting completamente compatibile con Linux.
Sì. Il PRTG monitora i desktop, le workstation e i computer dei dipendenti remoti utilizzando un sistema di sonde remote che sono in costante comunicazione con un hub centrale, il server centrale PRTG. Installate le sonde in prossimità degli endpoint dei desktop, delle workstation o dei computer dei dipendenti che volete monitorare. Le sonde raccolgono i dati sulle metriche che state monitorando e li riportano al server centrale, che li organizza in dashboard che potete consultare per controllare a colpo d'occhio lo stato di salute dell'intera rete dell'organizzazione e creare rapporti dettagliati.
No, Paessler PRTG non è un software di monitoraggio dei dipendenti. Mentre molte organizzazioni possono cercare soluzioni per tenere traccia della produttività dei dipendenti e dei lavoratori remoti, monitorare le prestazioni dei dipendenti o utilizzare software di monitoraggio durante il lavoro da casa, PRTG si concentra esclusivamente sul monitoraggio della rete.
Fornisce ai Teams gli strumenti per garantire che la rete dell'organizzazione rimanga sicura e funzioni al meglio, indipendentemente dal fatto che i dipendenti lavorino dall'ufficio o da remoto. PRTG non monitora metriche come il tempo inattivo o la pressione dei tasti, né si impegna in alcuna forma di monitoraggio o tracciamento della produttività. IT è stato costruito per monitorare i server, i dispositivi e il traffico di rete, non i dipendenti. La nostra priorità è la salute della rete, non la minuzia delle attività lavorative dei dipendenti.
In PRTG, i “sensori” sono gli elementi base del monitoraggio. Un sensore monitora solitamente un valore misurato nella tua rete (ad esempio, il traffico di una porta switch, il carico della CPU di un server o lo spazio libero di un’unità disco). In media, occorrono circa 5-10 sensori per ogni dispositivo o un sensore per ogni porta switch.
Paessler ha condotto prove in oltre 600 dipartimenti IT in tutto il mondo per mettere a punto il suo software di monitoraggio di rete più vicino alle esigenze dei sysadmin. Il risultato è che più del 95% degli intervistati consiglierebbe PRTG – o lo ha già fatto.

Paessler PRTG è utilizzato da aziende di tutte le dimensioni. Gli amministratori di sistema adorano PRTG perché rende il loro lavoro molto più semplice.
Ampiezza di banda, server, ambienti virtuali, siti Web, servizi VoIP - PRTG tiene d'occhio la tua intera rete.
Tutti hanno esigenze di monitoraggio diverse. Ecco perché ti lasciamo provare PRTG gratuitamente. Inizia oggi stesso la tua prova.