Gli avvisi personalizzati e la visualizzazione dei dati consentono di identificare e prevenire rapidamente i problemi relativi alle operazioni del database.
Per gli amministratori di sistema, la risoluzione dei problemi dei database di grandi dimensioni può sembrare infinita. Sui sistemi Linux e macOS, la gestione dei database è spesso sinonimo di sistemi di database PostgreSQL. Questi sistemi preconfigurati spesso non riescono a soddisfare i requisiti specifici dell'infrastruttura IT di un'organizzazione. È qui che il monitoraggio delle prestazioni di PostgreSQL di Paessler PRTG brilla.
Diagnostica i problemi di rete monitorando continuamente la disponibilità, la salute e le prestazioni dei sistemi di database PostgreSQL. Mostra la latenza, i carichi di lavoro, il numero di query in esecuzione, le righe interessate e altre metriche delle prestazioni in tempo reale. Visualizzate i dati di monitoraggio in grafici e dashboard chiari per identificare più facilmente i problemi. Ottenete la Panoramica necessaria per risolvere query lente e altri errori del database PostgreSQL.

Albero dei dispositivi dell'intera configurazione di monitoraggio

Dashboard PRTG personalizzato per tenere sotto controllo l'intera infrastruttura IT

Grafico dei dati di traffico in tempo reale in PRTG
“Monitor di rete vincente sotto tutti i punti di vista”
“La vera bellezza di PRTG sta nelle infinite possibilità che offre”
“PRTG Network Monitor
è molto difficile da superare”
PRTG è dotato di oltre 250 tipi di sensori nativi per il monitoraggio dell'intero ambiente on-premises, cloud e cloud ibrido. Dai un'occhiata ad alcuni esempi qui sotto!
Il sensore PostgreSQL monitora un database su un server PostgreSQL ed esegue una query. Può mostrare quanto segue:
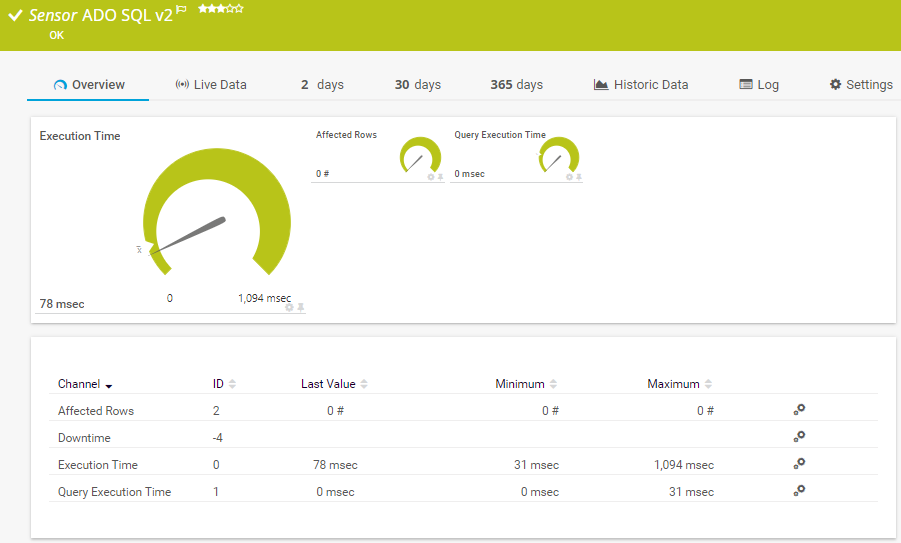
Il sensore ADO SQL v2 controlla un database tramite una connessione ActiveX Data Objects (ADO) ed esegue una query SQL. Può mostrare i seguenti dati:
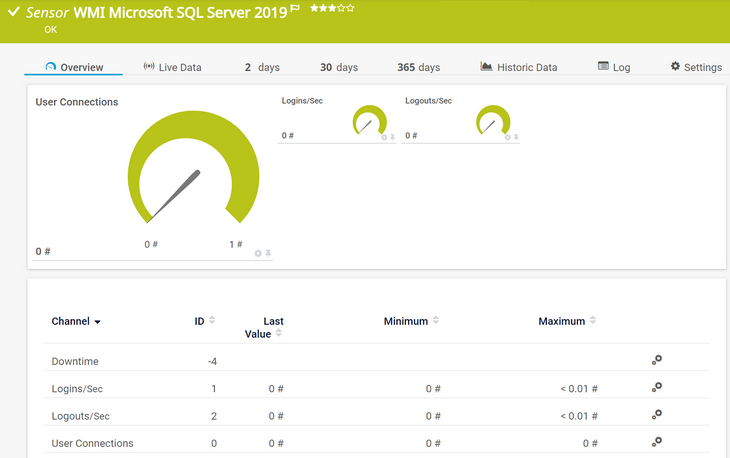
Il sensore WMI Microsoft SQL Server 2019 monitora le prestazioni di un Microsoft SQL Server. Può mostrare i seguenti dati e altri ancora:
Consulta il manuale di PRTG per un elenco di tutti i tipi di sensore disponibili.

Gli avvisi personalizzati e la visualizzazione dei dati consentono di identificare e prevenire rapidamente i problemi relativi alle operazioni del database.
Configurate PRTG in pochi minuti e utilizzatelo su quasi tutti i dispositivi mobili.


“Eccellente strumento per un monitoraggio dettagliato. Gli avvisi e le notifiche funzionano perfettamente. L'aggiunta dei dispositivi è intuitiva e la configurazione iniziale del server è molto semplice. ...acquistatelo tranquillamente se desiderate monitorare un vasto panorama di rete.”
Grazie alla collaborazione con fornitori IT innovativi, Paessler libera sinergie per creare nuovi e ulteriori vantaggi per i suoi clienti.
L'IT che funziona costituisce una base critica per il successo di un'azienda. La disponibilità e la sicurezza devono essere definite per il rispettivo scopo e monitorate attentamente, sia da parte dell'OT che dell'IT.
L'integrazione dei risultati del monitoraggio di PRTG nelle mappe di NetBrain costituisce la base per l'automazione della rete.
Con ScriptRunner Paessler integra una potente piattaforma di automazione degli eventi in PRTG Network Monitor.
Notifiche in tempo reale significano una risoluzione più rapida dei problemi, in modo da poter agire prima che si verifichino problemi più gravi.
Software di monitoraggio della rete – Versione 26.1.116.1532 (February 9th, 2026)
Disponibile il download della versione per Windows e della versione cloud-based PRTG Hosted Monitor
Inglese, tedesco, spagnolo, francese, portoghese, olandese, russo, giapponese e cinese semplificato
Dispositivi di rete, larghezza di banda, server, applicazioni, ambienti virtuali, sistemi remoti, IoT e molto altro
Scegli l'abbonamento a PRTG Network Monitor più adatto a te


PostgreSQL è un sistema di gestione di database relazionali (RDBMS) open-source, potente e ricco di funzionalità, che supporta sia l'interrogazione SQL (relazionale) che JSON (non relazionale). È ampiamente conosciuto per la sua robustezza, estensibilità e conformità alle proprietà ACID (Atomicità, Consistenza, Isolamento, Durabilità), che garantiscono l'integrità transazionale.
Il monitoraggio dei database PostgreSQL è una parte fondamentale dell'amministrazione dei sistemi. Il monitoraggio fornisce i dati necessari per identificare i problemi di prestazioni, garantire l'alta disponibilità, ridurre al minimo i tempi di inattività e ottimizzare l'uso delle risorse.
Se configurato correttamente, il monitoraggio ha un basso impatto sulle prestazioni. Per facilitare la gestione, PRTG fornisce l'impatto sulle prestazioni di ciascun sensore, in modo da poter prendere decisioni più informate.
Sì. Per installare e utilizzare il sensore PostgreSQL, è necessario soddisfare i seguenti requisiti:
PRTG è in grado di monitorare PostgreSQL molto bene, ma il monitoraggio all-in-one è ancora migliore. PRTG è una soluzione di monitoraggio all-in-one con dashboard personalizzabili, avvisi e un ampio supporto per i sensori.
No. Oltre a PostgreSQL, PRTG è dotato di vari sensori utili per rilevare i problemi del database. È possibile utilizzare il nostro software di monitoraggio di tutti i database SQL più diffusi, tra cui:
Se avete bisogno di un monitoraggio esteso per database come IBM DB2, SAP HANA, SAP MaxDB e altri, date un'occhiata alla nostra nuovissima product extension PRTG Database Observer.
In PRTG, i “sensori” sono gli elementi base del monitoraggio. Un sensore monitora solitamente un valore misurato nella tua rete (ad esempio, il traffico di una porta switch, il carico della CPU di un server o lo spazio libero di un’unità disco). In media, occorrono circa 5-10 sensori per ogni dispositivo o un sensore per ogni porta switch.
Paessler ha condotto prove in oltre 600 dipartimenti IT in tutto il mondo per mettere a punto il suo software di monitoraggio di rete più vicino alle esigenze dei sysadmin. Il risultato è che più del 95% degli intervistati consiglierebbe PRTG – o lo ha già fatto.

Paessler PRTG è utilizzato da aziende di tutte le dimensioni. Gli amministratori di sistema adorano PRTG perché rende il loro lavoro molto più semplice.
Ampiezza di banda, server, ambienti virtuali, siti Web, servizi VoIP - PRTG tiene d'occhio la tua intera rete.
Tutti hanno esigenze di monitoraggio diverse. Ecco perché ti lasciamo provare PRTG gratuitamente. Inizia oggi stesso la tua prova.