Os alertas personalizados e a visualização de dados permitem que você identifique e evite rapidamente os problemas de desempenho da rede.
Um jitter mais alto aumenta a probabilidade de experimentar áudio instável, queda de chamadas, videoconferência com atraso e desempenho ruim da rede em geral. No entanto, observar cada bit e byte dos dados da rede é um trabalho de tempo integral. O PRTG da Paessler é a sua equipe de suporte extra, pronta para facilitar a medição, a análise e a resolução de todos os tipos de problemas de jitter.
Diagnostique problemas de rede rastreando continuamente o desempenho de sua rede. Mostre o jitter, a latência, o uso da largura de banda, o tempo de resposta, o tráfego de rede e o tráfego VoIP e outras métricas importantes em tempo real. Visualize os dados de monitoramento em gráficos e painéis claros para identificar problemas com mais facilidade. Obtenha a Visão Geral de que você precisa para solucionar problemas de congestionamento de rede, largura de banda e outros problemas de desempenho.

Visualização em árvore de dispositivos da configuração completa de monitoramento

Painel PRTG personalizado para manter um olho em toda a infraestrutura de TI

Gráfico de dados de tráfego ao vivo no PRTG
“Ganha tudo monitor
de rede”
“A verdadeira beleza do PRTG são as infinitas possibilidades que oferece”
“O PRTG Network Monitor é muito difícil de ser superado”
A TI não seria tão interessante se você pudesse ver apenas parte do sorriso da Mona Lisa. Não fique entediado com seus testes de jitter; obtenha a imagem completa.
O PRTG lhe dá uma análise aprofundada de jitter, latência e perda de pacotes. Assim, você obtém os dados necessários para fazer uma diferença real no desempenho da rede.
Quem quer passar seus fins de semana solucionando problemas de jitter e latência? Reconhecemos que os fins de semana e as noites são importantes para a R&R, por isso trabalhamos duro para tornar o PRTG uma "solução de resolução" rápida
Obtenha todos os dados de que você precisa para identificar rapidamente quando ocorre um problema, identificar onde está o problema e resolvê-lo - até o nível do aplicativo e do processo.
O PRTG vem com alertas em tempo real que soam o alarme quando o jitter excede os limites que você definiu. Personalize esses alertas para ir para as principais partes interessadas em limites específicos usando um método de entrega definido.
As notificações podem ser entregues por e-mail, SMS, notificações push, Slack e muito mais. Com o PRTG no relógio, você pode finalmente deixar o escritório sem se preocupar com a rede.
O PRTG é fácil de configurar. Na maioria dos casos, tudo o que é preciso são alguns cliques e minutos para começar a monitorar sua rede "fora da caixa"
Repetidamente, nossos clientes mencionam a facilidade de uso, a facilidade de configuração e como é fácil entender o painel central como parte da razão pela qual eles mantêm o PRTG em sua pilha de tecnologia. Não é necessário doutorado para implementar.
O PRTG vem com mais de 250 tipos de sensores nativos para monitorar todo o seu ambiente local, na nuvem e na nuvem híbrida. Confira alguns exemplos abaixo!
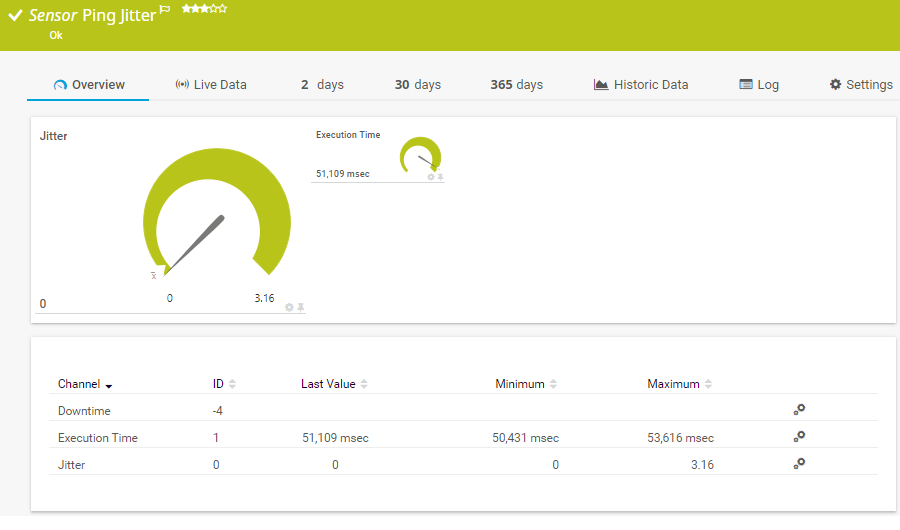
O sensor Jitter Ping envia uma série de solicitações de eco do Protocolo de Mensagens de Controle da Internet (ICMP) ("pings") a um URI para determinar o jitter estatístico. Ele pode mostrar o seguinte:
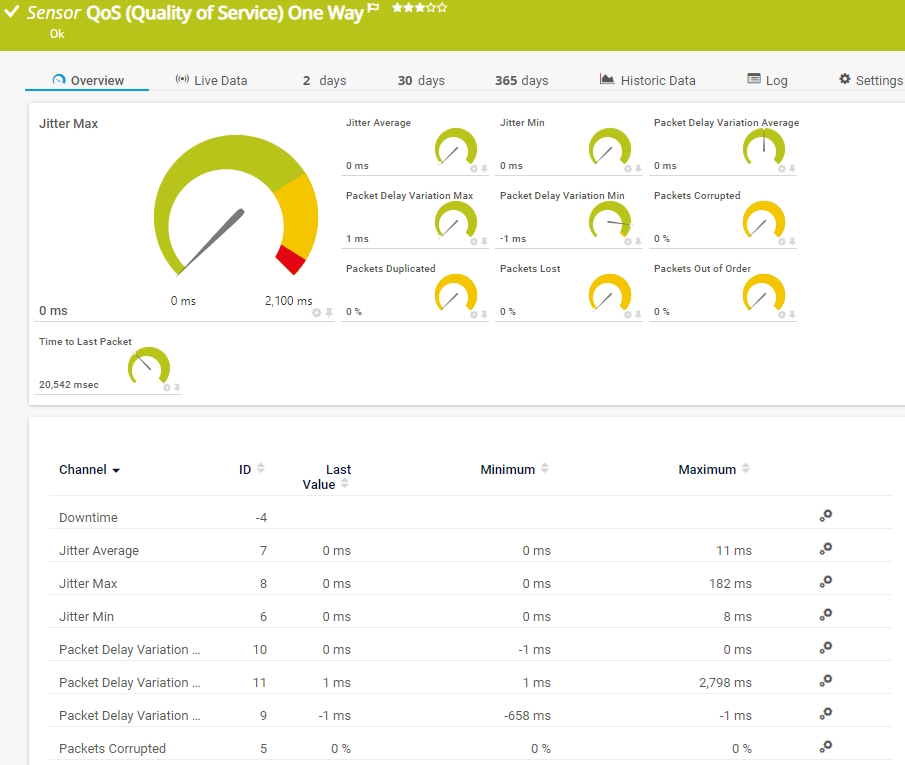
O sensor Unidirecional QoS (qualidade de serviço) monitora os parâmetros relativos à qualidade de uma conexão de rede entre duas sondas. Ele pode mostrar o seguinte:
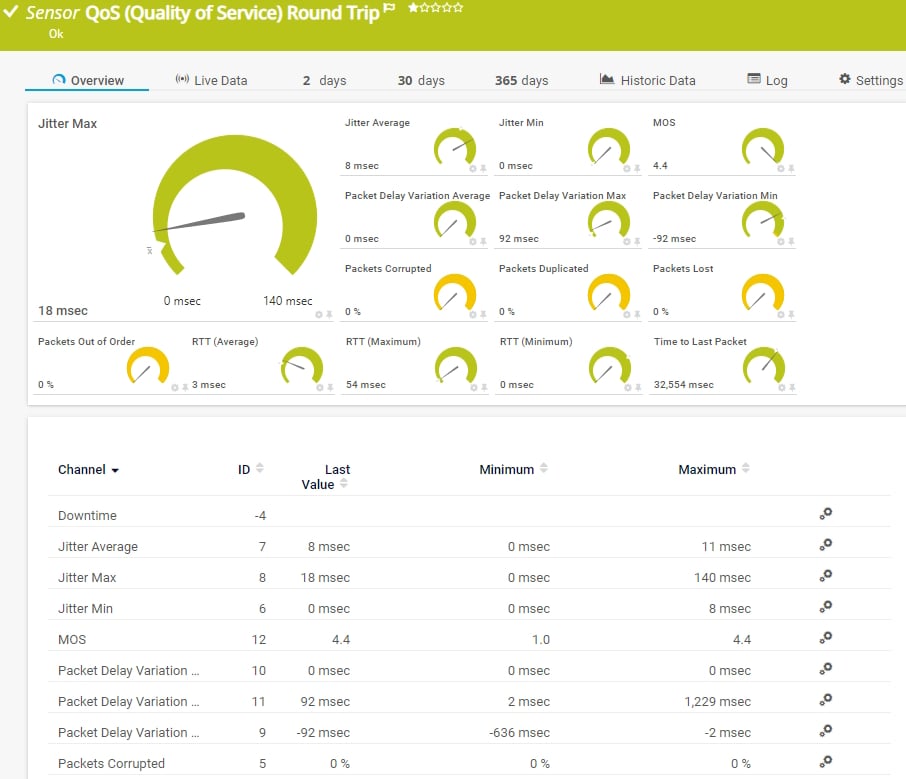
O sensor Ida e volta QoS (qualidade de serviço) monitora os parâmetros relativos à qualidade de uma conexão de rede entre duas sondas. Ele pode mostrar o seguinte:
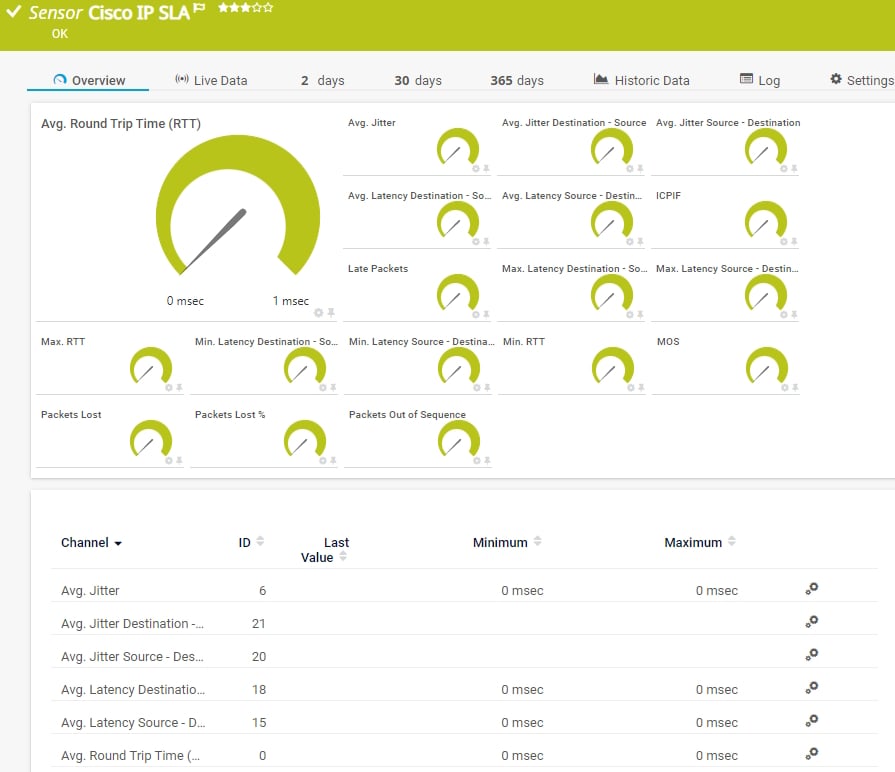
O sensor Cisco IP SLA monitora os parâmetros de rede de voz sobre IP (VoIP) usando os acordos de nível de serviço (SLA) de IP da Cisco. Ele pode mostrar o seguinte:
Consulte o Manual do PRTG para obter uma lista de todos os tipos de sensores disponíveis.

Os alertas personalizados e a visualização de dados permitem que você identifique e evite rapidamente os problemas de desempenho da rede.
O PRTG é configurado em questão de minutos e pode ser usado em uma ampla variedade de dispositivos móveis.


“Excelente ferramenta para monitoramento detalhado. Alarmes e notificações funcionam muito bem. A adição de equipamentos é simples e a configuração inicial do servidor é bem fácil. ...sinta-se tranquilo em comprá-lo se você pretende monitorar um grande cenário de rede.”
Em parceria com fornecedores de TI inovadores, a Paessler libera sinergias para criar benefícios novos e adicionais para os clientes associados.
A TI que funciona constitui uma base essencial para o sucesso de uma empresa. A disponibilidade e a segurança devem ser definidas para a respectiva finalidade e monitoradas de perto, tanto pela OT quanto pela TI.
A integração dos resultados de monitoramento do PRTG aos mapas do NetBrain constitui a base para a automação da rede.
Com o ScriptRunner, a Paessler integra uma poderosa plataforma de automação de eventos ao PRTG Network Monitor.
As notificações em tempo real significam uma solução de problemas mais rápida para que você possa agir antes que ocorram problemas mais sérios.
Software de monitoramento de rede – Versão 26.1.116.1532 (February 9th, 2026)
Download para Windows e versão baseada em nuvem do PRTG Hosted Monitor disponível
Inglês, alemão, espanhol, francês, português, holandês, russo, japonês e chinês simplificado
Dispositivos de rede, largura de banda, servidores, aplicativos, ambientes virtuais, sistemas remotos, IoT e muito mais
Escolha a assinatura do PRTG Network Monitor que é melhor para você


O jitter de rede é o desvio da quantidade média de tempo que um pacote de dados precisa para viajar do ponto de partida até o destino. Valores altos de jitter podem causar atrasos perceptíveis e erros de transmissão (como ruído de fundo e sinais de áudio defeituosos), principalmente quando se trata de serviços em tempo real, como VoIP. Nenhuma rede está completamente livre de jitter. O importante é que você mantenha o jitter em um nível mínimo.
Os testes de jitter de rede são uma boa maneira de verificar a qualidade de sua conexão. Entre outras coisas, esses testes o ajudarão a determinar se o seu provedor de serviços de Internet (ISP) está cumprindo os termos do seu contrato de nível de serviço (SLA) ou se é necessário aumentar a largura de banda.
O teste de jitter de rede do PRTG mede a variação do atraso do pacote, o jitter médio ao longo do tempo, a taxa de perda de pacotes, a latência e o tempo de ida e volta (RTT), os padrões de tráfego e o congestionamento de tráfego.
Sim. O PRTG pode testar o jitter em vários tipos de rede, incluindo sua LAN, WAN, redes virtuais e baseadas em nuvem, e muito mais.
Para VoIP e videoconferência, o ideal é que o jitter esteja abaixo de 30 milissegundos. Níveis mais altos podem causar interrupções perceptíveis.
Sim! O PRTG tem sensores específicos projetados para medir, monitorar e analisar o jitter. O PRTG como uma ferramenta de monitoramento de jitter ajuda a identificar e resolver problemas que causam atrasos, má qualidade de chamadas de áudio, vídeo e VoIP, velocidades de download lentas e outros problemas de desempenho.
No PRTG, “sensores” são os elementos básicos de monitoramento. Um sensor geralmente monitora um valor medido na sua rede, por exemplo, o tráfego em uma porta de switch, a carga de CPU de um servidor ou o espaço livre em uma unidade de disco. Em média, você precisa de 5-10 sensores por dispositivo ou um sensor por porta de switch.
A Paessler realizou testes em mais de 600 departamentos de TI em todo o mundo para sintonizar seu software de monitoramento de rede mais próximo às necessidades dos administradores. O resultado da pesquisa: mais de 95% dos participantes recomendaria PRTG – ou já o fizeram.

Paessler PRTG é usado por empresas de todos os tamanhos. Os administradores adoram PRTG porque ele facilita muito o trabalho.
Largura de banda, servidores, ambientes virtuais, websites, serviços VoIP – PRTG monitora toda a sua rede.
As necessidades de monitoramento variam. Por isso deixamos você experimentar PRTG gratuitamente. Comece agora mesmo o seu período de testes.