
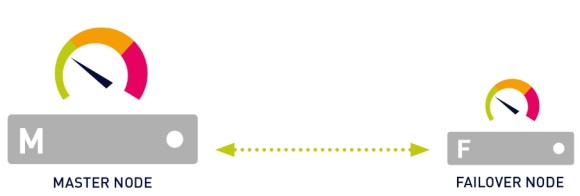
PRTG est doté d'un cluster de basculement intégré pour une supervision à haute disponibilité. Un cluster de basculement se compose de deux installations distinctes du serveur central PRTG, l'une faisant office de nœud maître et l'autre de nœud de basculement.
PRTG inclut un seul cluster de basculement avec chaque licence, que vous utilisiez l'édition freeware ou une édition commerciale de PRTG Network Monitor. La fonction de cluster n'est pas disponible dans PRTG Hosted Monitor.
Dans ce guide pratique, nous vous montrons comment configurer un cluster de basculement unique en 6 étapes.
Avant de mettre en place votre cluster, vous devez prendre en compte les exigences suivantes :
Pour des exigences plus détaillées et des informations plus approfondies, voir le Manuel de PRTG : Configuration du cluster de basculement.
Bénéficiez d’une visibilité complète grâce aux tableaux de bord en temps réel, aux alertes et aux capteurs personnalisables
Choisissez le serveur central PRTG qui fera office de nœud maître du cluster. Si vous disposez d'une installation PRTG qui fonctionne depuis un certain temps, faites de ce serveur central PRTG votre nœud maître afin de conserver votre configuration de supervision.
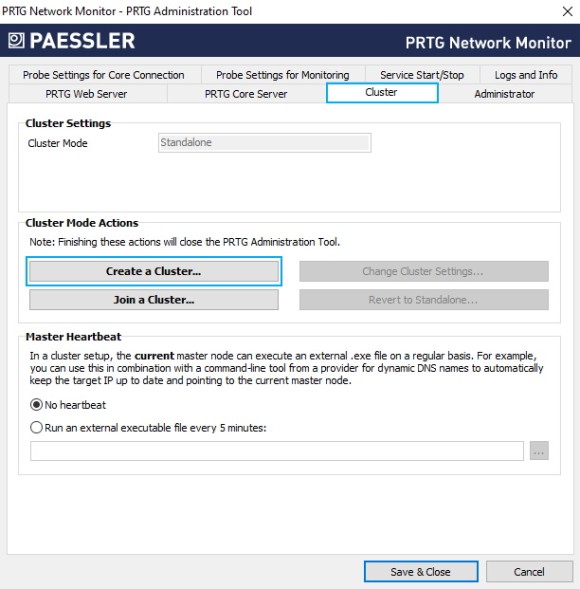
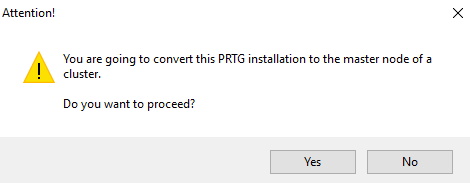
6. Cliquez sur Créer un cluster et confirmez le message d'avertissement par Oui.
7. Saisissez un port de cluster ou laissez la valeur par défaut. Le port doit être ouvert à la fois sur le nœud maître et sur le nœud de basculement.
8. Saisissez une clé d'accès au cluster ou laissez la valeur par défaut. La clé d'accès au cluster doit être unique. Les deux nœuds du cluster doivent utiliser la même clé d'accès au cluster.
9. Enregistrez la clé d'accès au cluster pour une utilisation ultérieure.
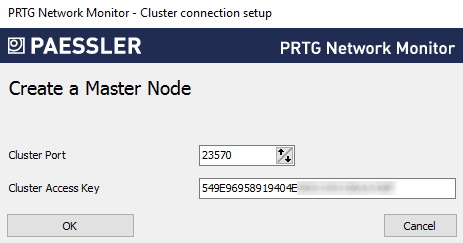
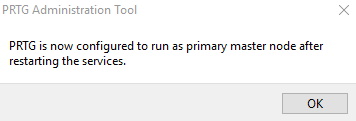
10. Cliquez sur OK et confirmez le message qui s'affiche par OK pour redémarrer les services Windows et convertir le serveur central PRTG pour qu'il agisse en tant que nœud maître du cluster.
Après avoir configuré le nœud maître, vous devez également configurer le nœud de basculement.
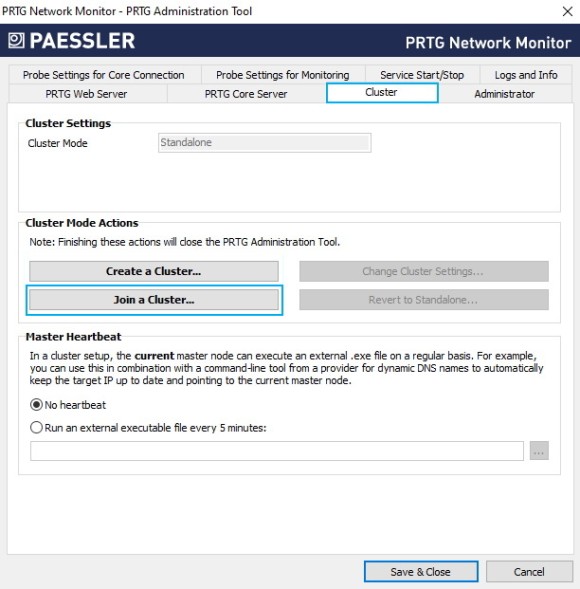
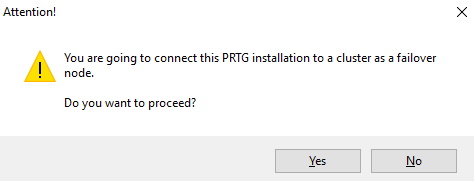
6. Cliquez sur Join a Cluster et confirmez le message d'avertissement en cliquant sur Yes (Oui).
7. Sous Nœud maître (adresse IP/nom DNS), entrez l'adresse IP ou le nom DNS du nœud maître que vous avez précédemment configuré.
8. Assurez-vous que le port de cluster correspond au port que vous avez précédemment configuré pour le nœud maître.
9. Saisissez ou collez la clé d'accès au cluster que vous avez précédemment configurée pour le nœud maître.
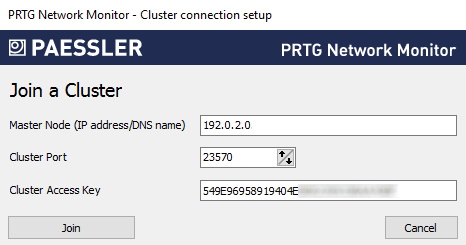
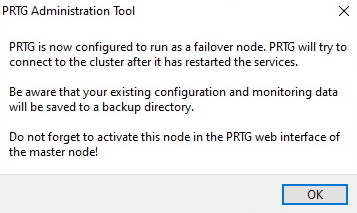
10. Cliquez sur Joindre et confirmez le message qui s'affiche en cliquant sur OK pour redémarrer les services Windows et convertir le serveur central PRTG pour qu'il agisse en tant que nœud de basculement du cluster.
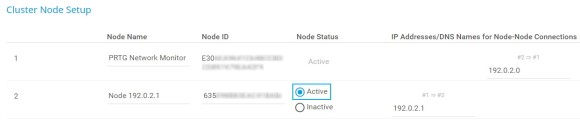
Maintenant que vous avez configuré le nœud maître et le nœud basculement, vous devez confirmer le nœud basculement en lui attribuant le statut Actif dans les paramètres du nœud maître.
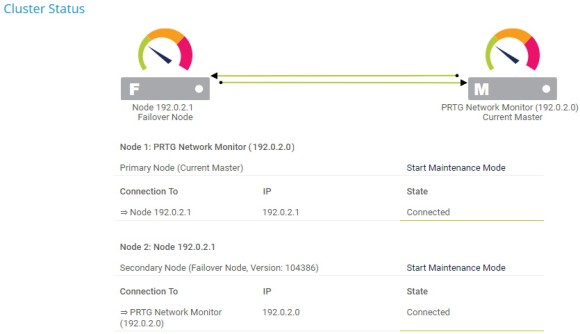
Assurez-vous que le nœud maître et le nœud de basculement sont connectés en vérifiant l'état du cluster.
Si les deux nœuds du cluster ont des problèmes de connexion, vérifiez les fichiers logs suivants pour tout message d'erreur connexe :
Assurez-vous également qu'aucun pare-feu ne bloque la connexion entre le nœud maître et le nœud basculement via le port de cluster spécifié, et ce des deux côtés. Si nécessaire, définissez des règles NATS pour votre réseau. Voir aussi Comment connecter PRTG à travers un pare-feu en 4 étapes.
Les alertes personnalisées et la visualisation des données vous permettent d'identifier et de prévenir rapidement toutes sortes de problèmes.
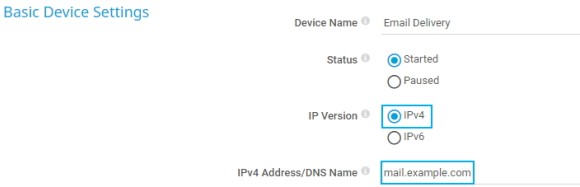
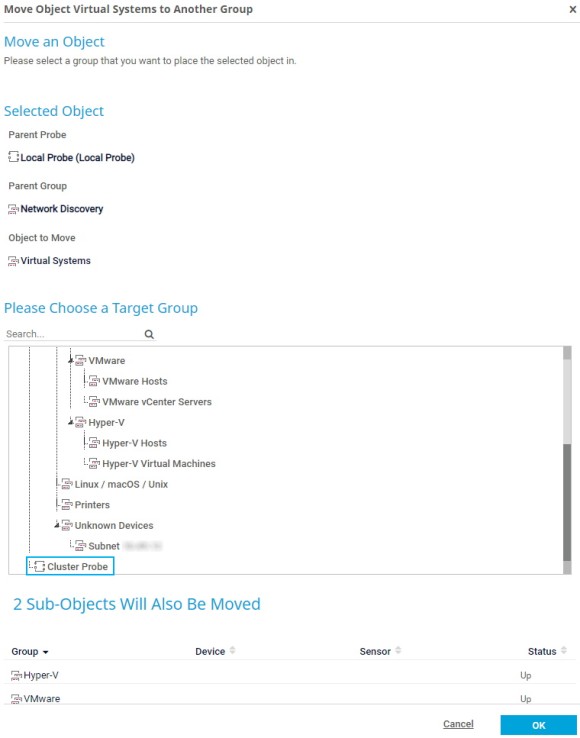
Après avoir configuré le cluster de basculement, vous devez déplacer vos objets de supervision de la sonde locale vers la sonde de cluster. Cette opération est nécessaire car PRTG ne peut superviser que les objets situés sur la sonde cluster via tous les nœuds du cluster.
PRTG transfère automatiquement les cartes et les fichiers de recherche personnalisés vers le nœud de basculement lors du démarrage du nœud maître. Cependant, vous devez recharger manuellement les fichiers de consultation personnalisés à la fois sur le nœud maître et sur le nœud basculement. Consultez également notre guide Comment travailler avec les fichiers de consultation dans PRTG.
En outre, vous devez copier manuellement d'autres fichiers personnalisés depuis les sous-dossiers suivants du répertoire programme PRTG sur le nœud maître vers les sous-dossiers respectifs du répertoire programme PRTG sur le nœud basculement :
Vous pouvez à tout moment ajouter des nœuds de basculement au cluster. Gardez toutefois à l'esprit que vous avez besoin d'une clé de licence supplémentaire si vous souhaitez exécuter deux ou trois nœuds de basculement, et de deux clés de licence supplémentaires si vous souhaitez exécuter quatre nœuds de basculement.
Dans l'ensemble, un cluster de basculement peut se composer d'un maximum de 5 nœuds de cluster : un nœud maître et jusqu'à quatre nœuds de basculement.
Gardez également à l'esprit les considérations relatives aux performances mentionnées au début de ce guide pratique.

