Os alertas personalizados e a visualização de dados permitem que você identifique e evite rapidamente dados corrompidos, erros de hardware, pouco espaço em disco e outros problemas de desempenho do banco de dados.
Os bancos de dados SQL são uma parte absolutamente crítica de sua rede.
Eles mantêm seus dados precisos, consistentes e confiáveis, e os aplicativos, e os serviços funcionando com eficiência. Mais importante ainda, eles garantem que sua organização funcione sem problemas (e que seus colegas e chefes fiquem felizes).
Não deixe que dados corrompidos, configurações incorretas e outros problemas de banco de dados derrubem sua rede. Com o poderoso software de monitoramento de rede da Paessler PRTG, você pode manter consistentemente uma ótima disponibilidade e desempenho ideais.

Todas as estatísticas de integridade do seu banco de dados em um só lugar. Obtenha uma visão geral abrangente de status do hardware disponibilidade, tempos de execução, velocidade de leitura/gravação, espaço em disco, memória e outras informações importantes sobre o desempenho do banco de dados e prepare relatórios para seus superiores com apenas alguns cliques.
Deseja monitorar parâmetros específicos usando consultas SQL autodefinidas? Precisa criar relatórios personalizados ou otimizar processos de negócios? O PRTG tem tudo o que você precisa. Nosso software de monitoramento Oracle é flexível por design, para que você possa escolher o que rastrear e como os dados são apresentados.
Quando se trata da saúde de sua rede, prevenir é sempre melhor do que remediar. O PRTG identifica problemas potenciais antes que eles se tornem erros críticos. Isso significa que eles são mais fáceis e mais rápidos de corrigir, poupando-lhe estresse e frustração (e chamadas irritadas de colegas irritados).
Diagnosticar problemas de rede rastreando continuamente os servidores de banco de dados Oracle em sua rede. Mostre tempos de resposta, tempos de espera, espaço em disco, sessões ativas e outras métricas de desempenho em tempo real. Visualize os dados de monitoramento em gráficos e painéis claros para identificar problemas mais facilmente. Obtenha a Visão Geral necessária para solucionar erros de configuração, baixo desempenho e outros problemas com suas instâncias Oracle para melhorar a experiência do usuário final.

Visualização em árvore de dispositivos da configuração completa de monitoramento

Painel PRTG personalizado para manter um olho em toda a infraestrutura de TI
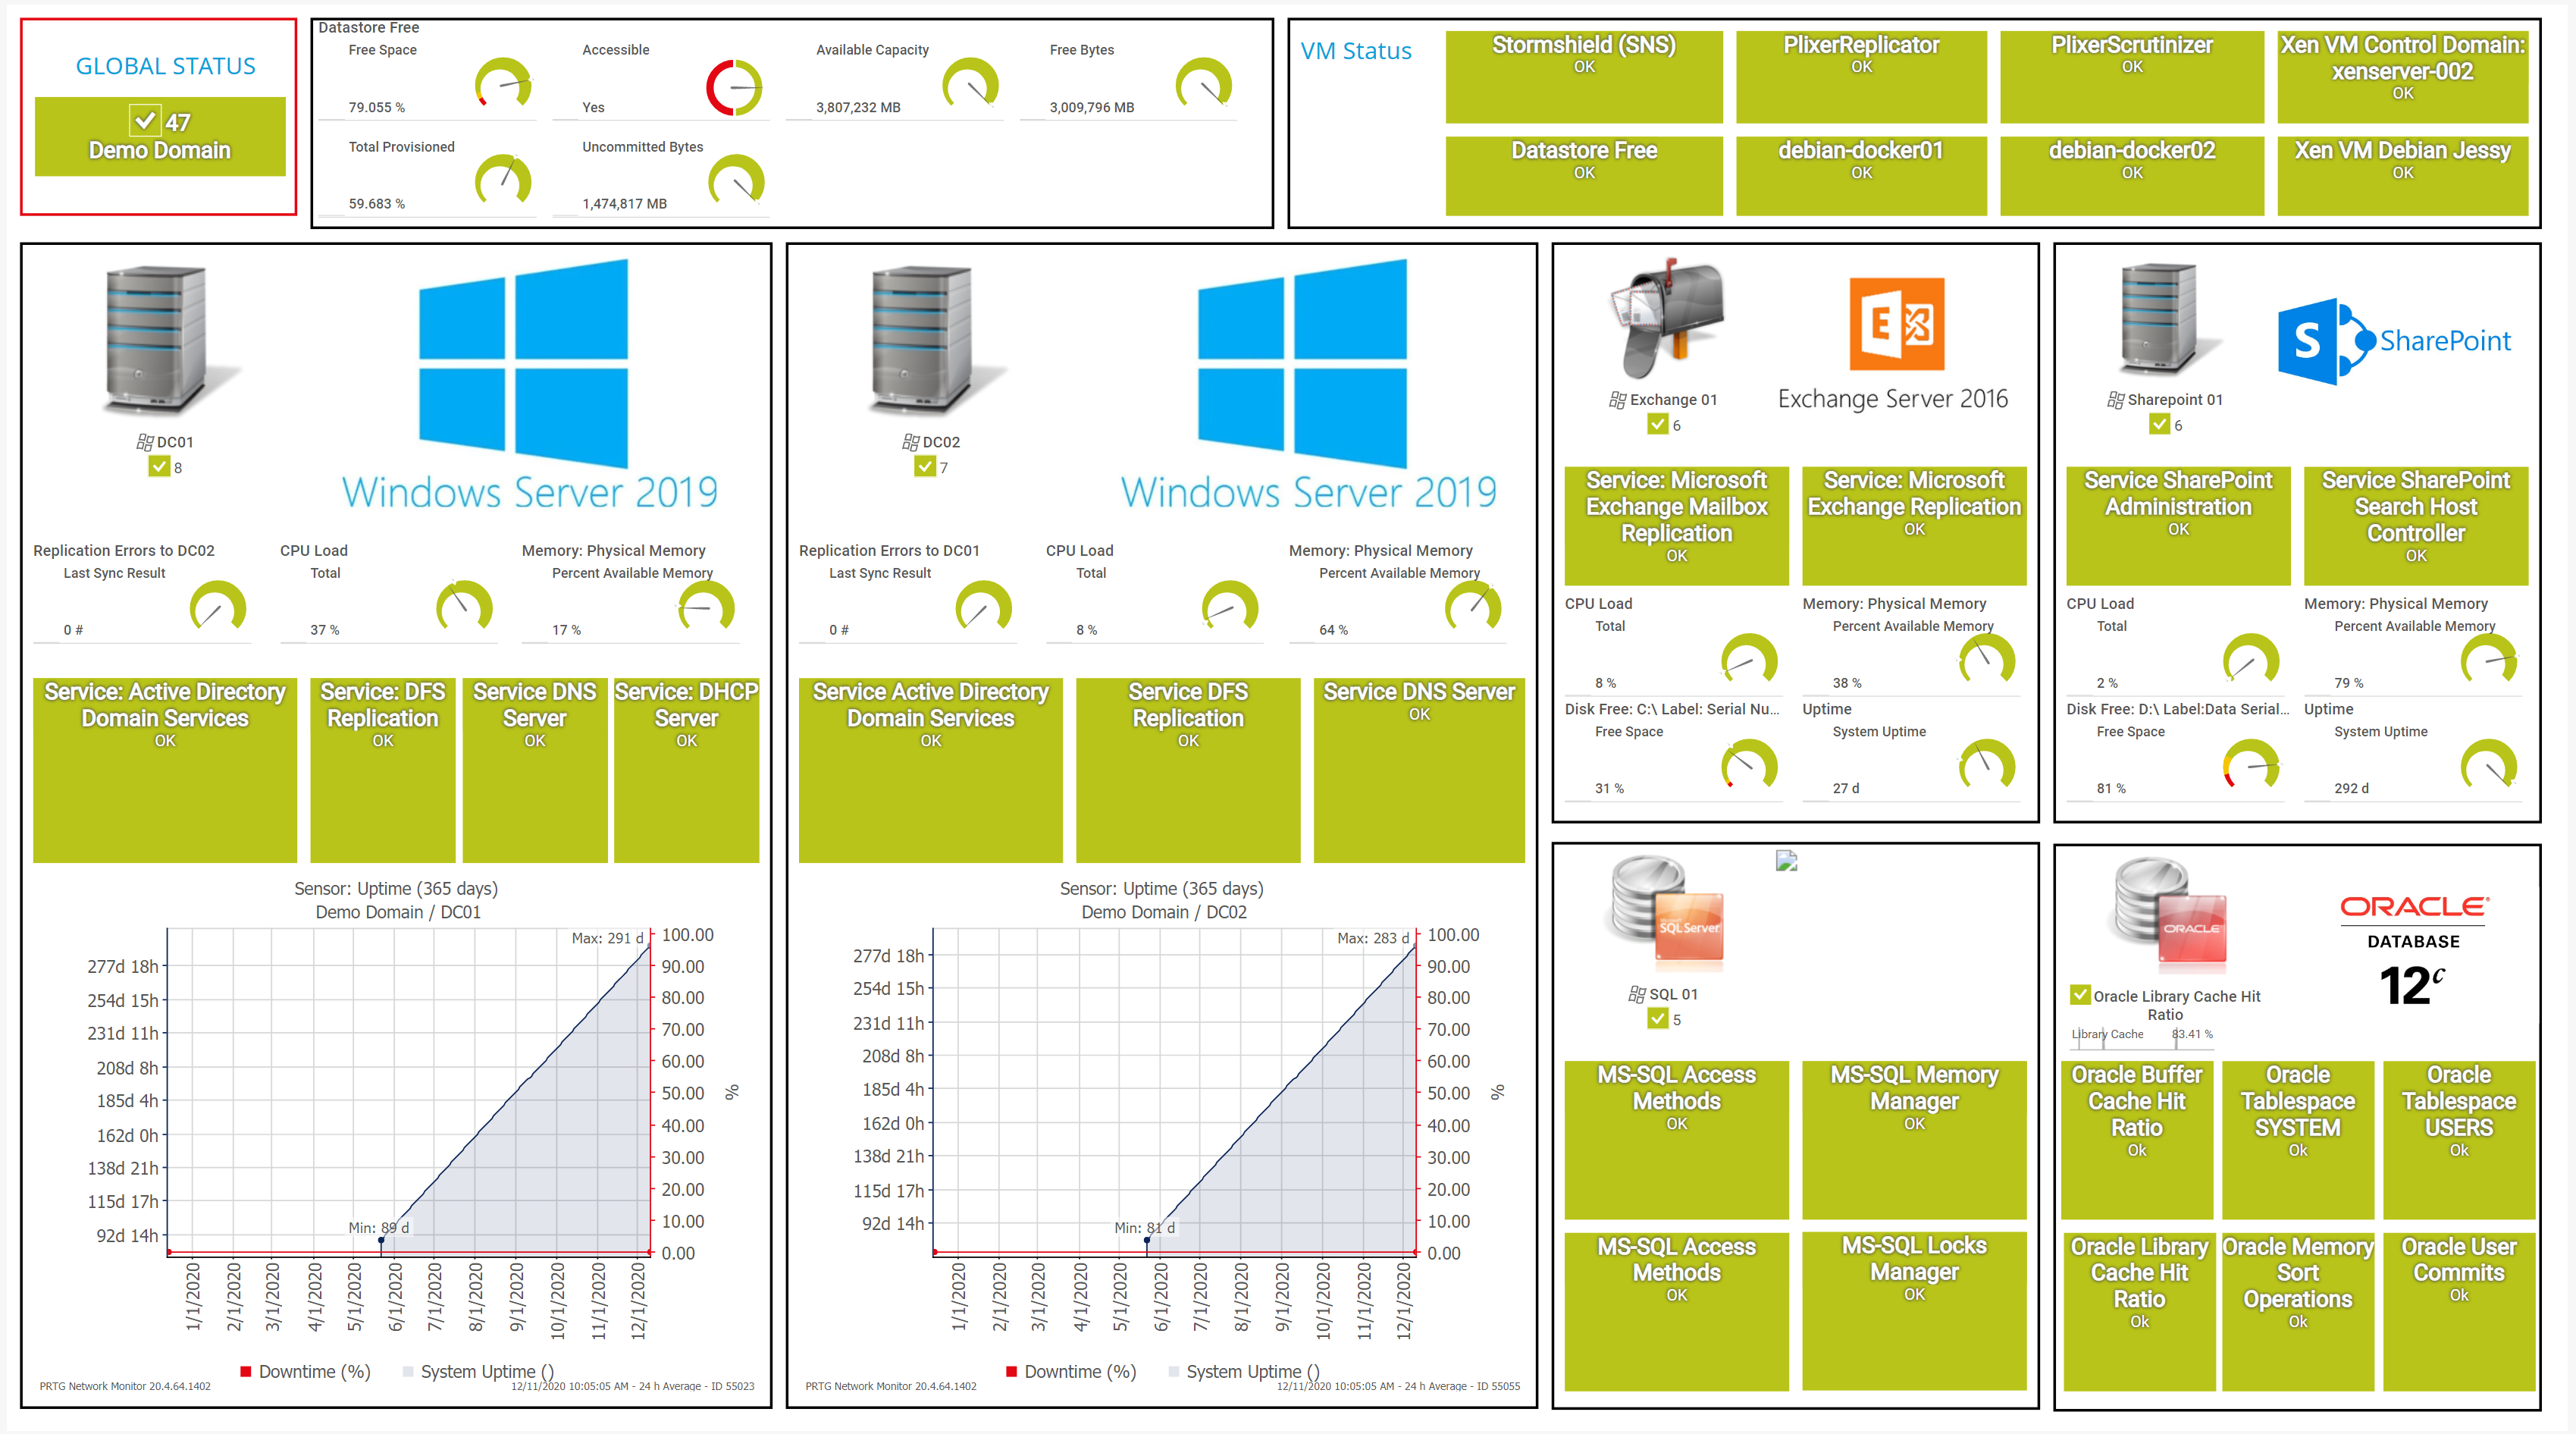
Painel PRTG personalizado para manter um olho em toda a infraestrutura de TI
“Ganha tudo monitor
de rede”
“A verdadeira beleza do PRTG são as infinitas possibilidades que oferece”
“O PRTG Network Monitor é muito difícil de ser superado”
O PRTG vem com mais de 250 tipos de sensores nativos para monitorar todo o seu ambiente local, na nuvem e na nuvem híbrida. Confira alguns exemplos abaixo!
O sensor Oracle SQL v2 monitora um banco de dados em um servidor Oracle e executa uma consulta. Ele pode mostrar o seguinte:
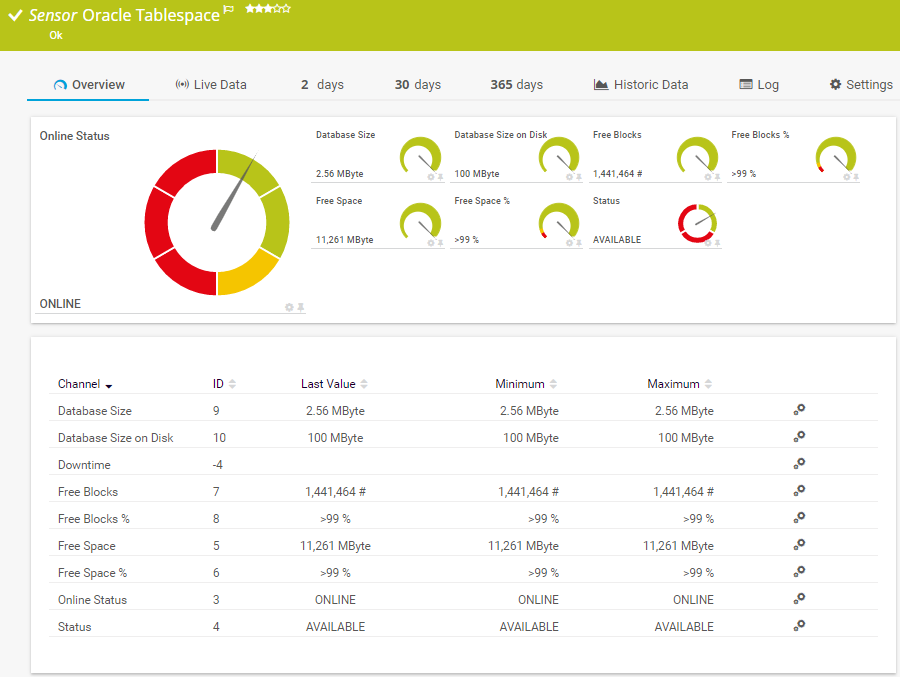
O sensor Oracle Tablespace monitora um tablespace em um servidor Oracle. Ele pode mostrar o seguinte:
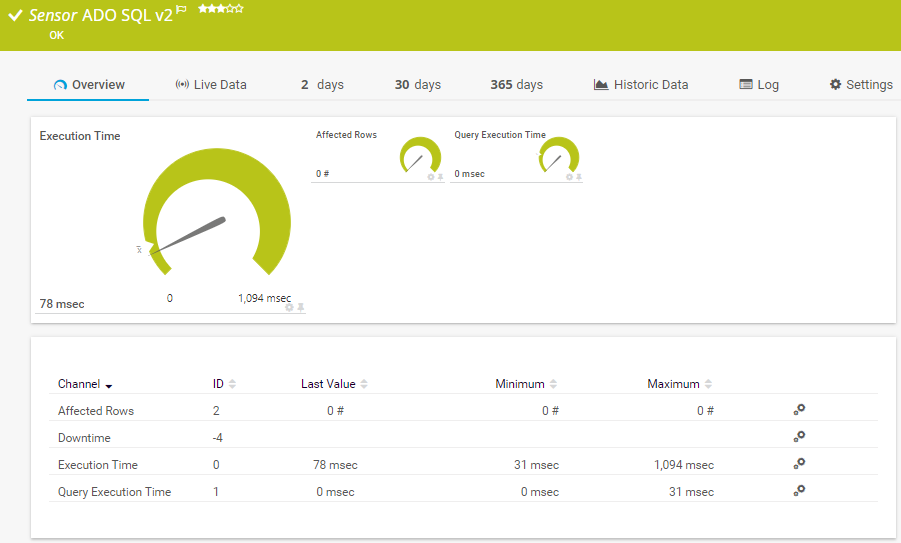
O sensor ADO SQL v2 monitora um banco de dados por meio de uma conexão ActiveX Data Objects (ADO) e executa uma consulta SQL. Ele pode mostrar o seguinte: - Número de linhas que foram abordadas pela consulta
Consulte o Manual do PRTG para obter uma lista de todos os tipos de sensores disponíveis.

Os alertas personalizados e a visualização de dados permitem que você identifique e evite rapidamente dados corrompidos, erros de hardware, pouco espaço em disco e outros problemas de desempenho do banco de dados.
O PRTG é configurado em questão de minutos e pode ser usado em uma ampla variedade de dispositivos móveis.


“Excelente ferramenta para monitoramento detalhado. Alarmes e notificações funcionam muito bem. A adição de equipamentos é simples e a configuração inicial do servidor é bem fácil. ...sinta-se tranquilo em comprá-lo se você pretende monitorar um grande cenário de rede.”
Em parceria com fornecedores de TI inovadores, a Paessler libera sinergias para criar benefícios novos e adicionais para os clientes associados.
A combinação do amplo conjunto de recursos de monitoramento do PRTG com a garantia de rede automatizada do IP Fabric cria um novo nível de visibilidade e confiabilidade da rede.
A Siemon e a Paessler reúnem tecnologia de construção inteligente e monitoramento avançado e tornam realidade sua visão de edifícios e data centers inteligentes.
O UVexplorer integra-se perfeitamente ao PRTG para proporcionar descoberta de rede rápida e precisa, inventário detalhado de dispositivos e mapeamento automático de rede para a plataforma PRTG.
As notificações em tempo real significam uma solução de problemas mais rápida para que você possa agir antes que ocorram problemas mais sérios.
Software de monitoramento de rede – Versão 26.1.116.1532 (February 9th, 2026)
Download para Windows e versão baseada em nuvem do PRTG Hosted Monitor disponível
Inglês, alemão, espanhol, francês, português, holandês, russo, japonês e chinês simplificado
Dispositivos de rede, largura de banda, servidores, aplicativos, ambientes virtuais, sistemas remotos, IoT e muito mais
Escolha a assinatura do PRTG Network Monitor que é melhor para você


Um Sistema de Gerenciamento de Banco de Dados Relacional (RDBMS) é um tipo de sistema de gerenciamento de banco de dados (DBMS) que organiza os dados em tabelas com linhas e colunas, em que cada linha representa um registro e cada coluna representa um atributo ou campo específico.
Os RDBMSs usam a linguagem de consulta estruturada (SQL) para gerenciar e consultar dados. Eles oferecem mecanismos para garantir a integridade e a consistência dos dados por meio de recursos como transações, restrições e integridade referencial.
O PRTG é uma ferramenta de software proprietária que rastreia a saúde e o desempenho dos bancos de dados Oracle e de outros componentes importantes de sua rede corporativa. Disponível para servidores Windows e Linux servidores ou como hospedado em nuvem SaaS hospedado na nuvem, ele é capaz de monitorar um número ilimitado de servidores locais, remoto e virtuais reunindo dados críticos do sistema em uma interface simples e intuitiva que pode ser acessada de qualquer lugar: no escritório, em casa ou em trânsito.
Sim. O PRTG tem sensores pré-configurados para a maioria dos principais fornecedores de banco de dados SQL, incluindo Microsoft SQL, MySQL e PostgreSQL. E se você precisar melhorar a funcionalidade do Paessler PRTG e se beneficiar de um monitoramento de banco de dados ainda mais avançado, confira a nossa nova extensão de produto observador de banco de dados PRTG.
O uso do software de monitoramento da Oracle, como o PRTG, tem vários benefícios, por exemplo:
Em um banco de dados SQL, os dados são organizados em tabelas, cada uma com colunas e tipos de dados predefinidos. A SQL (Structured Query Language, Linguagem de Consulta Estruturada) é usada para definir, manipular e consultar os dados. Quando uma consulta é executada, o sistema de gerenciamento de banco de dados (DBMS) interpreta e otimiza as instruções SQL para interagir com os dados subjacentes.
O DBMS processa as consultas usando algoritmos para recuperar, atualizar ou excluir registros com eficiência. Além disso, os bancos de dados SQL impõem a integridade dos dados por meio de restrições como chaves primárias, chaves estrangeiras e restrições exclusivas, garantindo a consistência e a confiabilidade dos dados armazenados.
No PRTG, “sensores” são os elementos básicos de monitoramento. Um sensor geralmente monitora um valor medido na sua rede, por exemplo, o tráfego em uma porta de switch, a carga de CPU de um servidor ou o espaço livre em uma unidade de disco. Em média, você precisa de 5-10 sensores por dispositivo ou um sensor por porta de switch.
A Paessler realizou testes em mais de 600 departamentos de TI em todo o mundo para sintonizar seu software de monitoramento de rede mais próximo às necessidades dos administradores. O resultado da pesquisa: mais de 95% dos participantes recomendaria PRTG – ou já o fizeram.

Paessler PRTG é usado por empresas de todos os tamanhos. Os administradores adoram PRTG porque ele facilita muito o trabalho.
Largura de banda, servidores, ambientes virtuais, websites, serviços VoIP – PRTG monitora toda a sua rede.
As necessidades de monitoramento variam. Por isso deixamos você experimentar PRTG gratuitamente. Comece agora mesmo o seu período de testes.