Easily receive and analyze
SNMP traps with Paessler PRTG
- Instantly know when critical events occur in your network
- Configure specific SNMP trap messages to trigger custom notifications
- Easily see SNMP trap statistics for your network in one place
PRTG SNMP trap message monitoring: What you’ll find on this page
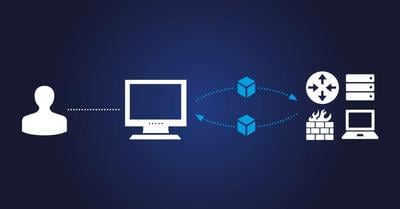
PRTG makes monitoring your SNMP trap messages easy
Custom alerts and data visualization make it easy to monitor, identify, and prevent SNMP trap issues.
4 ways our SNMP trap analyzer PRTG helps you monitor trap messages
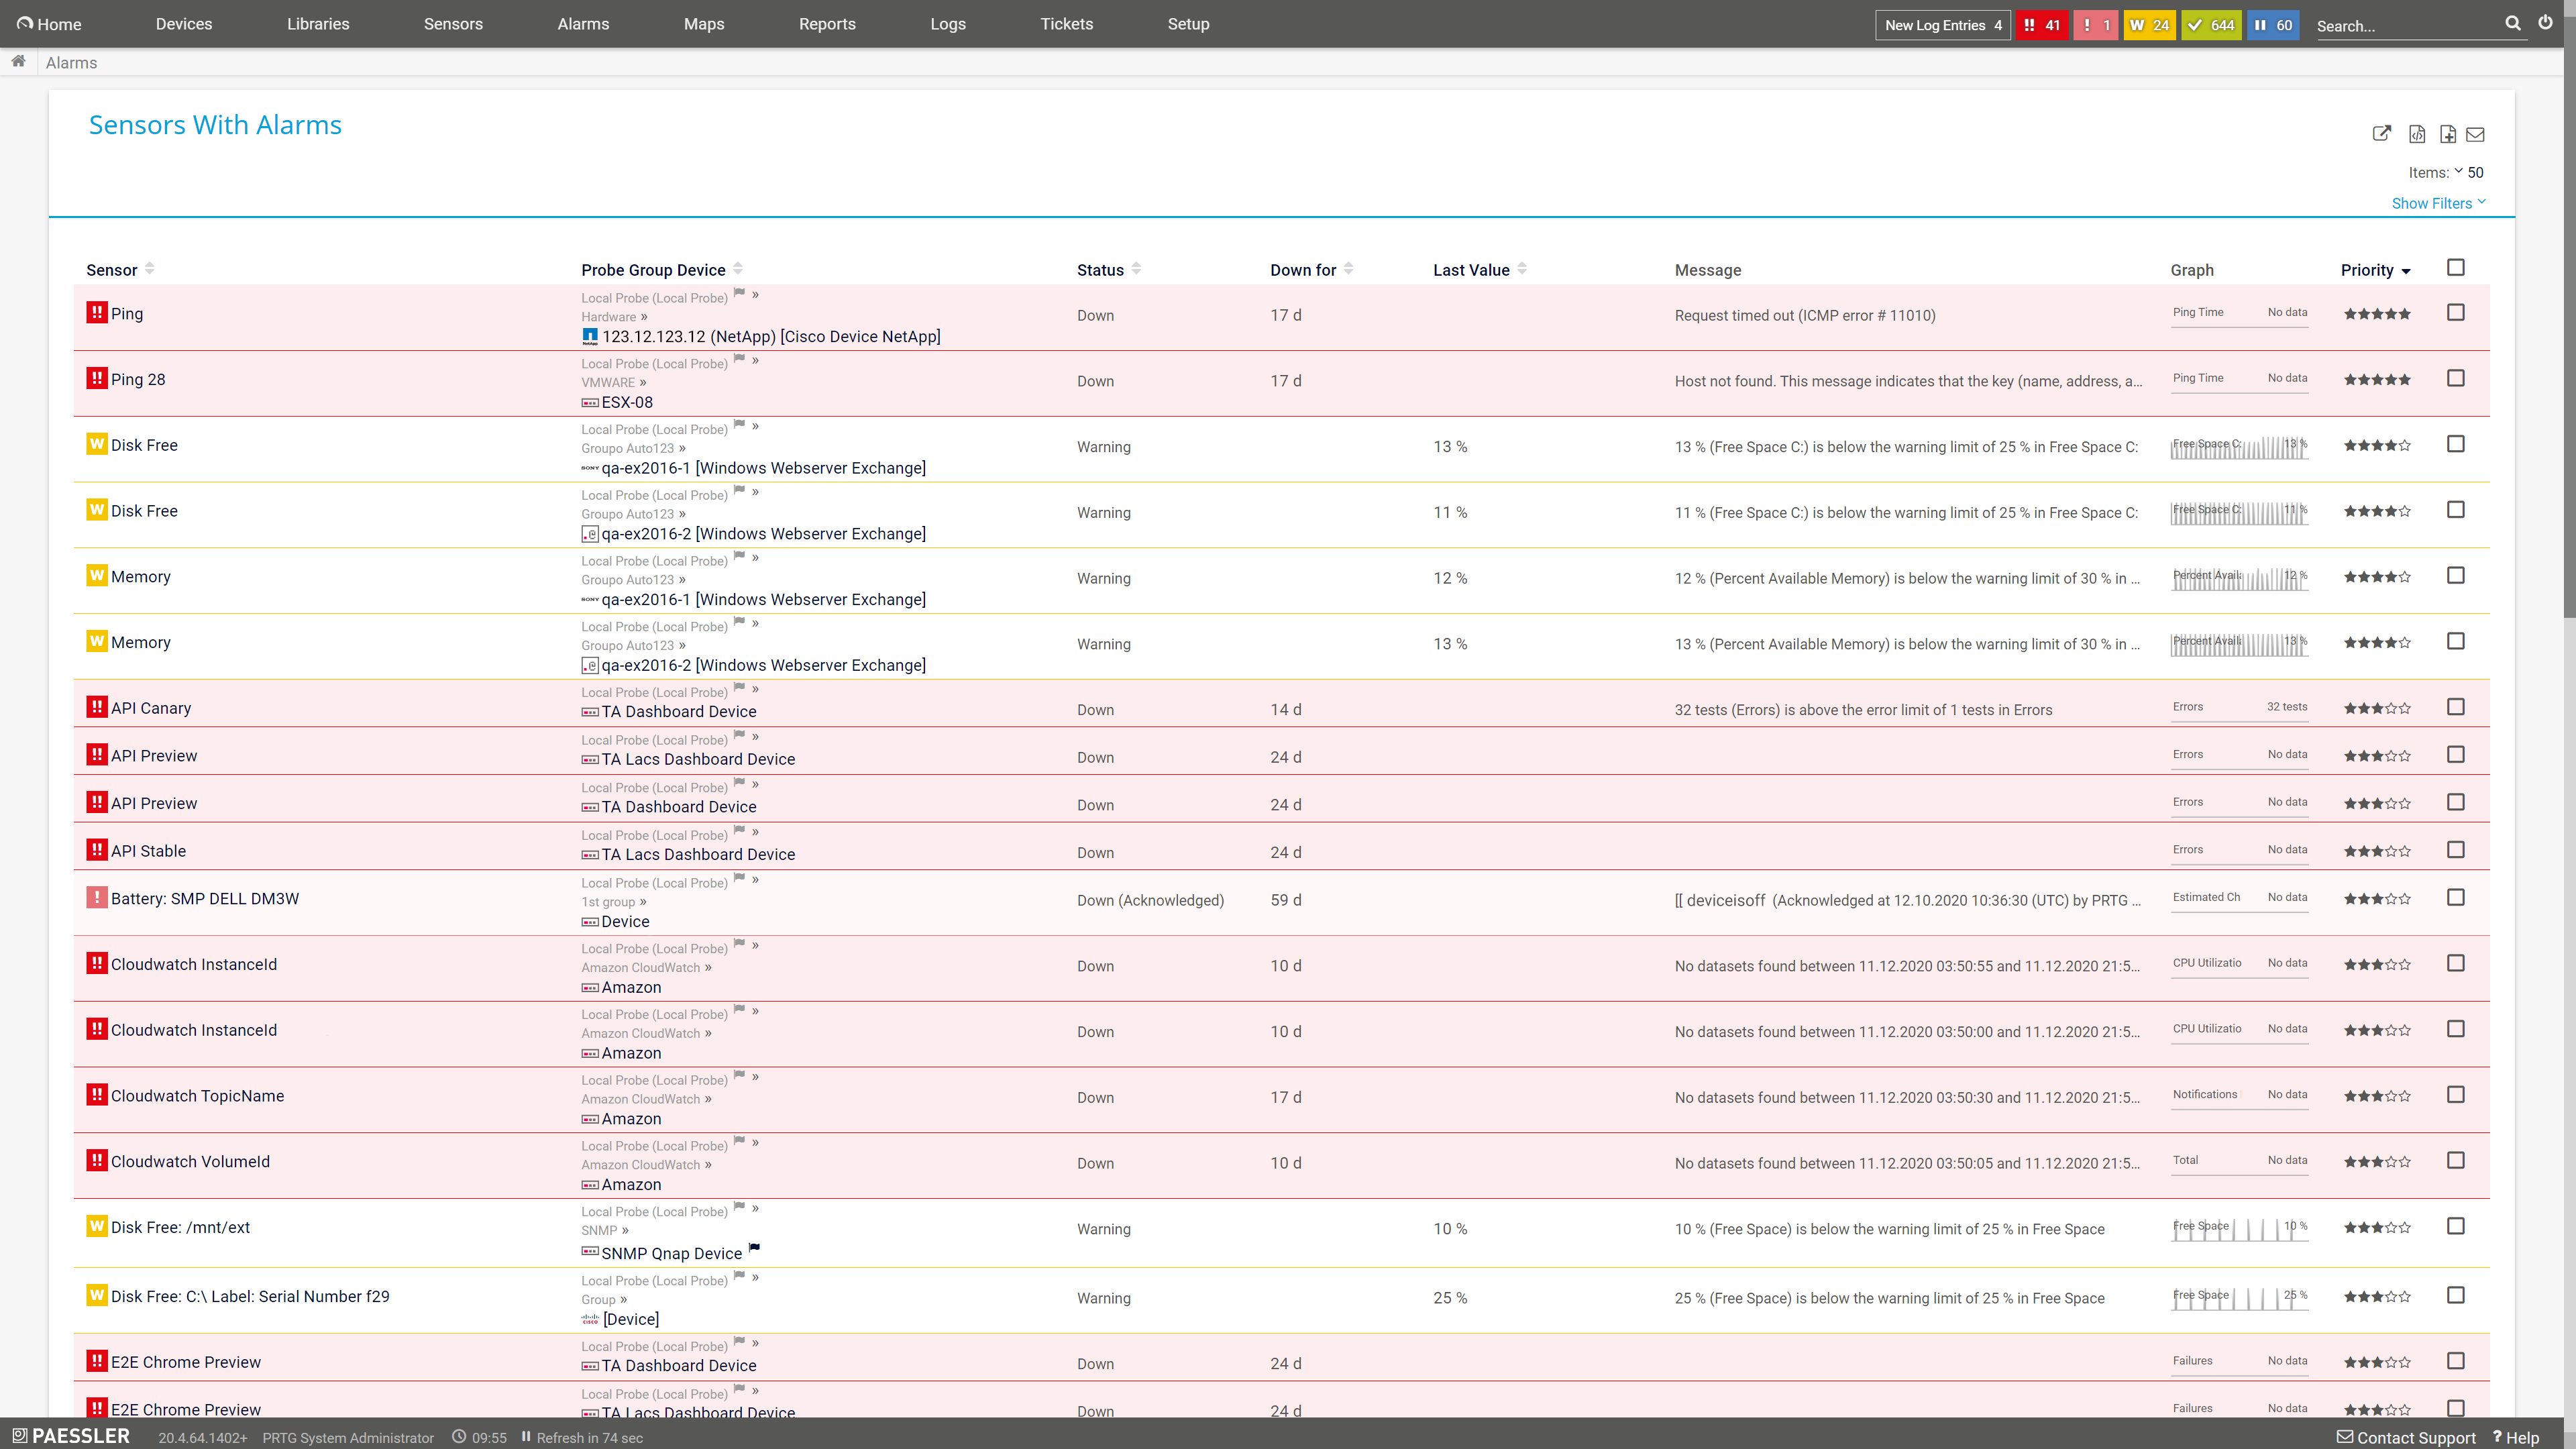
Central overview of SNMP trap messages
Paessler PRTG can collect all SNMP trap messages that are sent in your network, giving you a central overview of everything. Filter the traps by date, source, agents, and more to analyze your trap messages quickly and easily.
Immediate alerts and custom notifications
Define SNMP trap messages that represent critical events in your network and configure PRTG to trigger alerts when they occur. You can choose between several notification methods. This way, your IT teams know immediately when issues arise.
SNMP trap monitoring right out the box
With the preconfigured SNMP Trap Receiver sensor in PRTG, it’s fast and easy to start monitoring your SNMP trap messages. Just configure the target device so it can send SNMP traps, then add the sensor in PRTG and define the filters you need.
Flexible SNMP trap message monitoring
You can decide if you want to receive all SNMP trap messages generated in your network, or if you want to only receive certain message types or messages from specific devices. This helps you reduce alert noise and focus on what really matters.
What SNMP trap monitoring looks like in PRTG
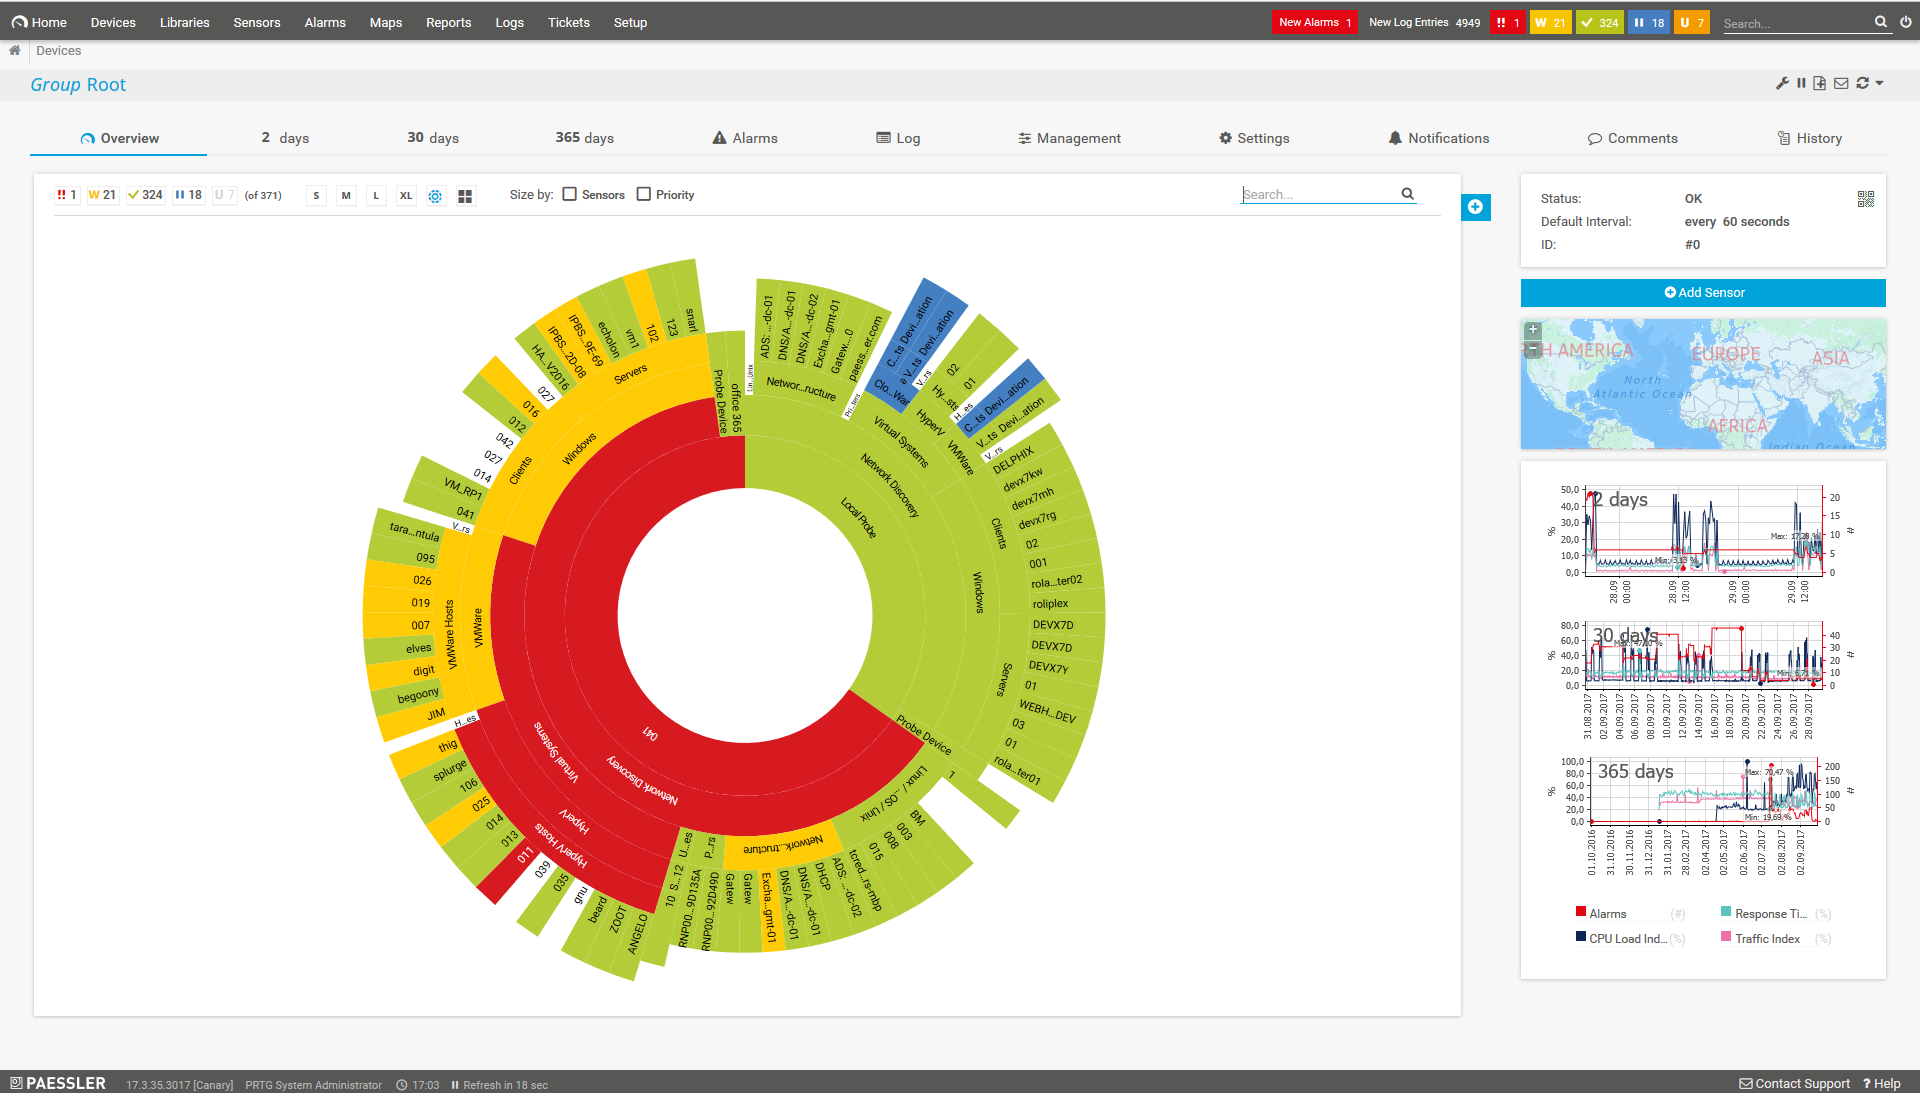
Diagnose network issues by continuously receiving and analyzing SNMP trap messages. Show the status of SNMP traps in real time and visualize data in graphic maps & dashboards to identify problems more easily. Get alerted when SNMP trap messages communicate critical events.
Start monitoring SNMP traps with PRTG and see how it can make your network more reliable and your job easier.
PRTG as an SNMP trap receiver: powerful SNMP trap monitoring tool
How PRTG defines sensors
In PRTG, “sensors” are the basic monitoring elements. One sensor usually monitors one measured value in your network, e.g. the traffic of a switch port, the CPU load of a server, the free space of a disk drive. On average you need about 5-10 sensors per device or one sensor per switch port.
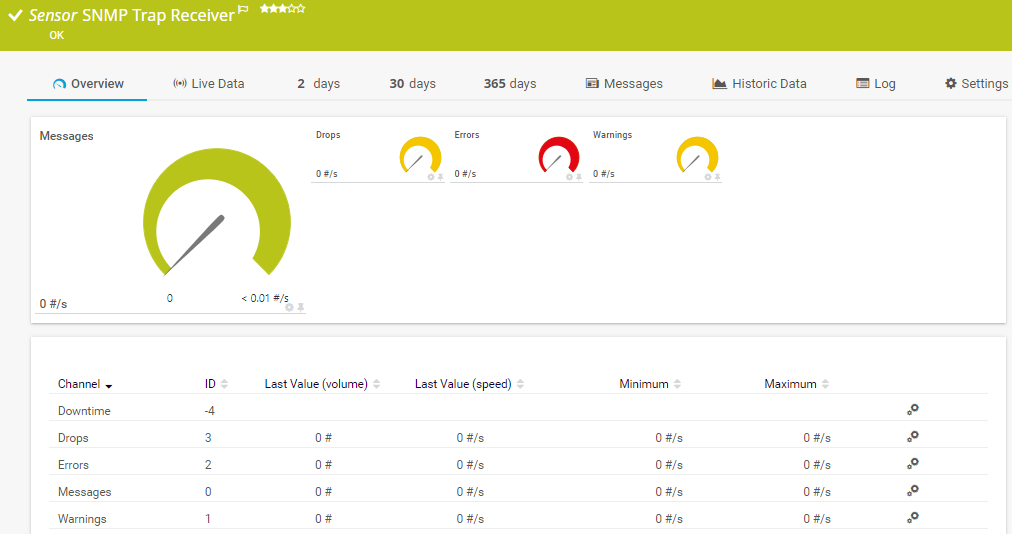
The PRTG SNMP Trap Receiver sensor gives you all the information you need to make sense of what is going on in your network:
- View and analyze each individual SNMP trap message, including the source, agent, bindings, and more
- Customize the view of your SNMP trap messages by using comprehensive filters
- See SNMP trap statistics, such as the total number of messages received, the number of messages dropped, errors, and more.
- Get real-time alerts when SNMP trap messages that indicate critical events are received
For more details on how to set up SNMP trap monitoring and how it works with PRTG, watch our tutorial video below.
Easily find the source of the problem with our PRTG SNMP trap receiver solution
Real-time alerts and custom notifications make it easy to solve issues with SNMP trap monitoring.
PRTG is compatible with all major vendors, products, and systems
Your SNMP trap monitor at a glance – even on the go
Set up PRTG in minutes and use it on almost any mobile device.


Start monitoring SNMP traps with PRTG and see how it can make your network more reliable and your job easier.
Not just an SNMP trap receiver tool: PRTG can do way more for you
SNMP monitoring
PRTG comes with several preconfigured SNMP sensors, some of which have been designed especially for device manufacturers such as Cisco, Dell, and HPE. Keep an eye on the availability, health, and performance of your hardware.
Syslog monitoring
With PRTG, you can not only receive and analyze SNMP traps, but also syslog messages. Use PRTG as a kind of syslog server to collect all syslog messages sent from your system, and filter them according to granular rules to only be alerted to issues that matter.
Network traffic monitoring
Find out which applications and servers are putting the greatest strain on your network’s bandwidth. Monitor systems, devices, and applications and analyze your network traffic in detail using technologies like SNMP, packet sniffing, or flow protocols (NetFlow, jFlow, sFlow, IPFIX).
“Excellent tool for detailed monitoring. Alarms and notifications work greatly. Equipment addition is straight forward and server initial setup is very easy. ...feel safe to purchase it if you intend to monitor a large networking landscape.”
Infrastructure and Operations Engineer in the Communications Industry, firm size 10B - 30B USD
Create innovative solutions with Paessler’s partners
Partnering with innovative vendors, Paessler unleashes synergies to create
new and additional benefits for joined customers.
With ScriptRunner, Paessler integrates a powerful event automation platform into PRTG Network Monitor.
ScriptRunner
PRTG makes monitoring your SNMP trap messages easy
Custom alerts and data visualization make it easy to monitor, identify, and prevent SNMP trap issues.
Monitoring SNMP trap messages: FAQ
1. What is an SNMP trap?
SNMP traps are one of the oldest standards for network equipment fault notification, and most network devices with basic management capabilities support SNMP traps. When a device detects an error or a change, the device sends a notification to one or more trap receivers.
2. What does an SNMP trap contain?
SNMP packets consist of a packet header, a PDU header, and a PDU body. For trap messages, the information sent in the PDU header can vary. The PDU header of an SNMP trap packet contains the packet types, the OID of the device, the IP address of the sender, general and company-specific IDs, and the time the trap event occurred. The actual values are sent in the PDU body.
3. How can I receive SNMP traps?
An SNMP Trap Receiver collects SNMP messages that are sent from network devices to the network management station. Monitored devices send SNMP traps that report incidents to the management system. PRTG can handle thousands of SNMP traps per second.
4. Will I need an SNMP trap server?
The term “trap server” is sometimes used synonymously with “trap receiver.” This server receives and processes messages. Our preconfigured sensor for monitoring SNMP traps lets you configure any PRTG probe device as an SNMP trap server. PRTG supports SNMP v1 traps as defined in RFC 1157, and SNMP v2c traps as outlined in RFC 3416.
5. Can PRTG analyze and display SNMP traps?
PRTG receives the traps, which include the number of messages received per second, warnings, errors, and lost data packets. PRTG presents trap content and messages in an easy-to-read table. Data can be filtered however you like.
6. How thoroughly are the SNMP traps analyzed?
With PRTG, you get a quick overview of the traps and their contents, and will be notified immediately in the event of a problem. If you need a more thorough analysis, various specialized tools will allow you to examine traps in detail.
7. Which port is used for the transmission of SNMP messages?
By default, SNMP traps are sent via UDP port 162. This port must be set as the destination port in your source devices.
8. What is the difference between Get, GetNext, Set, and Trap?
SNMP works on the assumption that a network management system submits a query, and a managed device returns an answer. There are four possibilities for this exchange: Get, GetNext, Set, and Trap.
With Trap, SNMP traps are automatically sent from a device to a compatible receiver – without the receiver requesting them. This is not the case with Get and GetNext. With these commands, queries are performed manually. Set is no traditional monitoring function.
9. Does the SNMP trap monitor work with Windows?
PRTG has always been developed for Windows systems, which means you can also set up your trap monitoring in Windows.
10. What is a sensor in PRTG?
In PRTG, “sensors” are the basic monitoring elements. One sensor usually monitors one measured value in your network, for example the traffic of a switch port, the CPU load of a server, or the free space on a disk drive.
On average, you need about 5-10 sensors per device or one sensor per switch port.

PRTG: The multi-tool for sysadmins
Adapt PRTG individually and dynamically to your needs and rely on a strong API:- HTTP API: Access monitoring data and manipulate monitoring objects via HTTP requests
- Custom sensors: Create your own PRTG sensors for customized monitoring
- Custom notifications: Create your own notifications and send action triggers to external systems
- REST Custom sensor: Monitor almost everything that provides data in XML or JSON format
We asked: would you recommend PRTG?
Over 95% of our customers say yes!
Paessler AG conducted trials in over 600 IT departments worldwide to tune its network monitoring software closer to the needs of sysadmins.
The result of the survey: over 95% of the participants would recommend PRTG – or already have.
Paessler PRTG is used by companies of all sizes. Sysadmins love PRTG because it makes their job a whole lot easier. Bandwidth, servers, virtual environments, websites, VoIP services – PRTG keeps an eye on your entire network. Everyone has different monitoring needs. That’s why we let you try PRTG for free.Still not convinced?
More than 500,000
sysadmins love PRTGMonitor your entire IT infrastructure
Try Paessler PRTG
for free
Start monitoring SNMP traps with PRTG and see how it can make your network more reliable and your job easier.
|
PRTG |
Network Monitoring Software - Version 24.2.94.1400 (April 10th, 2024) |
|
Hosting |
Download for Windows and cloud-based version PRTG Hosted Monitor available |
Languages |
English, German, Spanish, French, Portuguese, Dutch, Russian, Japanese, and Simplified Chinese |
Pricing |
Up to 100 sensors for free (Price List) |
Unified Monitoring |
Network devices, bandwidth, servers, applications, virtual environments, remote systems, IoT, and more |
Supported Vendors & Applications |
|






Combining the broad monitoring feature set of PRTG with IP Fabric’s automated network assurance creates a new level of network visibility and reliability.