• Company
    • About Us
    • Case Studies
    • Press Center
    • Careers
    • Blog
    • Contact us
  • Contact us
  • Login
 
  • English
    • Deutsch
    • Español
    • Français
    • Italiano
    • Português
Paessler
                    - The Monitoring Experts
  • Products
    • Paessler PRTG
      Paessler PRTGMonitor your whole IT infrastructure
      • PRTG Network Monitor
      • PRTG Enterprise Monitor
      • PRTG Hosted Monitor
      • PRTG UVexplorer
      • PRTG extensionsExtensions for Paessler PRTGExtend your monitoring to a new level
    • Icon Features
      FeaturesExplore all monitoring features
      • Maps & dashboards
      • Alerts & notifications
      • Multiple user interfaces
      • Distributed monitoring
      • Customizable reporting
  • Solutions
    • Industries
      IndustriesMonitor various industry sectors
      • Industrial
      • Healthcare
      • Data Center
      • Education
      • Finance
      • Government
    • IT Topics
      IT TopicsMonitor all areas of IT
      • Network Monitoring
      • Bandwidth Monitoring
      • SNMP Monitor
      • Network Mapping
      • WiFi Monitoring
      • Server Monitoring
  • Pricing
  • Resources
    • Getting Started
      Getting StartedModules for self-paced learning
    • How-to Guides
      How-to GuidesGet the most out of PRTG
    • Videos & Webinars
      Videos & WebinarsLearn from Paessler experts
    • IT  Knowledge
      IT KnowledgeExpand your IT knowledge
    • PRTG Manual
      PRTG ManualFull documentation
    • Knowledge Base
      Knowledge BaseShare community knowledge
    • PRTG Sensor Hub
      PRTG Sensor HubGet sensors, scripts & templates
    • Trainings
      PRTG TrainingLearn how to work with PRTG
  • Partners
    • Icon Handshake
      Become a PartnerFor resellers and channel partners
    • Icon MSP
      Become an MSPDeliver monitoring as a managed service
    • icon partner
      Partner PortalLog in to your partner account
    • Deal Registration
      Deal RegistrationRegister your sales opportunities
    • icon search
      Find a PartnerFind partners selling Paessler products
    • icon technology
      Technology AlliancesSee Paessler technology partnerships
    • Partner HubTools for Your Success
  • Company
    • About Us
    • Case Studies
    • Press Center
    • Careers
    • Blog
    • Contact us
  • Contact us
  • Login
  • English
    • Deutsch
    • Español
    • Français
    • Italiano
    • Português
  • Get a quote
  • Free trial
  1. Home>
  2. IT Topics>
  3. Technology>
  4. NetFlow Monitoring Tool

Free NetFlow Monitoring with PRTG

A single solution to analyze your bandwidth and traffic

  • Comprehensive monitoring with in-depth network traffic analysis
  • Maximize network performance and prevent overloads
  • All different NetFlow versions & other flow technologies supported
Free download
PRODUCT OVERVIEW

Our Users Give Top Ratings for Monitoring With Paessler PRTG

Gartner peer insights
spiceworks
G2
Capterra

PRTG NetFlow monitoring: What you will find on this page

Table of content

    PRTG makes NetFlow monitoring as easy as it gets

    Custom alerts and data visualization let you quickly identify and prevent network flow and other performance issues.

    Free download
    PRODUCT OVERVIEW

    NetFlow monitoring: 4 reasons why you should consider PRTG

    NetFlow monitoring lets you analyze traffic patterns and get a picture of network traffic flow, including detailed traffic reports. This can help you understand which process, user, or application might cause speed problems or network outages. With our PRTG NetFlow analyzer, you get a holistic view of your network, keep an eye on your network traffic and what your bandwidth is being used for.

    Icon Like

    Analyze your network data traffic in detail

    Our NetFlow monitoring tool PRTG lets you analyze and monitor your bandwidth and determine, for example, the amount of IP traffic caused by IP addresses, protocols, or programs. To carry out such an analysis, configure your routers in a way that flow packets are sent to a PRTG server or a computer that has a PRTG remote probe installed.

    icon Statistics

    Benefit from high efficiency & scalability

    NetFlow puts only little strain on your CPU and is especially adapted for networks with heavy data traffic. With its flexible licensing model, PRTG is easy to adapt to changing network demands.

    icon Alerts

    Automatic, customizable alerts included

    PRTG automatically alerts you by SMS, email, push notification, or many other customizable notification methods when threshold values are exceeded. Notifications sent by PRTG reach you wherever you are – even while on the go.

    icon dashboard

    Visualize data on easy-to-read dashboards

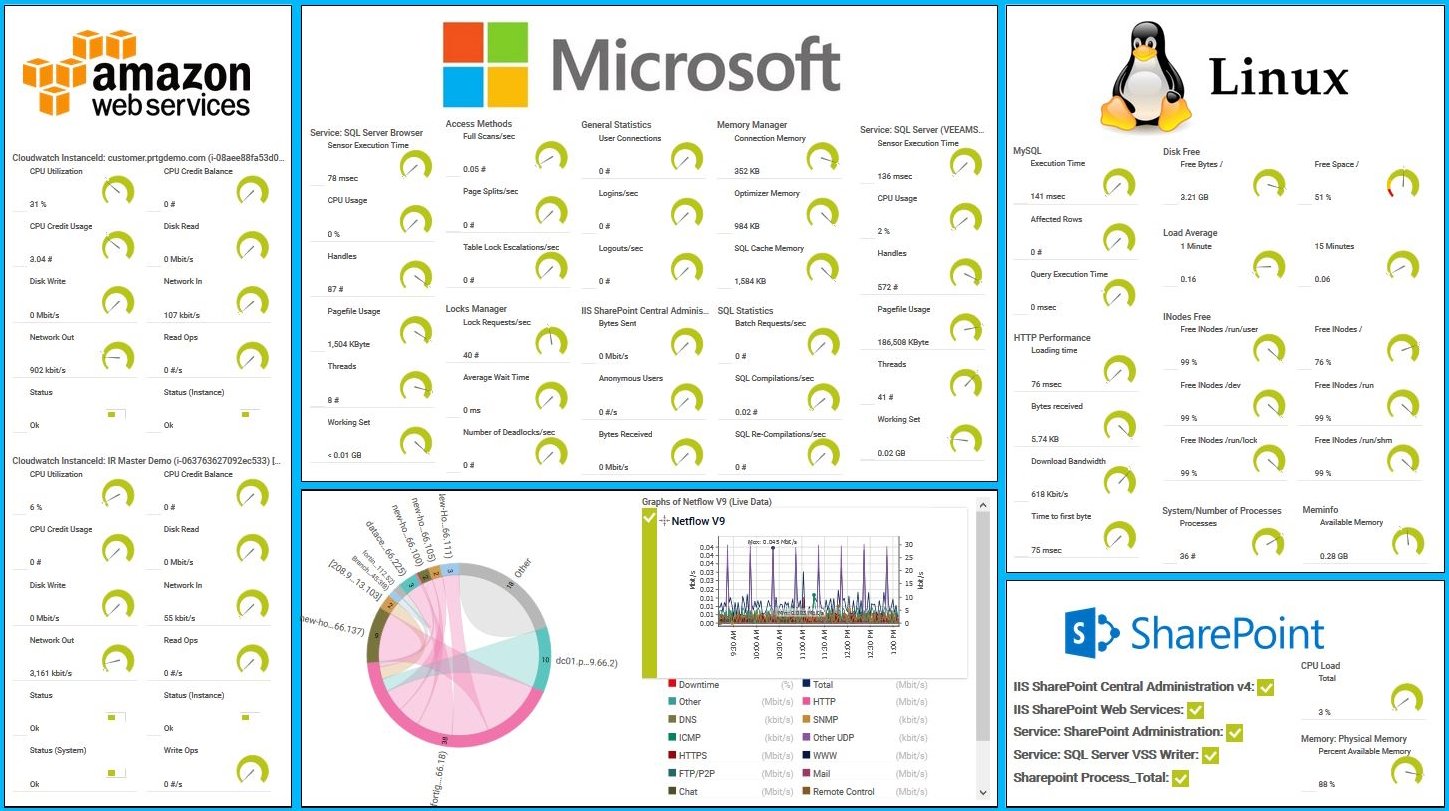
    PRTG displays your network traffic data on highly customizable, easy-to-read dashboards and maps . As a cross-manufacturer monitoring software, PRTG eliminates the need to juggle a number of different software solutions – just combine your NetFlow monitoring with data from all other devices in your IT infrastructure and visualize them the way you need.

    What NetFlow monitoring looks like in PRTG

    Diagnose network issues by continuously tracking the health, availability, and performance of your network devices such as routers or firewalls. Show NetFlow records, network bandwidth bottlenecks, and other key performance metrics in real time. Visualize monitoring data in clear graphs and dashboards to identify problems more easily. Gain the network visibility you need to troubleshoot flow traffic issues as well as potential network security threats.

    prtg-screenshot-map-aws-linux-windows-services

    Map with AWS, Linux, Windows services in PRTG

    PRTG Screenshot device tree view

    Device tree view of the complete monitoring setup

    PRTG screenshot map entire it infrastructure

    Custom PRTG dashboard for keeping an eye on the entire IT infrastructure

    Live traffic data graph in PRTG

    Live traffic data graph in PRTG

    Start network monitoring with PRTG and see how it can make your network more reliable and your job easier.


    Free download
    PRODUCT OVERVIEW

    IT experts agree: Paessler PRTG is a great solution for IT infrastructure monitoring

    PCMag

    “All-around winning
     network monitor”

    IT Brief

    “The real beauty of PRTG is the endless possibilities it offers”

    ITPro

    “PRTG Network Monitor 
    is very hard to beat”

    3 use cases of our NetFlow traffic analyzer PRTG

    With PRTG, you can easily detect, for example, if your switches are not equipped to handle the quantity of data that passes them – before they become completely overloaded. What’s more: should these switches actually overload during a backup , for example, PRTG helps you to quickly find the root cause of the issue.

    icon Traffic

    Identify bandwidth hogs

    Different sources like individual users, programs, or specific data often use disproportionately high amounts of bandwidth. With NetFlow monitoring, you can break down traffic, for example, by IP address and this way discover bandwidth hogs real quick.

    icon Alerts

    Spot load peaks early

    Many companies experience fluctuations regarding access to various websites or applications that are used internally. Define your own warning and error thresholds so that PRTG can alert you as early as possible if values are exceeded – ideally, before the performance of your system goes down.

    icon backup

    Avoid backup overloads

    Thorough backups can lead to problems for the entire network. Such issues are frequently the result of individual routers or switches that overload during the backup and thwart the entire network. Use NetFlow monitoring to find the root cause of a problem and troubleshoot the issue quickly to optimize your network in the best way possible.

    Network traffic monitoring comparison: NetFlow, SNMP, packet sniffing

    icon Traffic

    SNMP

    The Simple Network Management Protocol is extremely popular and offers an easy way to read device data. SNMP monitoring provides you with deeper insights into, for example, bandwidth and CPU usage, or the temperature of your hardware, but also into your network traffic.

    icon Packet sniffing

    Packet sniffing

    For more detailed information on your network traffic and bandwidth usage, use packet sniffing to take a closer look at the packets passing through individual routers or switches. This technology only analyzes the header traffic.

    icon statistics

    NetFlow analysis

    NetFlow is a protocol supported by Cisco hardware. You therefore need a monitoring solution as well as hardware that supports NetFlow. This technology lets you analyze your network traffic in detail without putting much strain on your network.

    Explore our preconfigured PRTG sensors for NetFlow monitoring

    PRTG comes with more than 250 native sensor types for monitoring your entire on-premises, cloud, and hybrid cloud environment out of the box. Check out some examples below!

    NetFlow v5

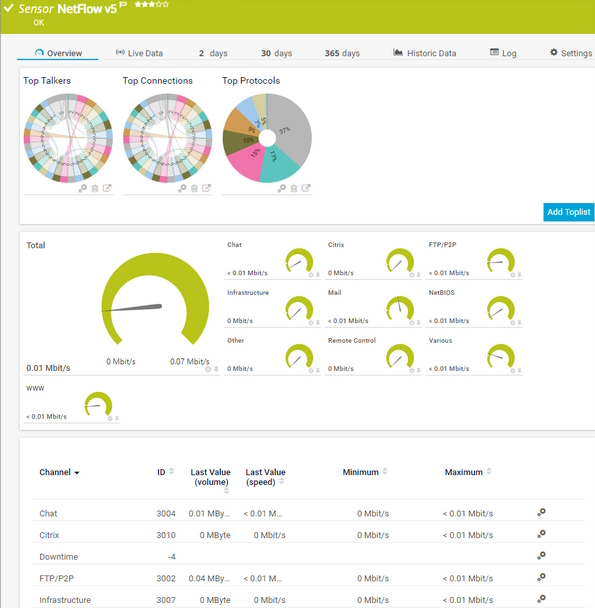
    The NetFlow v5 sensor receives traffic data from a NetFlow v5-compatible device and shows the traffic by type. This sensor has several filter options to divide traffic into different channels. It can show the following and more:

    • Traffic from Citrix applications
    • Traffic from file transfer (FTP/P2P) and various other protocols (UDP, TCP)
    • Traffic from network services (DHCP, DNS, Ident, ICMP, SNMP)
    • Internet mail traffic (IMAP, POP3, SMTP)
    • Traffic from remote control applications (RDP, SSH, Telnet, Virtual Network Computing (VNC))
    NetFlow v5
    NetFlow v5

    NetFlow v9

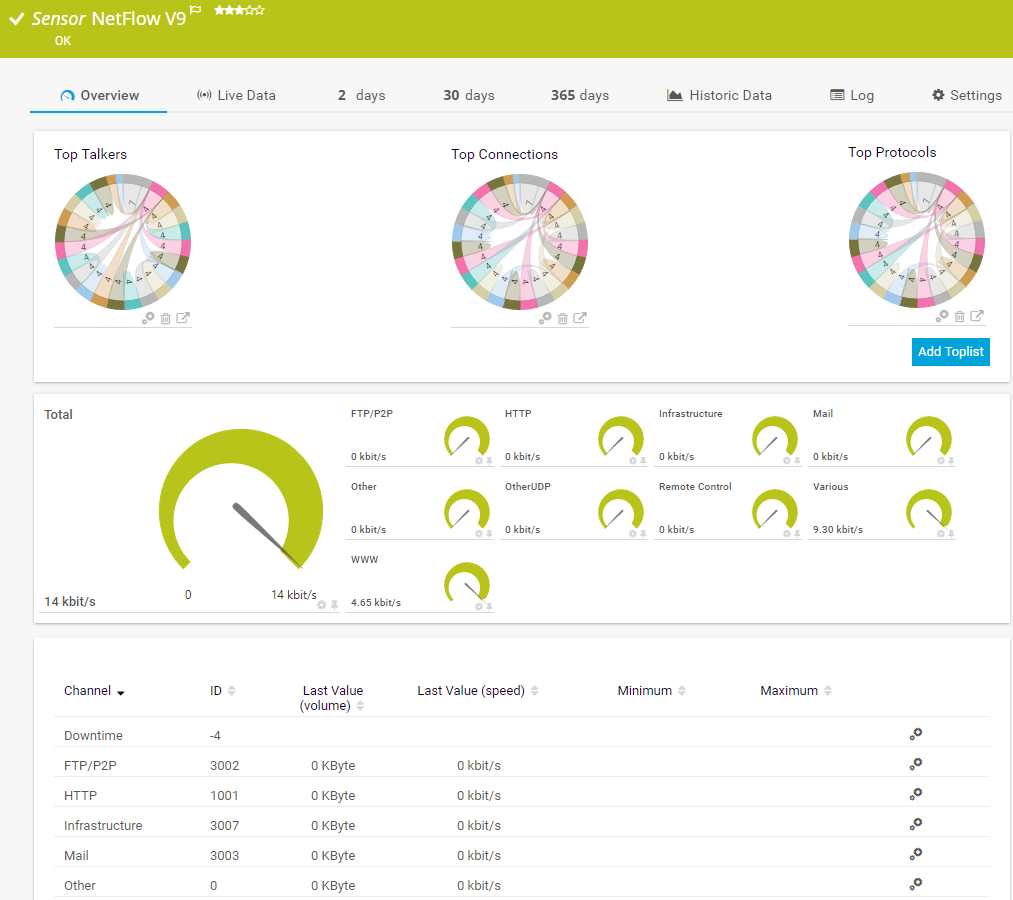
    The NetFlow v9 sensor receives traffic data from a NetFlow v9-compatible device and shows the traffic by type. This sensor has several filter options to divide traffic into different channels. It can show the following and more:

    • Traffic from Citrix applications
    • Traffic from file transfer (FTP/P2P) and various other protocols (UDP, TCP)
    • Traffic from network services (DHCP, DNS, Ident, ICMP, SNMP)
    • Internet mail traffic (IMAP, POP3, SMTP)
    • Traffic from remote control applications (RDP, SSH, Telnet, Virtual Network Computing (VNC))
    NetFlow v9
    NetFlow v9

    IPFIX

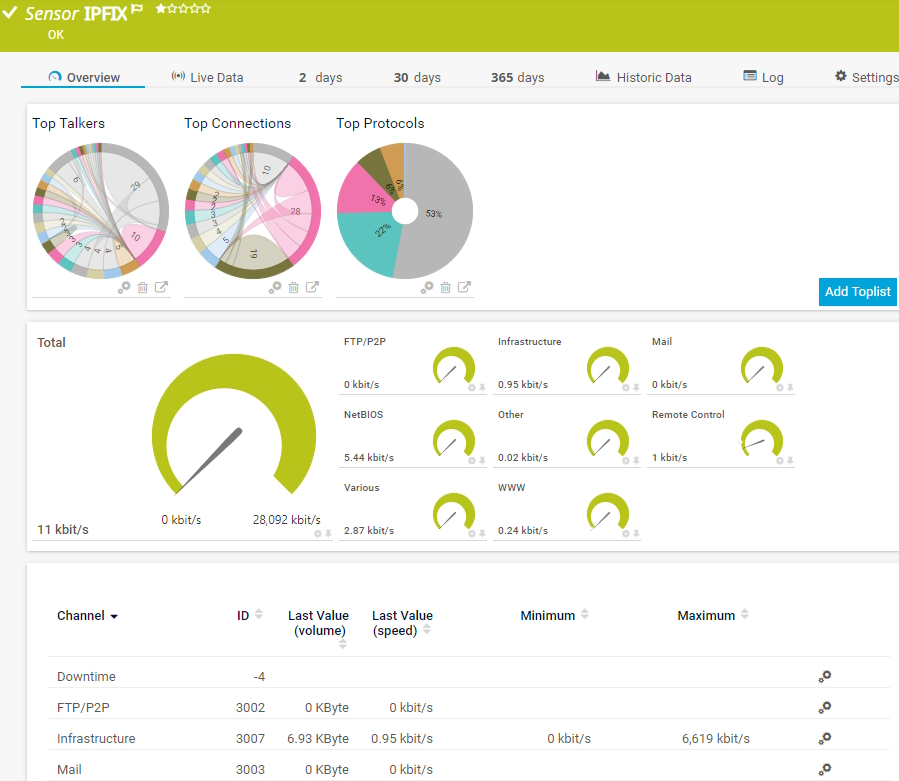
    The IPFIX sensor receives traffic data from an Internet Protocol Flow Information Export (IPFIX) compatible device and shows traffic by type. It can show the following and more:

    • Traffic from Citrix applications
    • Traffic from file transfer (FTP/P2P) and various other protocols (UDP, TCP)
    • Traffic from network services (DHCP, DNS, Ident, ICMP, SNMP)
    • Internet mail traffic (IMAP, POP3, SMTP)
    • Traffic from remote control applications (RDP, SSH, Telnet, Virtual Network Computing (VNC))
    PFIX
    PFIX

    SNMP Traffic v2

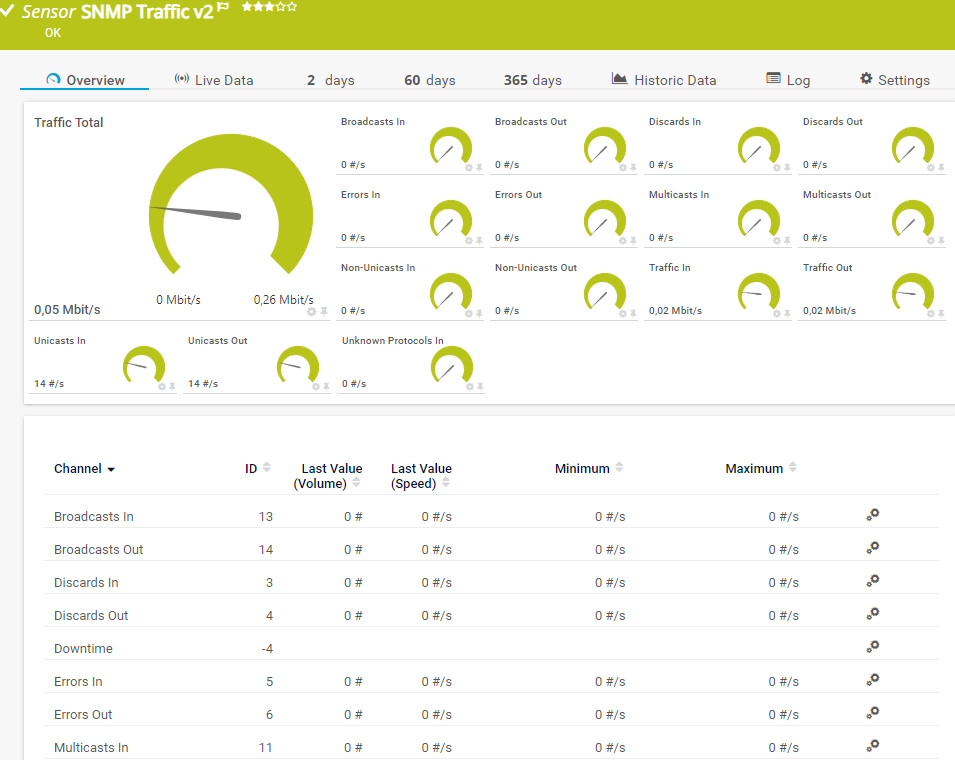
    The SNMP Traffic v2 sensor monitors bandwidth and traffic on a device. It can show the following:

    • Number of incoming and outgoing broadcast, multicast, unicast, and non-unicast packets
    • Number of incoming and outgoing discards and errors
    • Total, incoming, and outgoing traffic
    • Number of incoming, unknown protocols
    SNMP Traffic v2
    SNMP Traffic v2

    See the PRTG Manual for a list of all available sensor types.

    Find the root cause of the problem with our PRTG NetFlow monitoring solution

    Real-time notifications mean faster troubleshooting so that you can act before more serious issues occur.

    Free download
    PRODUCT OVERVIEW

    PRTG Is Compatible With All Major Vendors, Products, and Systems

    compatible with all major vendors, products, and systems

    NetFlow monitoring for virtual environments

    icon switch

    VMware and
    NetFlow

    VMware uses NetFlow technology in the "vSphere Distributed Switches (vDS)" product line. These virtual switches connect the virtual network cards of virtual machines (VMs) to the network by way of the hosts’ physical network cards. VMware integrates NetFlow for these virtual switches.

    icon flow

    Virtual NetFlow monitoring with PRTG

    Set up NetFlow in the VMware vCenter and configure it in such a way that these flows are sent to PRTG, where a corresponding flow sensor monitors and displays the data. As long as the correct NetFlow version is used, it will make no difference to PRTG where the flows come from.

    Icon information

    Further information

    • Blog article: NetFlow Monitoring via PRTG on VMware vSphere.
    • All you need to know about VMware Monitoring with PRTG.
    • Virtualization monitoring with PRTG

    PRTG makes NetFlow monitoring as easy as it gets

    Custom alerts and data visualization let you quickly identify and prevent network flow and other performance issues.


    Free download
    PRODUCT OVERVIEW

    “We strive to equip our systems with state-of-the-art technology to safeguard our educational practices for the future. Part of this includes ensuring that all our systems run smoothly at all times. On any given day, we rarely have time to keep an eye on all our systems. We therefore decided to monitor our school’s IT environment with a centralized network monitoring tool.”

    Stefan Roschewitz, IT administrator
    BBS Holzminden

    “We want to include the tool in our set of solutions in order to solve problems more proactively in our technology infrastructure. PRTG has exceeded all our expectations because it is a reliable, extremely easy-to-use solution. There is no doubt that it lives up to the renowned quality of German technology.”

    Esbin Saúl Lázaro García, IT Infrastructure and Security Engineer
    Hospital El Pilar

    “The reactivity, know-how, and technical solutions of Paessler are outstanding in every situation. For me, no monitoring tool compares to PRTG.”

    Andreas Reimann, Senior Networking Communication Architect
    Zurich Airport

    Your NetFlow analyzer at a glance – even on the go

    PRTG is set up in a matter of minutes and can be used on a wide variety of mobile devices.

    device overview
    Cisco

    We are a Cisco Select Developer Partner  

    As a member of the Cisco Partner Program, Paessler is one of the market leaders that enhances the Cisco technology portfolio with products that are proven to easily integrate with Cisco devices.

    What does this mean for you?

    • Easy integration of Cisco hardware and software with PRTG
    • State-of-the-art features for monitoring your Cisco environment
    • Expert technical support around your Cisco monitoring setup

    Create innovative solutions with Paessler’s IT partners

    Partnering with innovative IT vendors, Paessler unleashes synergies to create
    new and additional benefits for joined customers.

    IP Fabric

    IP Fabric

    Combining PRTG’s broad monitoring feature set with IP Fabric’s automated network assurance creates a new level of network visibility and reliability.

    Read more
    Plixer

    Plixer

    Paessler and Plixer provide a complete solution adding flow and metadata analysis to a powerful network monitoring tool.

    Read more
    UVnetworks

    UVnetworks

    UVexplorer integrates tightly with PRTG to bring fast and accurate network discovery, detailed device inventory, and automatic network mapping to the PRTG platform.

    Read more

    Find the root cause of the problem with our PRTG NetFlow monitoring solution

    Real-time notifications mean faster troubleshooting so that you can act before more serious issues occur.

    Free download
    PRODUCT OVERVIEW
    Paessler PRTG

    Paessler PRTG

    Network Monitoring Software – Version 26.1.116.1532 (February 9th, 2026)

    Hosting icon

    Hosting

    Download for Windows and cloud-based version PRTG Hosted Monitor available

    Languages icon

    Languages

    English, German, Spanish, French, Portuguese, Dutch, Russian, Japanese, and Simplified Chinese

    test

    Monitor everything

    Network devices, bandwidth, servers, applications, virtual environments, remote systems, IoT, and more

    test

    Pricing

    Choose the PRTG Network Monitor subscription that's best for you

    Discover more monitoring insights and stories

    Content illustration

    Powerful stories from the monitoring world

    • What Is NetFlow? – IT Explained
    • NetFlow Configuration and Monitoring via PRTG on VMware ...
    • NetFlow vs SNMP difference explained for IT monitoring
    Support illustration

    Resources to master your monitoring challenges

    • PRTG Manual: NetFlow v9 Sensor - Paessler
    • NetFlow Collector configuration
    • How do I monitor Cisco ASA firewalls using NetFlow 9 and PRTG?
    Solution illustration

    Solutions for all your monitoring needs

    • NetFlow Collector
    • sFlow Monitoring
    • jFlow Monitoring

    NetFlow Monitoring: FAQ


    What is NetFlow?

    NetFlow is a protocol for collecting, aggregating, and recording traffic flow data in a network. NetFlow data provides a more granular view of how bandwidth and network traffic are used than other network protocols such as SNMP.

    NetFlow was developed by Cisco. It is natively integrated into Cisco’s IOS software that runs on Cisco routers and switches. Many other hardware manufacturers either support NetFlow or use alternative flow technologies such as jFlow or sFlow.

    What are the best NetFlow tools?

    Many tools can collect and analyze flow data. When choosing a tool, you should consider your needs, and the extent to which you would like to analyze your data. It might also make sense to use several different tools concurrently. We have found, for example, that many administrators use Wireshark in addition to PRTG. Thanks to its flow monitoring, PRTG can give you an overall picture while allowing you to rule out possible causes of network problems. Wireshark, on the other hand, offers a detailed look at individual data packets.

    What is a NetFlow collector?

    A NetFlow collector captures, saves, and processes NetFlow data. Some of these tools are more effective than others at providing in-depth data analysis. Many administrators, however, use one single tool like PRTG to perform the functions of both NetFlow collectors and NetFlow analyzers.

    What is a NetFlow analyzer?

    With a NetFlow analyzer, you not only capture flow data but also perform an in-depth analysis of this data. PRTG is both a NetFlow collector and a NetFlow analyzer. It captures and processes NetFlow data and shows this data on easy-to-read dashboards.

    PRTG uses so-called toplists to display top talkers, top connections, and top protocols, and lets you drill down into the collected data for further analysis.

    What are the advantages of using a single tool for NetFlow traffic collection and analysis?

    Using a single tool like PRTG for NetFlow data collection and analysis can be more efficient and cost-effective than using two separate tools. A single tool usually provides a unified interface for both tasks, making it easier to navigate and use.

    Additionally, having one tool for both tasks can reduce the complexity and maintenance required for the system, as there is only one set of software to update and troubleshoot.

    Furthermore, using only one tool can ensure consistency in data collection and analysis, reducing the risk of errors or discrepancies between the two separate tools.of your organization.

    Which NetFlow collectors and analyzers are available for Windows?

    PRTG is a NetFlow collector and analyzer that runs on Windows. As our focus has always been on Windows systems, we have acquired quite a bit of expertise in the area of NetFlow monitoring with Windows. It also uses technologies that enable you to monitor non-Windows operating systems.

    NetFlow analyzer download: free or professional?

    Many administrators wonder if there is an effective, free NetFlow analysis tool on the market, or if they should consider using a professional one. PRTG comes with 100 free sensors for life. And if you decide to expand your monitoring in the future, you can purchase a professional license at any time.

    What is a sensor in PRTG?

    In PRTG, “sensors” are the basic monitoring elements. One sensor usually monitors one measured value in your network, for example the traffic of a switch port, the CPU load of a server, or the free space on a disk drive. On average, you need about 5-10 sensors per device or one sensor per switch port.

    We asked: would you recommend PRTG? Over 95% of our customers say yes!

    Paessler conducted trials in over 600 IT departments worldwide to tune its network monitoring software closer to the needs of sysadmins. The result of the survey: over 95% of the participants would recommend PRTG – or already have.

    recommendation

    Still not convinced?

    Love

    More than 500,000 sysadmins love PRTG

    Paessler PRTG is used by companies of all sizes. Sysadmins love PRTG because it makes their job a whole lot easier.

    PRTG

    Monitor your entire IT infrastructure

    Bandwidth, servers, virtual environments, websites, VoIP services – PRTG keeps an eye on your entire network.

    test

    Try Paessler PRTG for free

    Everyone has different monitoring needs. That’s why we let you try PRTG for free.

    PRTG Logo

    Start NetFlow monitoring with PRTG and see how it can make your network more reliable and your job easier.

    Free download
    PRODUCT OVERVIEW

    Products

    • Paessler PRTG
      Paessler PRTGMonitor your whole IT infrastructure
      • PRTG Network Monitor
      • PRTG Enterprise Monitor
      • PRTG Hosted Monitor
      • PRTG UVexplorer
      • PRTG extensions
        Extensions for Paessler PRTGExtend your monitoring to a new level
    • Icon Features
      FeaturesExplore all monitoring features

    Monitoring with PRTG

    • Network monitoring
    • Bandwidth monitoring
    • SNMP monitoring
    • Network mapping
    • Wi-Fi monitoring
    • Server monitoring
    • Network traffic analyzer
    • NetFlow monitoring
    • Syslog server

    Useful Links

    • PRTG Manual
    • Knowledge Base
    • Customer Success Stories
    • About Paessler
    • Subscribe to newsletter
    • PRTG Support
    • PRTG Consulting
    • PRTG Feedback & Roadmap

    Contact

    Paessler GmbH
    Thurn-und-Taxis-Str. 14, 
    90411 Nuremberg 
    Germany

    [email protected]

    +49 911 93775-0

    • Contact us
    ©2026 Paessler GmbHTerms & ConditionsPrivacy PolicyImprintReport VulnerabilityDownload & InstallSitemap
    Unified Communications (UC) Unified Communications (UC) Unified Communications (UC)