![]()
Monitor your network’s bandwidth usage and identify bottlenecks with PRTG
- Keep track of the bandwidth utilization of your devices and systems
- Comprehensive monitoring with real-time data & customizable dashboards
- Detect bandwidth bottlenecks and optimize data throughput
Our users give top ratings for monitoring with Paessler PRTG


PRTG bandwidth bottleneck monitoring: What you’ll find on this page

PRTG makes bandwidth bottleneck monitoring easy
Custom alerts and data visualization make it easy to monitor, identify, and prevent bandwidth bottleneck issues.
3 ways PRTG helps optimize network performance & resolve bandwidth bottlenecks
Quickly identify and analyze bottlenecks
Bandwidth bottleneck detection with Paessler PRTG helps you to pinpoint the source of a bottleneck location. By monitoring IP addresses, protocols, and physical network ports, you can keep an eye on your network’s performance at all times.
Analyze traffic patterns, bandwidth capacity, and data throughput to keep your network running smoothly.
Get comprehensive bandwidth utilization monitoring
Understanding how bandwidth is being used across your network is key to identifying network congestion and avoiding bandwidth bottlenecks. PRTG provides a comprehensive view of bandwidth utilization across different network segments.
From data-intensive applications to individual hosts, you can track bandwidth usage in detail. Maintain a high performance and avoid productivity losses due to slow network speeds.
Benefit from real-time traffic & performance metrics
In today’s fast-paced digital world, real-time data is invaluable. In addition to monitoring bandwidth bottlenecks , PRTG provides real-time data on key network performance indicators such as network traffic, data throughput, network latency, and packet loss.
You will be alerted immediately to any issues with your network devices and to any threshold breaches – giving you the data you need, when you need it.
“All-around winning “The real beauty of PRTG is the endless possibilities it offers” “Outstanding cloud IT experts agree: Paessler PRTG is a great solution for IT infrastructure monitoring

network monitor”

monitoring”
Start monitoring bandwidth bottlenecks with PRTG and see how it can make your network more reliable and your job easier.
What bandwidth bottleneck monitoring looks like in PRTG
Diagnose network issues by continuously monitoring all of your bandwidth and network devices. Show bandwidth status in real time and visualize data in graphic maps & dashboards to identify problems more easily. Gain the visibility you need to troubleshoot bandwidth bottlenecks and prevent packet loss or network congestion.
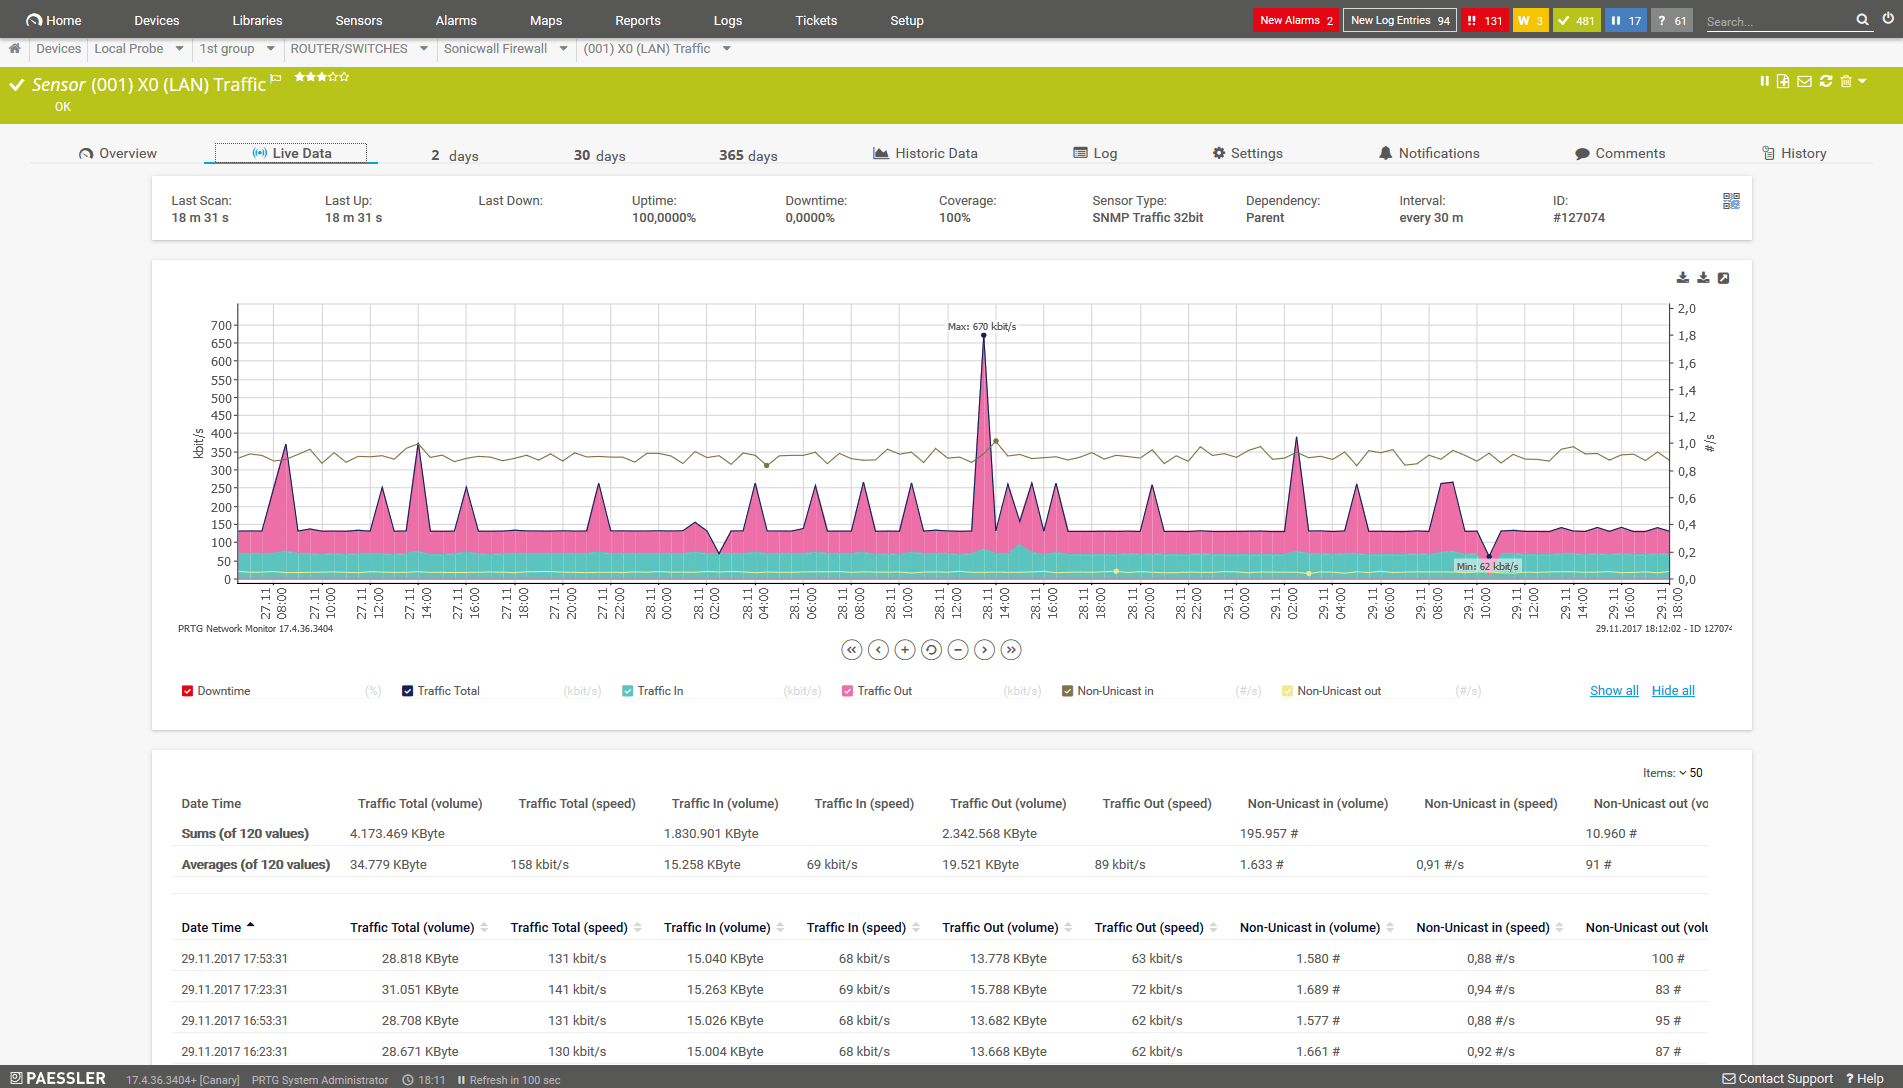
Live data traffic graph of an SNMP Traffic sensor
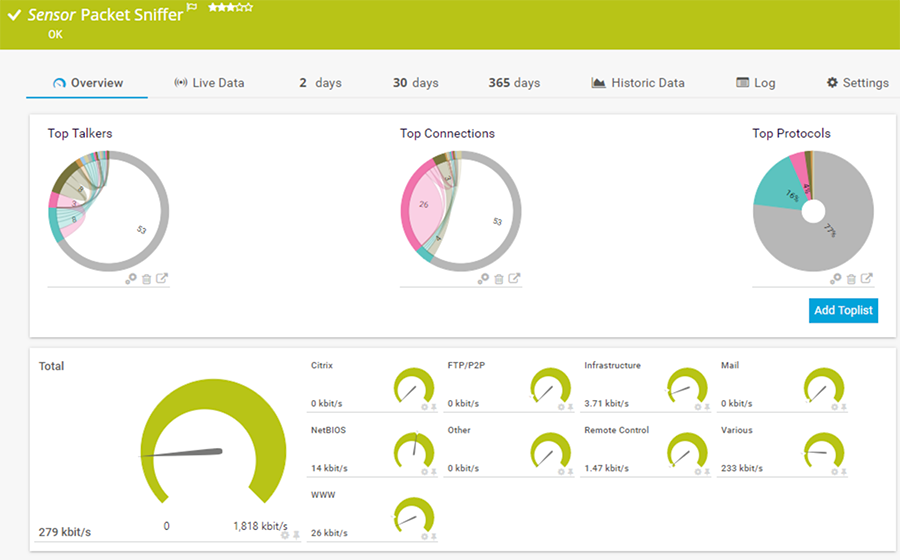
Packet Sniffer sensor in PRTG
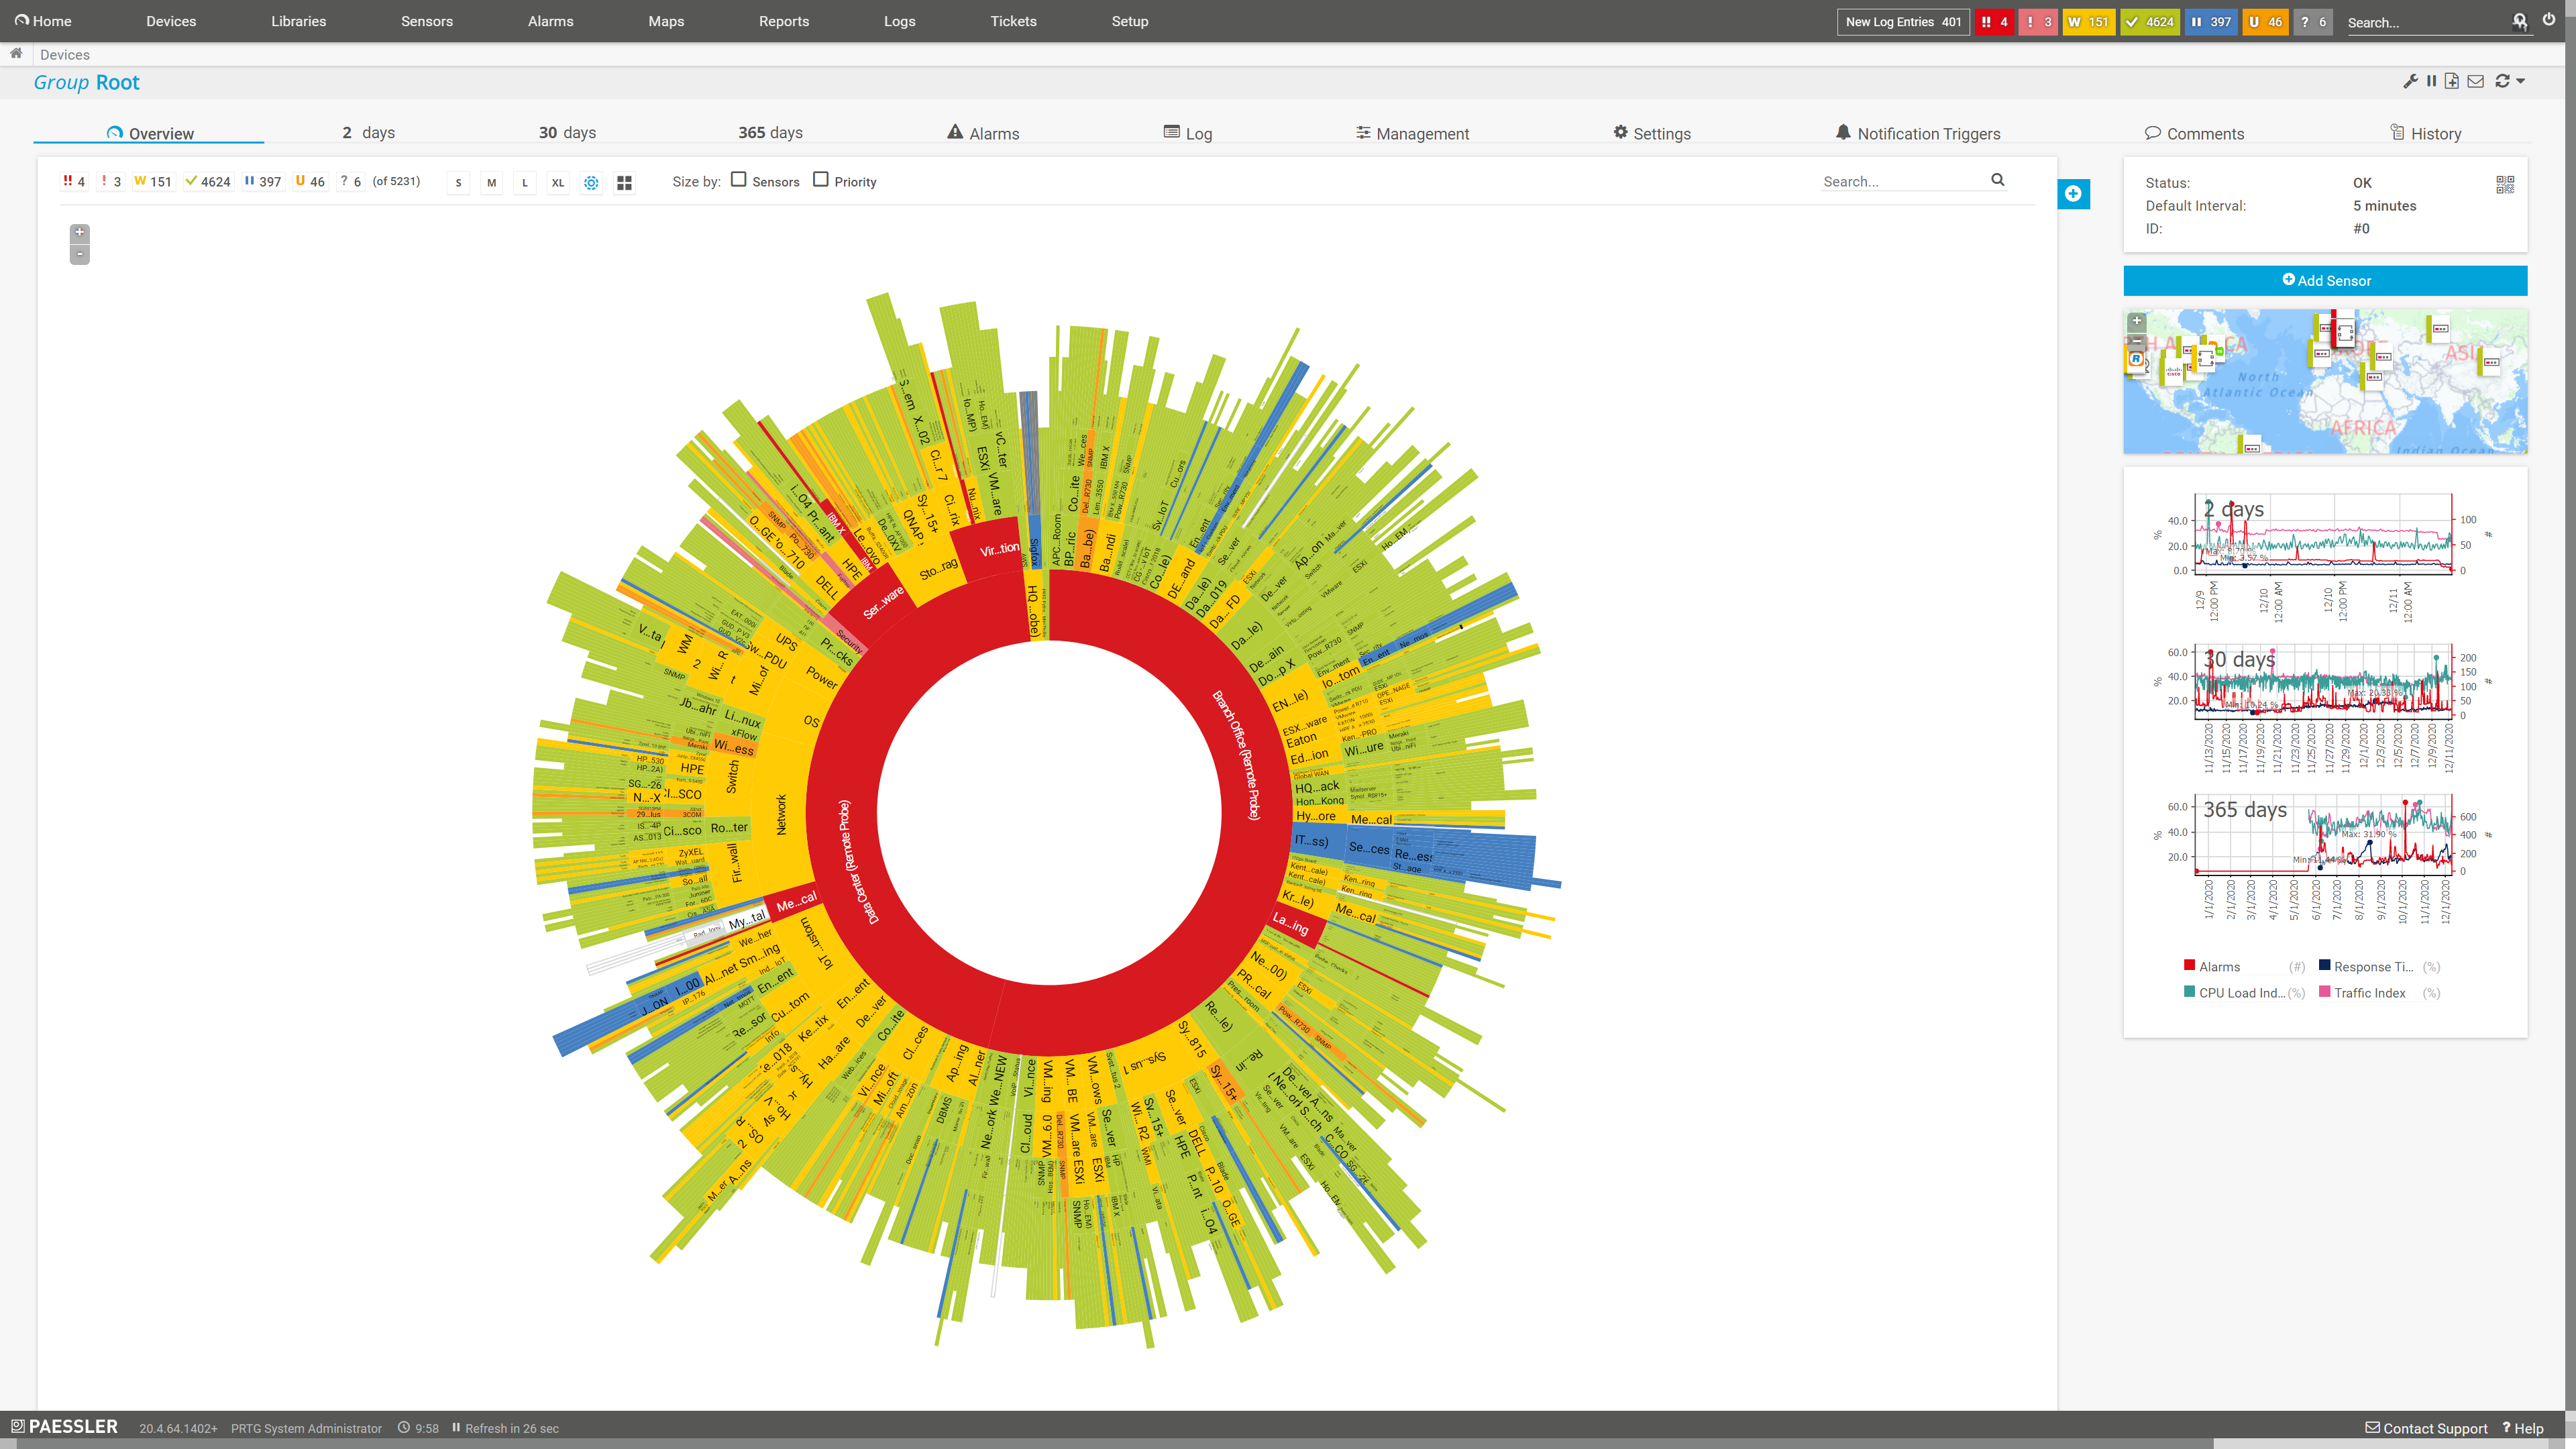
Sunburst view of the entire monitoring setup
Your bandwidth bottleneck monitor at a glance – even on the go
Set up PRTG in minutes and use it on almost any mobile device.


Easily find the source of the problem with our PRTG bandwidth bottleneck monitoring solution
Real-time alerts and custom notifications make troubleshooting bandwidth bottlenecks and network congestions easy.
“Excellent tool for detailed monitoring. Alarms and notifications work greatly. Equipment addition is straight forward and server initial setup is very easy. ...feel safe to purchase it if you intend to monitor a large networking landscape.”
Infrastructure and Operations Engineer in the Communications Industry, firm size 10B - 30B USD
More than just a bandwidth bottleneck monitoring tool: Explore all-in-one network monitoring with PRTG
Network monitoring is a critical part of maintaining a high-performance and reliable network. PRTG can do way more for you than identifying and troubleshooting bandwidth bottlenecks. Use our comprehensive software to monitor the various aspects of your network and help you understand and optimize its performance.
Bandwidth monitoring
Understanding and managing your network’s bandwidth usage is critical to preventing bottlenecks and maintaining optimal performance.
PRTG provides detailed insight into bandwidth utilization and helps you identify which parts of your network are experiencing high traffic and may be at risk of bottlenecks. Monitor and analyze bandwidth usage trends to make informed decisions and keep your network running smoothly.
Network traffic analysis
Detailed network traffic analysis is the key to identifying potential bandwidth bottlenecks and ensuring efficient traffic flow.
With PRTG, you can dive deep into this topic. Discover the source, destination, and type of traffic flowing through your network. By understanding your network's traffic patterns, you can optimize its performance and prevent congestion.
Network performance metrics
Gain deeper insight into the health of your network with PRTG's performance metrics. Beyond just bandwidth monitoring, PRTG provides a detailed view of the operational status of your network, including aspects such as connection quality, network stability, and overall reliability.
Use these metrics to fine-tune your network setup, ensure consistent performance, and diagnose problems that could lead to bandwidth bottlenecks.
Hardware monitoring
Ensure that all network devices and infrastructure components are working optimally with PRTG’s comprehensive monitoring capabilities.
From routers and switches to servers and storage systems, PRTG helps you keep an eye on the health and performance of your entire network infrastructure. Prevent problems before they occur by staying informed about the status of your network devices.
PRTG is compatible with all major vendors, products, and systems
![]()
PRTG makes bandwidth bottleneck monitoring easy
Custom alerts and data visualization make it easy to monitor, identify, and prevent bandwidth bottleneck issues.
How to monitor bandwidth bottlenecks
Use SNMP for light-weight traffic checks
The Simple Network Management Protocol (SNMP) is an essential tool for network administrators, and PRTG harnesses its power to provide efficient and comprehensive bandwidth monitoring.
Using its preconfigured SNMP Traffic sensor, PRTG can collect detailed information about your network devices’ bandwidth usage, network load, and more, allowing you to keep a close eye on how your network resources are being used.
Sniff out and analyze data packets
Packet sniffing is a powerful technique used by PRTG to capture and analyze the data packets passing through your network. It allows you to examine the contents of the packets and gain detailed insight into the type of traffic and its characteristics.
The Packet Sniffer sensor is especially useful for in-depth network analysis, as it can identify specific data patterns, detect security breaches, and help troubleshoot network problems.
Get in-depth insight into traffic flows
PRTG’s flow sensors (NetFlow, sFlow, jFlow, and IPFIX ) are another powerful feature that provides in-depth analysis of network traffic patterns and bandwidth usage.
These protocols allow PRTG to collect data about the traffic flowing through your network, providing insight into the source, destination, and type of transmitted data. Use our flow sensors to optimize bandwidth allocation and identify potential bottlenecks before they impact network performance.
Create innovative solutions with Paessler’s partners
Partnering with innovative vendors, Paessler unleashes synergies to create
new and additional benefits for joined customers.


ScriptRunner
With ScriptRunner, Paessler integrates a powerful event automation platform into PRTG Network Monitor.
Monitoring bandwidth bottlenecks: FAQ
1. What is a bandwidth bottleneck?
A bandwidth bottleneck occurs when a network's data transmission capacity is insufficient for the amount of data being sent, resulting in slow network performance and unresponsive applications. Signs of a bandwidth bottleneck include slow network speeds, delayed response times, frequent buffering, and overall network congestion.
2. How can I detect bandwidth bottlenecks in my network?
You can identify bandwidth bottlenecks by monitoring network traffic, analyzing bandwidth usage patterns, and using bandwidth bottleneck monitoring tools such as PRTG. These methods will help you pinpoint areas of high traffic and potential congestion in your network.
3. How often should I monitor my network for bandwidth bottlenecks?
Regular monitoring of your network for bandwidth bottlenecks is essential to maintain optimal performance. Continuous monitoring with tools like PRTG enables early detection of problems and proactive management of potential disruptions.
4. What are the benefits of using PRTG to monitor bandwidth bottlenecks?
PRTG provides a comprehensive solution for monitoring bandwidth bottlenecks. It provides real-time insight into network traffic and bandwidth usage, enabling fast problem identification and resolution. PRTG's versatility allows monitoring of different network components and customization to meet specific needs.
5. What is a sensor in PRTG?
In PRTG, “sensors” are the basic monitoring elements. One sensor usually monitors one measured value in your network, for example the traffic of a switch port, the CPU load of a server, or the free space on a disk drive.
On average, you need about 5-10 sensors per device or one sensor per switch port.
We asked: would you recommend PRTG?
Over 95% of our customers say yes!
Paessler AG conducted trials in over 600 IT departments worldwide to tune its network monitoring software closer to the needs of sysadmins.
The result of the survey: over 95% of the participants would recommend PRTG – or already have.


PRTG: The multi-tool for sysadmins
Adapt PRTG individually and dynamically to your needs and rely on a strong API:- HTTP API: Access monitoring data and manipulate monitoring objects via HTTP requests
- Custom sensors: Create your own PRTG sensors for customized monitoring
- Custom notifications: Create your own notifications and send action triggers to external systems
- REST Custom sensor: Monitor almost everything that provides data in XML or JSON format
Paessler PRTG is used by companies of all sizes. Sysadmins love PRTG because it makes their job a whole lot easier. Bandwidth, servers, virtual environments, websites, VoIP services – PRTG keeps an eye on your entire network. Everyone has different monitoring needs. That’s why we let you try PRTG for free.Still not convinced?
![]()
More than 500,000
sysadmins love PRTG![]()
Monitor your entire IT infrastructure
![]()
Try Paessler PRTG
for free
![]()
Start monitoring bandwidth bottlenecks with PRTG and see how it can make your network more reliable and your job easier.
|
PRTG |
Network Monitoring Software - Version 24.2.94.1400 (April 10th, 2024) |
|
Hosting |
Download for Windows and cloud-based version PRTG Hosted Monitor available |
Languages |
English, German, Spanish, French, Portuguese, Dutch, Russian, Japanese, and Simplified Chinese |
Pricing |
Up to 100 sensors for free (Price List) |
Unified Monitoring |
Network devices, bandwidth, servers, applications, virtual environments, remote systems, IoT, and more |
Supported Vendors & Applications |
|
Combining the broad monitoring feature set of PRTG with IP Fabric’s automated network assurance creates a new level of network visibility and reliability.