Gli avvisi personalizzati e la visualizzazione dei dati consentono di identificare e prevenire rapidamente i problemi di hardware, applicazioni e servizi.
Assicurarsi che i server e le applicazioni Windows funzionino senza problemi non è solo un compito dell'IT: è la spina dorsale che fa girare il vostro mondo digitale. Il monitoraggio dei contatori delle prestazioni di Windows di Paessler PRTG è il vostro campione 24 ore su 24 per mantenere i sistemi critici in ottima forma.
Scoprite il cuore della vostra infrastruttura Windows con la precisione che solo PRTG può offrire. Sfruttando i performance counter di Windows, PRTG diventa lo Sherlock Holmes del monitoraggio.
Deduce la salute e le prestazioni del sistema analizzando tutto, dal carico della CPU all'utilizzo della memoria. Otterrete una Panoramica completa dei vostri server senza complicazioni.
Perché aspettare che i problemi bussino alla vostra porta? Con gli avvisi personalizzabili del PRTG, siete voi i primi ad arrivare. Impostate le soglie di monitoraggio per adattarle alle esigenze specifiche del vostro ambiente IT.
Che si tratti di un picco nell'utilizzo della memoria o di un collo di bottiglia della larghezza di banda, PRTG vi invia un segnale via e-mail, SMS, notifica push e altro ancora, in modo che possiate agire prima che il problema diventi un mal di testa.
Abbracciate la semplicità del monitoraggio con PRTG. Invece di destreggiarvi tra più strumenti che a malapena si parlano, ottenete una visione completa del vostro ambiente IT.
PRTG taglia rapidamente la complessità, fornendo un'esperienza di monitoraggio senza soluzione di continuità che copre tutto l'hardware, i servizi e le applicazioni, on-premises o nel cloud , con zero problemi.
Con PRTG, la sicurezza dei vostri dati non è negoziabile. La comunicazione tra il server PRTG e i dispositivi monitorati è crittografata e sicura.
Utilizziamo solo metodi di crittografia di alto livello, assicurando che i vostri dati rimangano privati e protetti.
Diagnosticate i problemi di rete monitorando continuamente le macchine Microsoft Windows con performance counter, WMI, SNMP, PowerShell e altro ancora. Mostra l'utilizzo del disco fisico, la velocità di lettura e scrittura del disco, i dati dei file di log, la replica di Active Directory e altre metriche chiave delle prestazioni di Windows in tempo reale. Visualizzate i dati di monitoraggio in grafici e dashboard chiari per identificare più facilmente i problemi. Ottenete la Panoramica necessaria per risolvere i problemi dei sistemi Windows e ottimizzare l'uso delle risorse.

Albero dei dispositivi dell'intera configurazione di monitoraggio

Dashboard PRTG personalizzato per tenere sotto controllo l'intera infrastruttura IT

Grafico dei dati di traffico in tempo reale in PRTG
“Monitor di rete vincente sotto tutti i punti di vista”
“La vera bellezza di PRTG sta nelle infinite possibilità che offre”
“PRTG Network Monitor
è molto difficile da superare”
Monitorate non solo il sistema e i servizi Windows, ma anche le prestazioni delle applicazioni in esecuzione su un server IIS, assicurandovi che nulla vada perso. Il monitoraggio delle prestazioni di Windows di PRTG fornisce tutti i dettagli necessari.
Scoprite le metriche più importanti sulle prestazioni, come l'utilizzo della CPU, il carico di memoria o il tempo di processore, e approfondite la questione per scoprire la causa principale di un problema: la rete, l'hardware o l'applicazione stessa. PRTG è la sfera di cristallo high-tech per il vostro ambiente IT.
Rimanete informati con un monitoraggio in tempo reale che vi tiene informati, sia che siate in ufficio o che stiate facendo uno spuntino di mezzanotte. Con il sistema di avvisi di PRTG, siete sempre i primi a sapere quando qualcosa non va, consentendovi di intervenire più rapidamente e in modo proattivo.
PRTG è dotato di oltre 250 tipi di sensori nativi per il monitoraggio dell'intero ambiente on-premises, cloud e cloud ibrido. Dai un'occhiata ad alcuni esempi qui sotto!
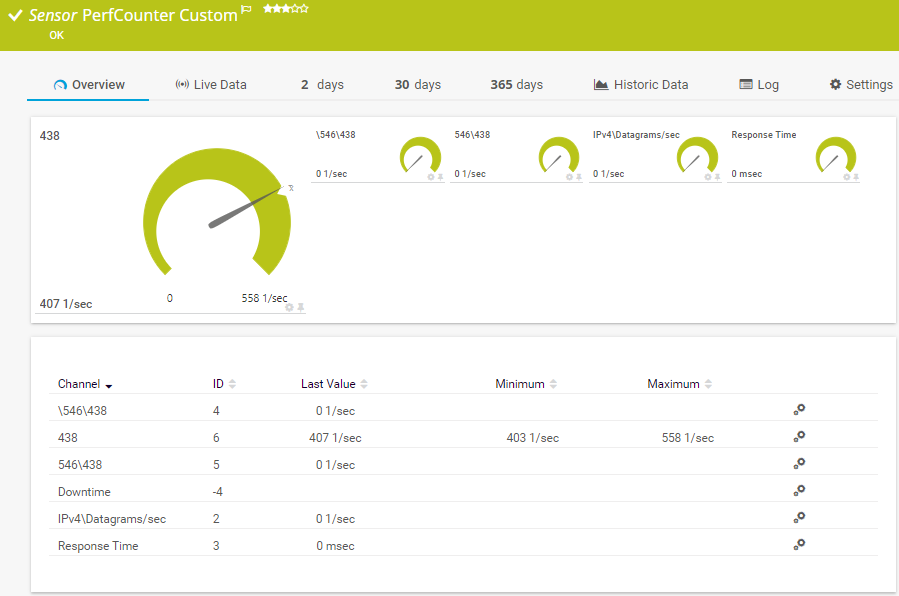
Il sensore PerfCounter Custom monitora un insieme configurato di contatori delle prestazioni di Windows. È possibile definire i propri canali. Può mostrare quanto segue:
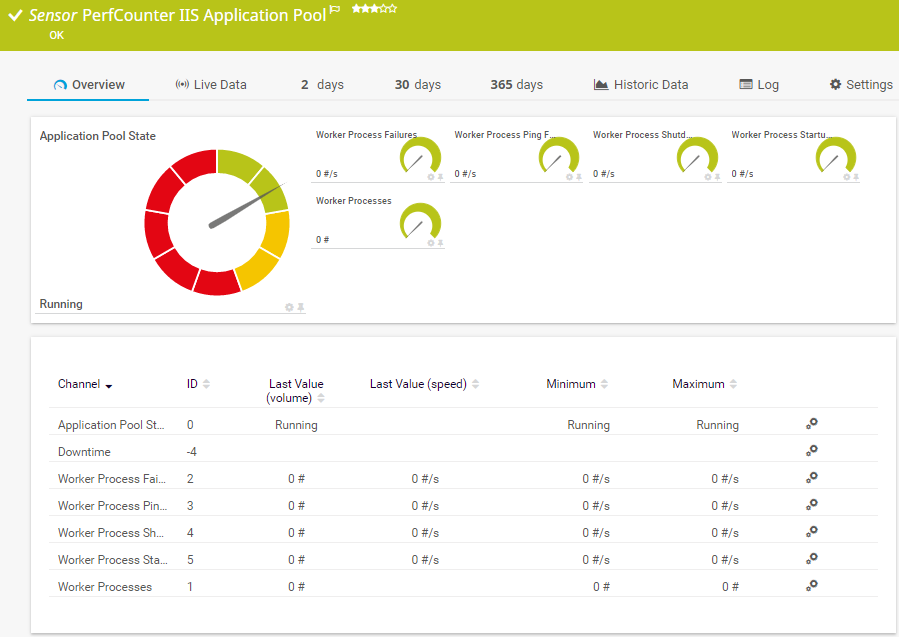
Il sensore PerfCounter IIS Application Pool monitora un pool di applicazioni Microsoft Internet Information Services (IIS) tramite i contatori di prestazioni di Windows. Può mostrare quanto segue:
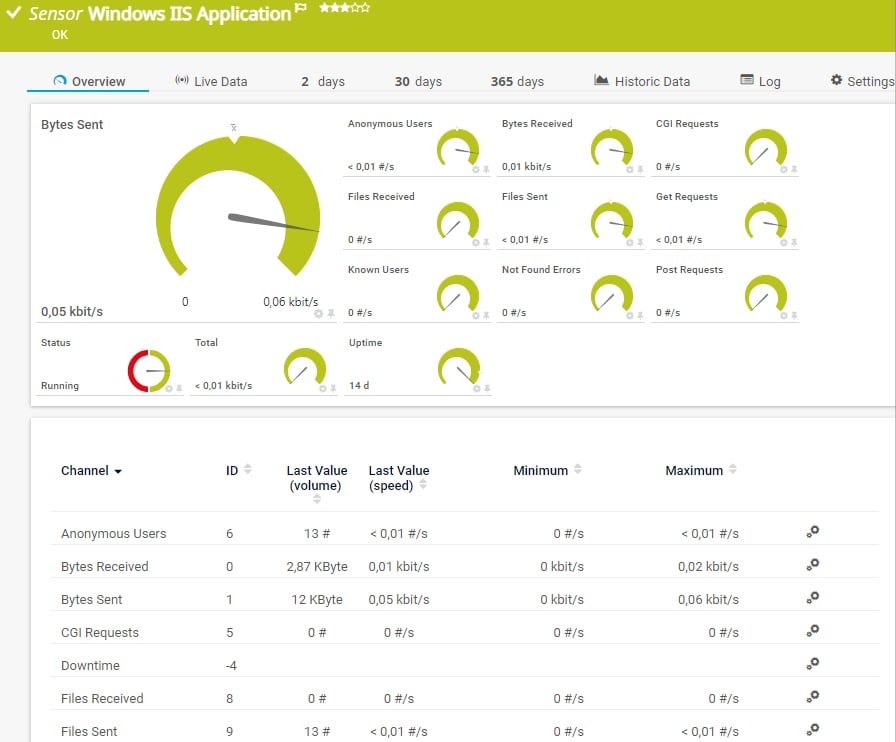
Il sensore Windows IIS Application monitora un server Microsoft Internet Information Services (IIS) tramite Windows Management Instrumentation (WMI). Può anche monitorare le applicazioni che utilizzano IIS, come Microsoft SharePoint o Microsoft Reporting Services (SSRS). Può mostrare i seguenti dati e altri ancora:
Consulta il manuale di PRTG per un elenco di tutti i tipi di sensore disponibili.

Gli avvisi personalizzati e la visualizzazione dei dati consentono di identificare e prevenire rapidamente i problemi di hardware, applicazioni e servizi.
PRTG si configura in pochi minuti e può essere utilizzato su un'ampia gamma di dispositivi mobili.


“Interfaccia fantastica e intuitiva, supporto REST completo, script personalizzati; i sensori rest aggiungono valore extra. Utilizziamo PRTG ormai da 10 anni in ambienti multipli e per diversi utilizzi; è di gran lunga l’interfaccia migliore ed è molto semplice da configurare anche senza una precedente esperienza.”
Grazie alla collaborazione con fornitori IT innovativi, Paessler libera sinergie per creare nuovi e ulteriori vantaggi per i suoi clienti.
L'IT che funziona costituisce una base critica per il successo di un'azienda. La disponibilità e la sicurezza devono essere definite per il rispettivo scopo e monitorate attentamente, sia da parte dell'OT che dell'IT.
L'integrazione dei risultati del monitoraggio di PRTG nelle mappe di NetBrain costituisce la base per l'automazione della rete.
Con ScriptRunner Paessler integra una potente piattaforma di automazione degli eventi in PRTG Network Monitor.
Notifiche in tempo reale significano una risoluzione più rapida dei problemi, in modo da poter agire prima che si verifichino problemi più gravi.
Software di monitoraggio della rete – Versione 26.1.116.1532 (February 9th, 2026)
Disponibile il download della versione per Windows e della versione cloud-based PRTG Hosted Monitor
Inglese, tedesco, spagnolo, francese, portoghese, olandese, russo, giapponese e cinese semplificato
Dispositivi di rete, larghezza di banda, server, applicazioni, ambienti virtuali, sistemi remoti, IoT e molto altro
Scegli l'abbonamento a PRTG Network Monitor più adatto a te


I performance counter sono strumenti specializzati all'interno di un sistema operativo che raccolgono e misurano i dati sulle prestazioni del sistema. Nel contesto di Windows, i performance counter tengono traccia di un'ampia gamma di metriche del sistema e delle applicazioni, come l'utilizzo della CPU, l'I/O del disco, l'utilizzo della memoria, l'attività di rete e altro ancora.
Questi dati forniscono indicazioni preziose sul funzionamento del sistema e dei suoi componenti, aiutando a identificare colli di bottiglia, inefficienze o potenziali problemi prima che si aggravino. In sostanza, i performance counter servono a controllare il polso dell'ambiente IT, offrendo uno sguardo in tempo reale sulla salute e sulle prestazioni dei sistemi Windows.
Ci sono alcune buone ragioni per utilizzare i performance counter come tecnologia di monitoraggio per Windows Server: WMI, il metodo predefinito di Microsoft per il monitoraggio dei sistemi Windows, utilizza una quantità eccessiva di risorse di rete e talvolta è instabile.
PRTG offre per impostazione predefinita i cosiddetti "sensori ibridi", che cercano innanzitutto di richiedere i dati desiderati (come il carico della CPU) tramite i performance counter e ricorrono a WMI solo se i performance counter non sono disponibili o non possono essere letti per qualche altro motivo.
Dal punto di vista delle prestazioni, SNMP è sicuramente la scelta migliore per monitorare i dispositivi Windows, ma in alcuni casi questa tecnologia di monitoraggio è inappropriata. Alcuni dati non sono semplicemente disponibili sulle macchine Windows tramite SNMP; in questi casi, i performance counter sono spesso la scelta migliore.
Tutti i performance counter costruiti in Windows sono pienamente supportati da PRTG. Date un'occhiata al Monitoraggio delle prestazioni di Windows come descritto nel nostro articolo di Knowledge Base: A volte è incredibile pensare a quanti performance counter esistono per le applicazioni Windows! Questi includono anche quelli che non provengono da Microsoft, perché spesso forniscono informazioni sorprendenti su applicazioni e processi.
Niente da fare! PRTG va in profondità, offrendo informazioni dettagliate su un'ampia gamma di performance counter forniti dal monitor delle prestazioni di Windows (perfmon.exe). Che si tratti di un server, di un'applicazione o di un componente hardware, se Windows può tracciarlo, PRTG può monitorarlo.
Sì, è vero. PRTG non si limita a tenere d'occhio le cose, ma vi avvisa con avvisi personalizzabili. Mantenete i vostri server e le vostre applicazioni Windows come una macchina ben oliata con il monitoraggio del performance counter di Windows di PRTG. È il modo più semplice e intelligente per garantire che la vostra infrastruttura IT sopravviva e prosperi.
In PRTG, i “sensori” sono gli elementi base del monitoraggio. Un sensore monitora solitamente un valore misurato nella tua rete (ad esempio, il traffico di una porta switch, il carico della CPU di un server o lo spazio libero di un’unità disco). In media, occorrono circa 5-10 sensori per ogni dispositivo o un sensore per ogni porta switch.
Paessler ha condotto prove in oltre 600 dipartimenti IT in tutto il mondo per mettere a punto il suo software di monitoraggio di rete più vicino alle esigenze dei sysadmin. Il risultato è che più del 95% degli intervistati consiglierebbe PRTG – o lo ha già fatto.

Paessler PRTG è utilizzato da aziende di tutte le dimensioni. Gli amministratori di sistema adorano PRTG perché rende il loro lavoro molto più semplice.
Ampiezza di banda, server, ambienti virtuali, siti Web, servizi VoIP - PRTG tiene d'occhio la tua intera rete.
Tutti hanno esigenze di monitoraggio diverse. Ecco perché ti lasciamo provare PRTG gratuitamente. Inizia oggi stesso la tua prova.