К сожалению, эта страница ещё не переведена на русский язык.
Compare real-time and historic data to keep everyone informed
about trends and requirements in your network.
Create extensive reports for all sensors or for specific sensors only to review and analyze your monitoring data. You can generate your reports on demand or automatically via schedules – for maximum flexibility.
Put together in-depth reports for your fellow IT Sysadmins or more high-level reports for your management.
Use report templates to define, for example, if you want to show only graphs or also data tables. Or just select one of our preconfigured reports and let PRTG do the job.
A great way to quickly review the monitoring data of a specific sensor are historic data reports. They are a fast alternative to more comprehensive reports about your entire configuration, for example.
You can create historic data reports on demand. With only one click, you can quickly choose a specific time span for your report using the quick range buttons.
Export your historic data reports to your system as XML or CSV – so you can easily process the data further with third-party applications.
Configuration reports show you various details about the PRTG configuration such as information about the system configuration.
Use configuration reports to document changes to the PRTG configuration, for example. If you create a configuration report, PRTG directly displays it as an HTML page in a new browser window.
What’s great: all configuration reports are interactive so that you can directly navigate to the respective objects that the information refers to.
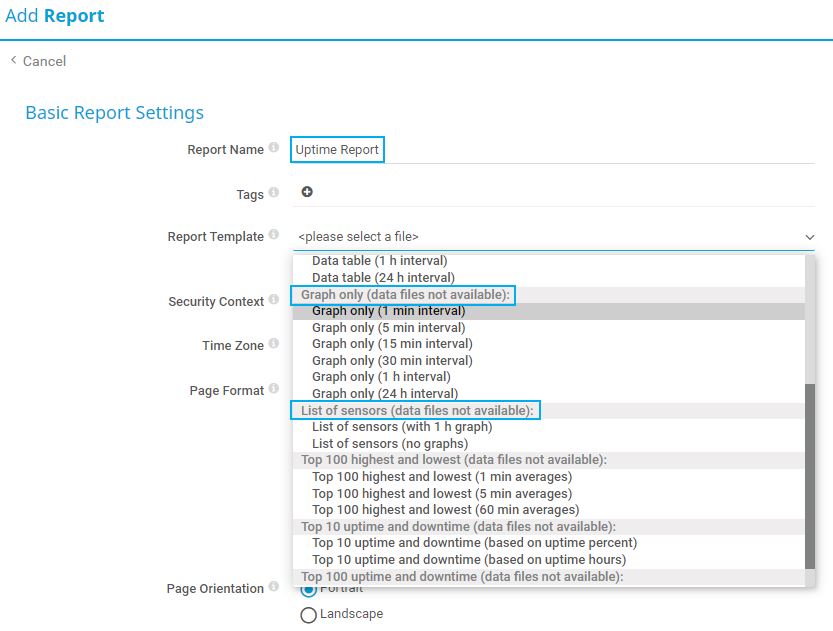
Selecting basic report settings
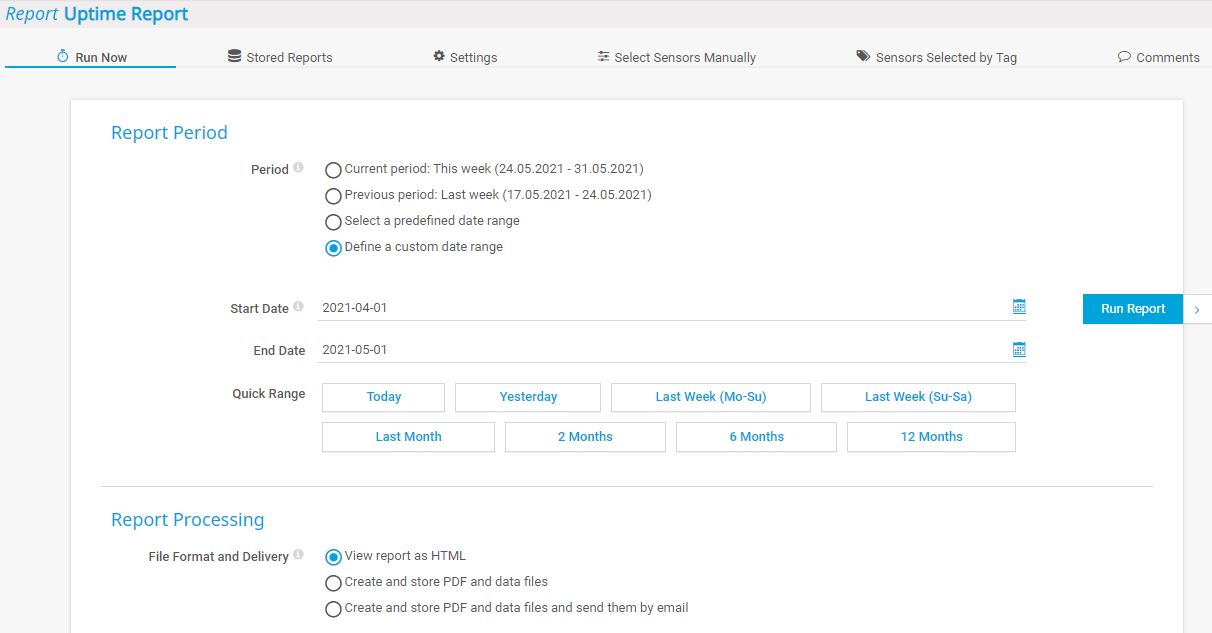
Running a report on demand
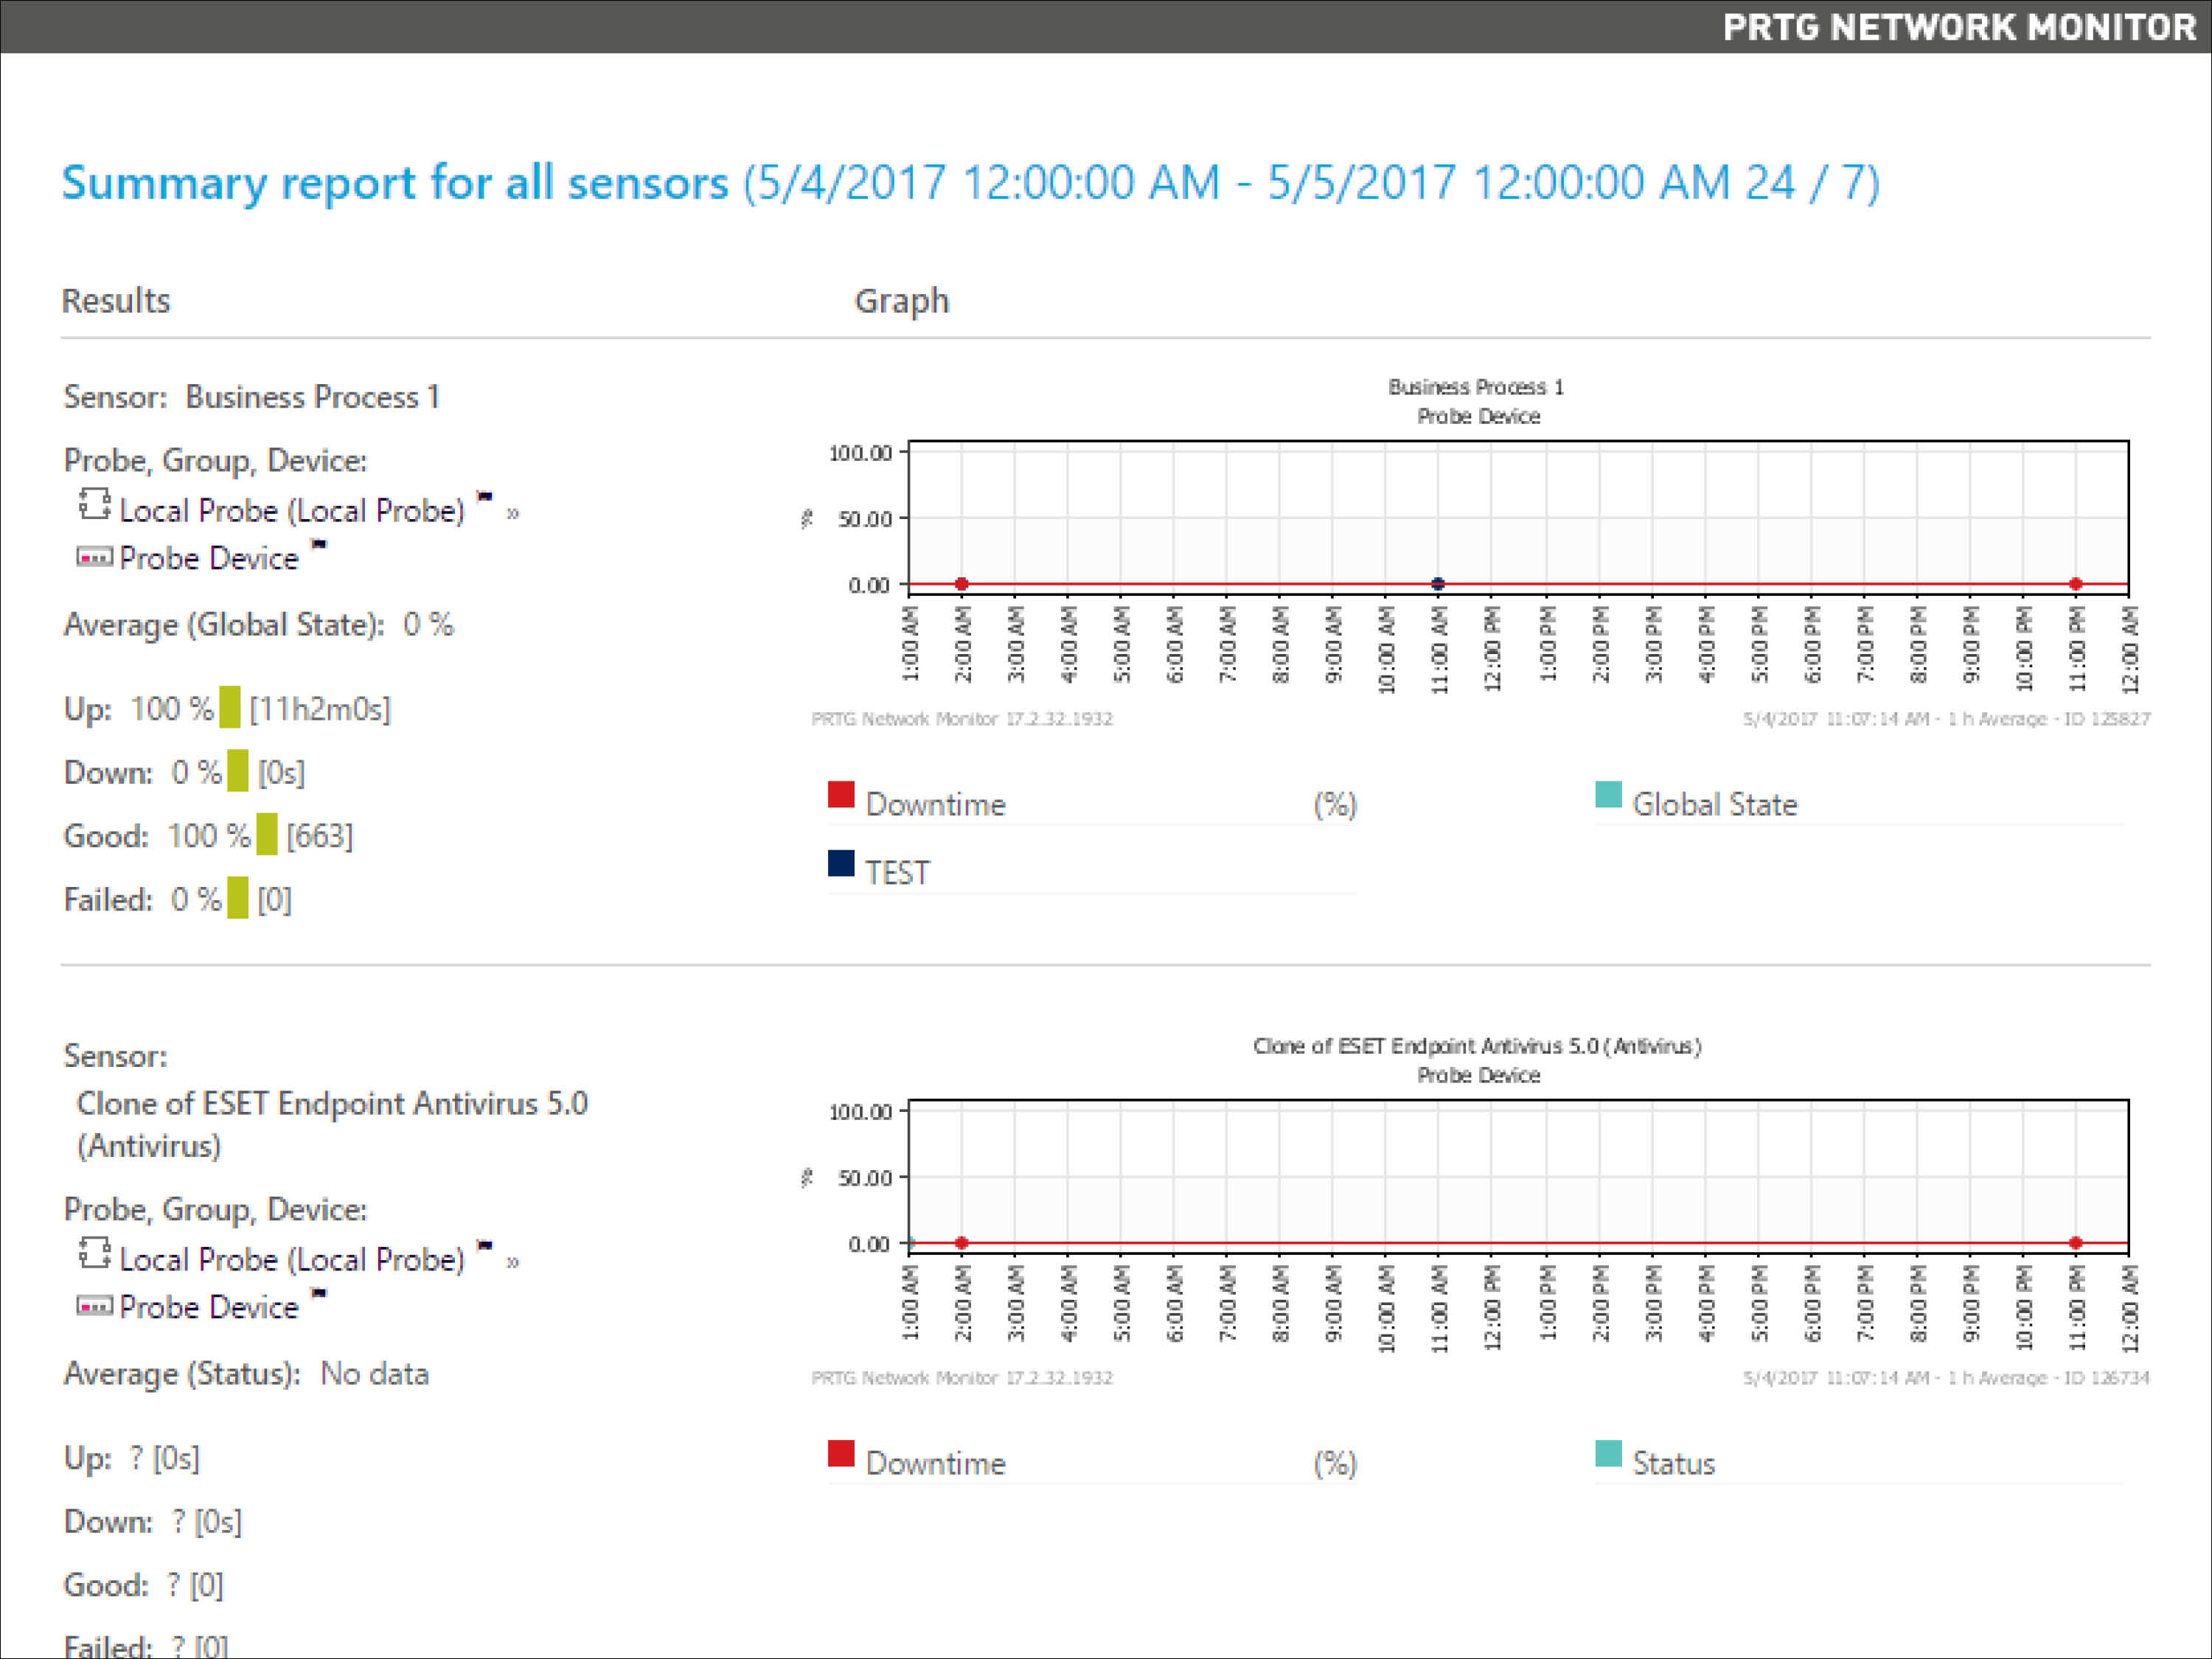
Summary report for all sensors

