- English
- Deutsch
- Español
- Français
- Italiano
- Português
A network analyzer answers three core questions: who is talking, what is consuming bandwidth, and where things are slowing down. The method depends on the environment. Some deployments rely on flow exports from routers and switches. Others need packet header inspection on local adapters, SNMP polling, or active probes like ping and DNS checks. Most real environments need more than one of these, because each method shows you something the others do not.
Paessler PRTG supports all of them from a single platform. Flow-based traffic breakdowns, interface-level device health, and availability checks share one interface, one alerting framework, and one historical data set. NetFlow, sFlow, IPFIX, jFlow, SNMP, Packet Sniffer, WMI. The full list of supported methods is further down the page.

PRTG picks up flow exports from your routers and switches and breaks traffic into Top Talkers, Top Connections, and Top Protocols views automatically. No manual log digging across multiple devices. When you need to identify which device, application, or IP address is driving utilization, the data is already there.
Objective VoIP quality data makes escalations straightforward. PRTG's Cisco IP SLA sensor via SNMP and QoS Round Trip / One Way sensors give you per-path MOS scores, jitter readings, RTT, and packet loss, timestamped and stored. That gives you the evidence to show whether a quality issue sits on your network or the provider's side.
Note: Cisco IP SLA sensor supports IPv4 only. QoS (Quality of Service) Round Trip and One Way sensors require a PRTG probe at each measured endpoint.

Live graphs, real-time performance data
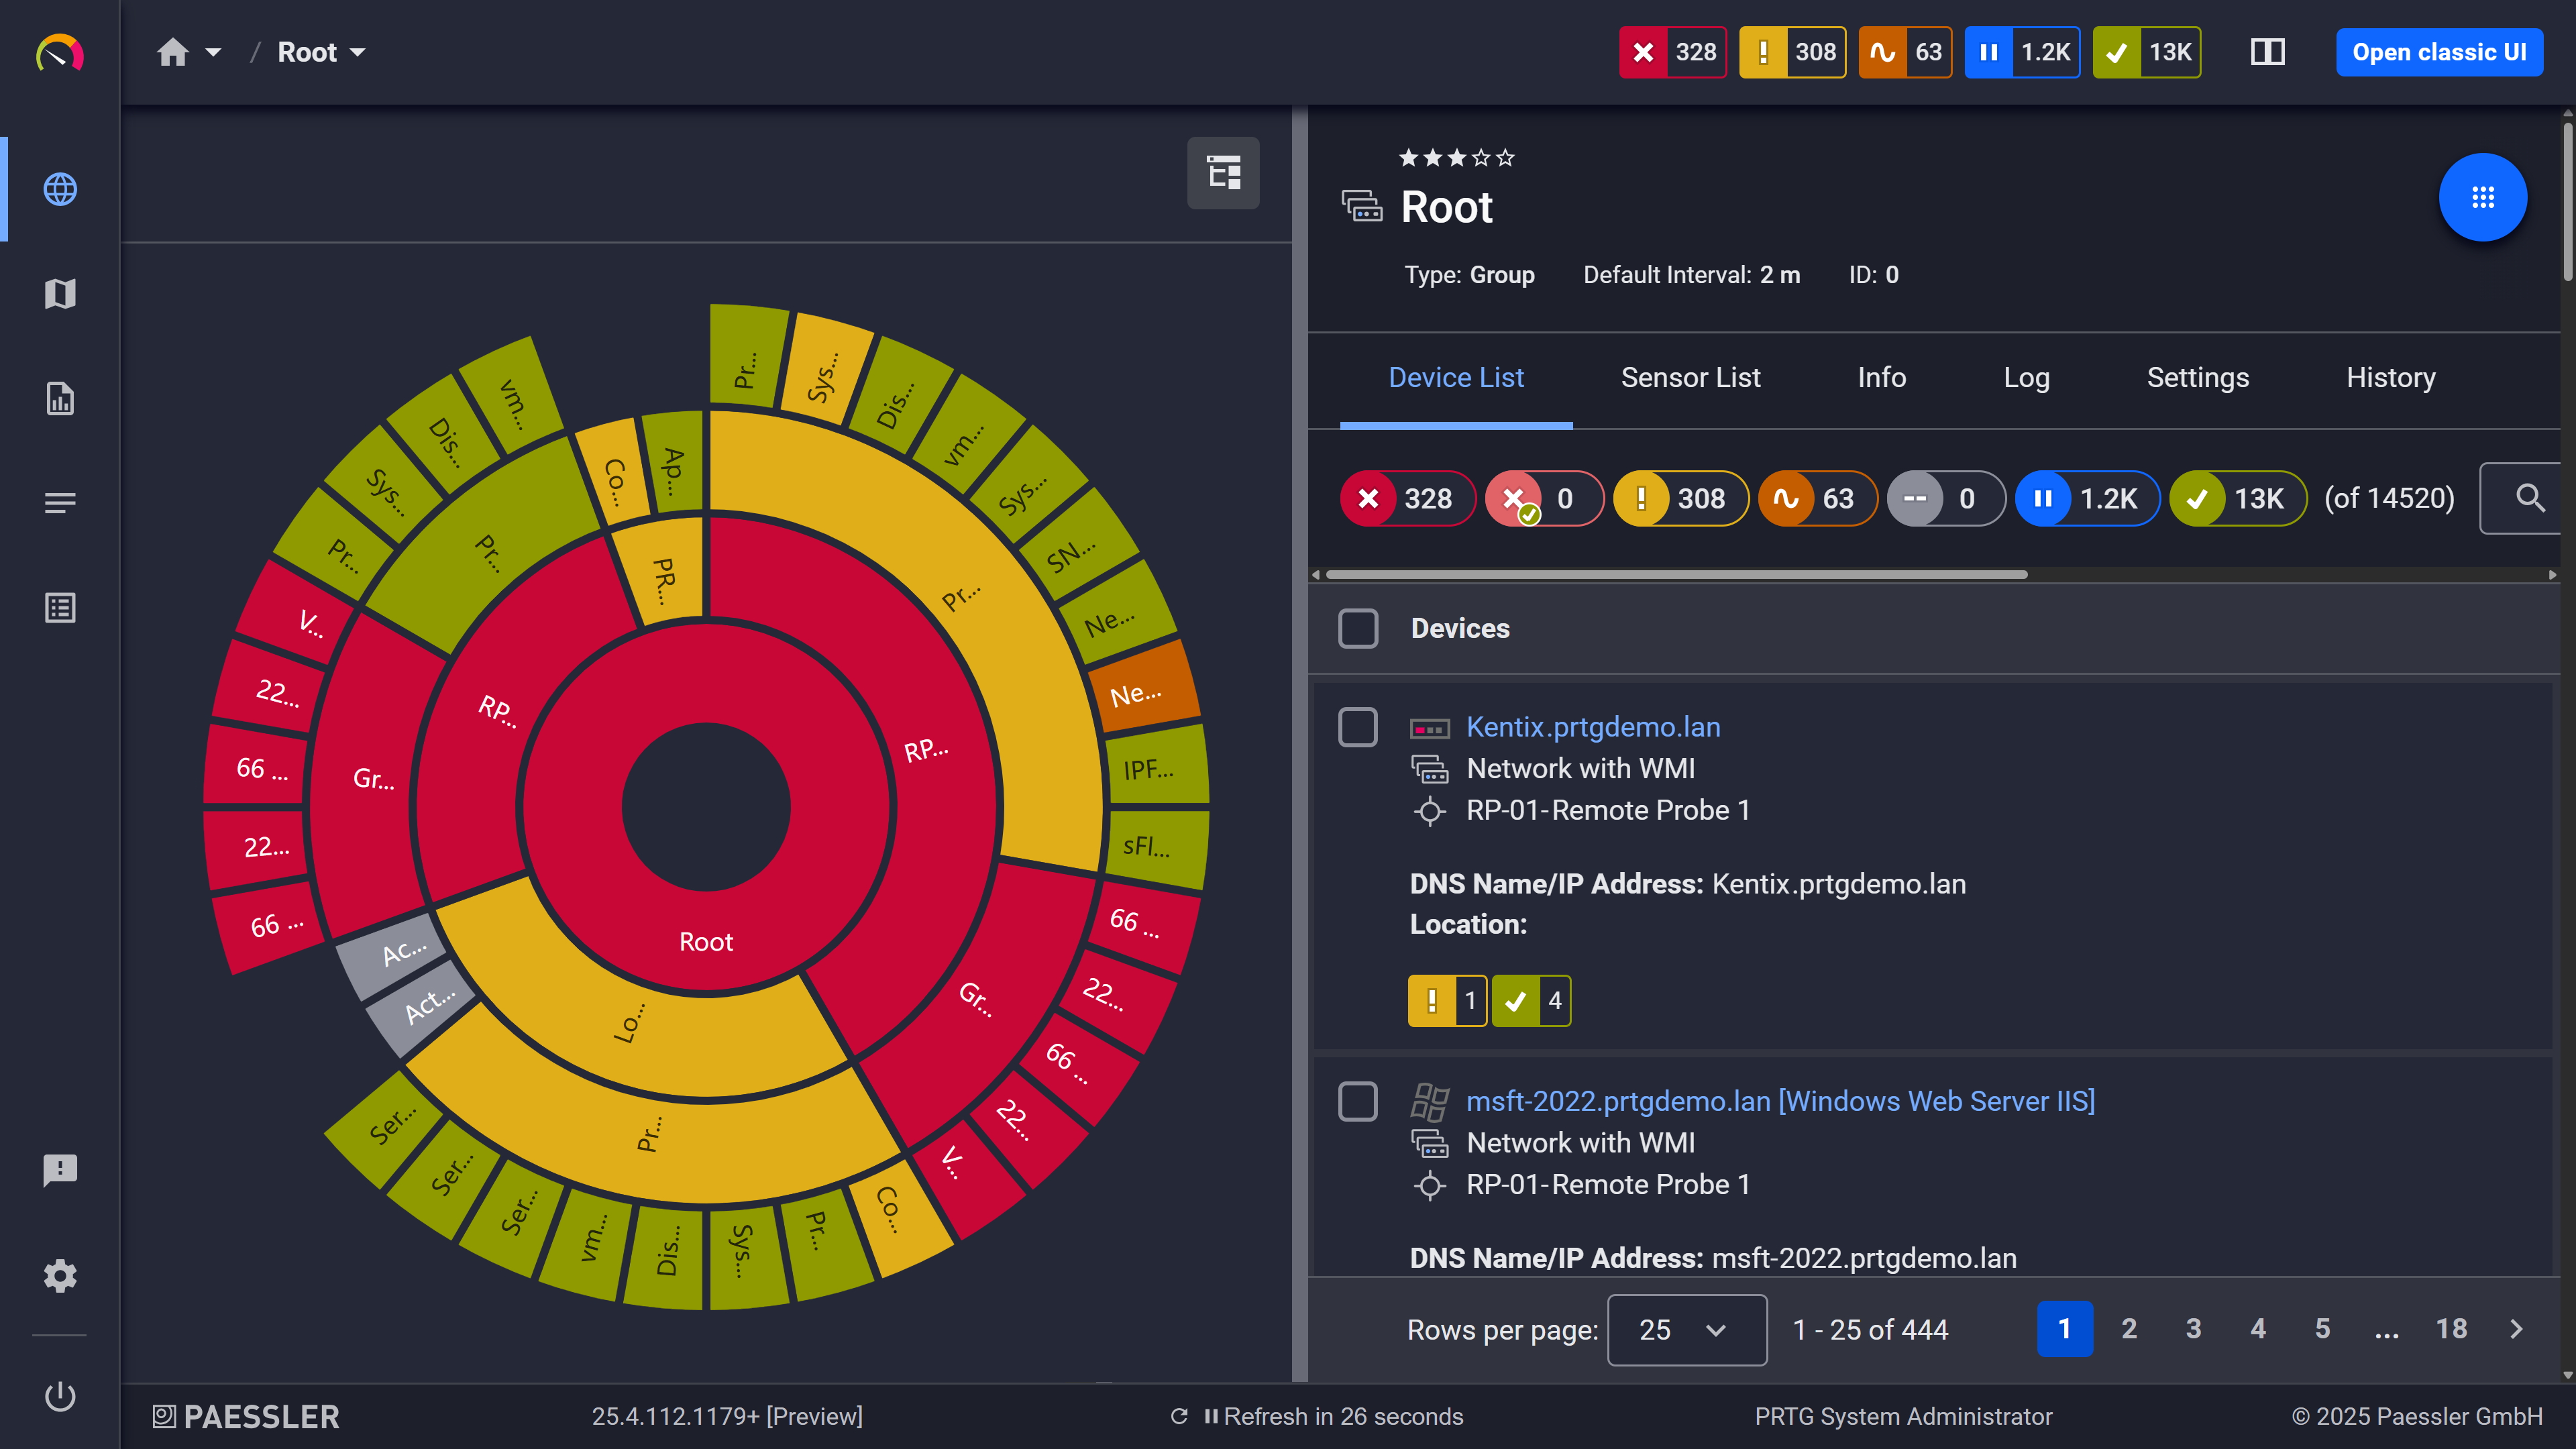
Your entire network, visualized instantly
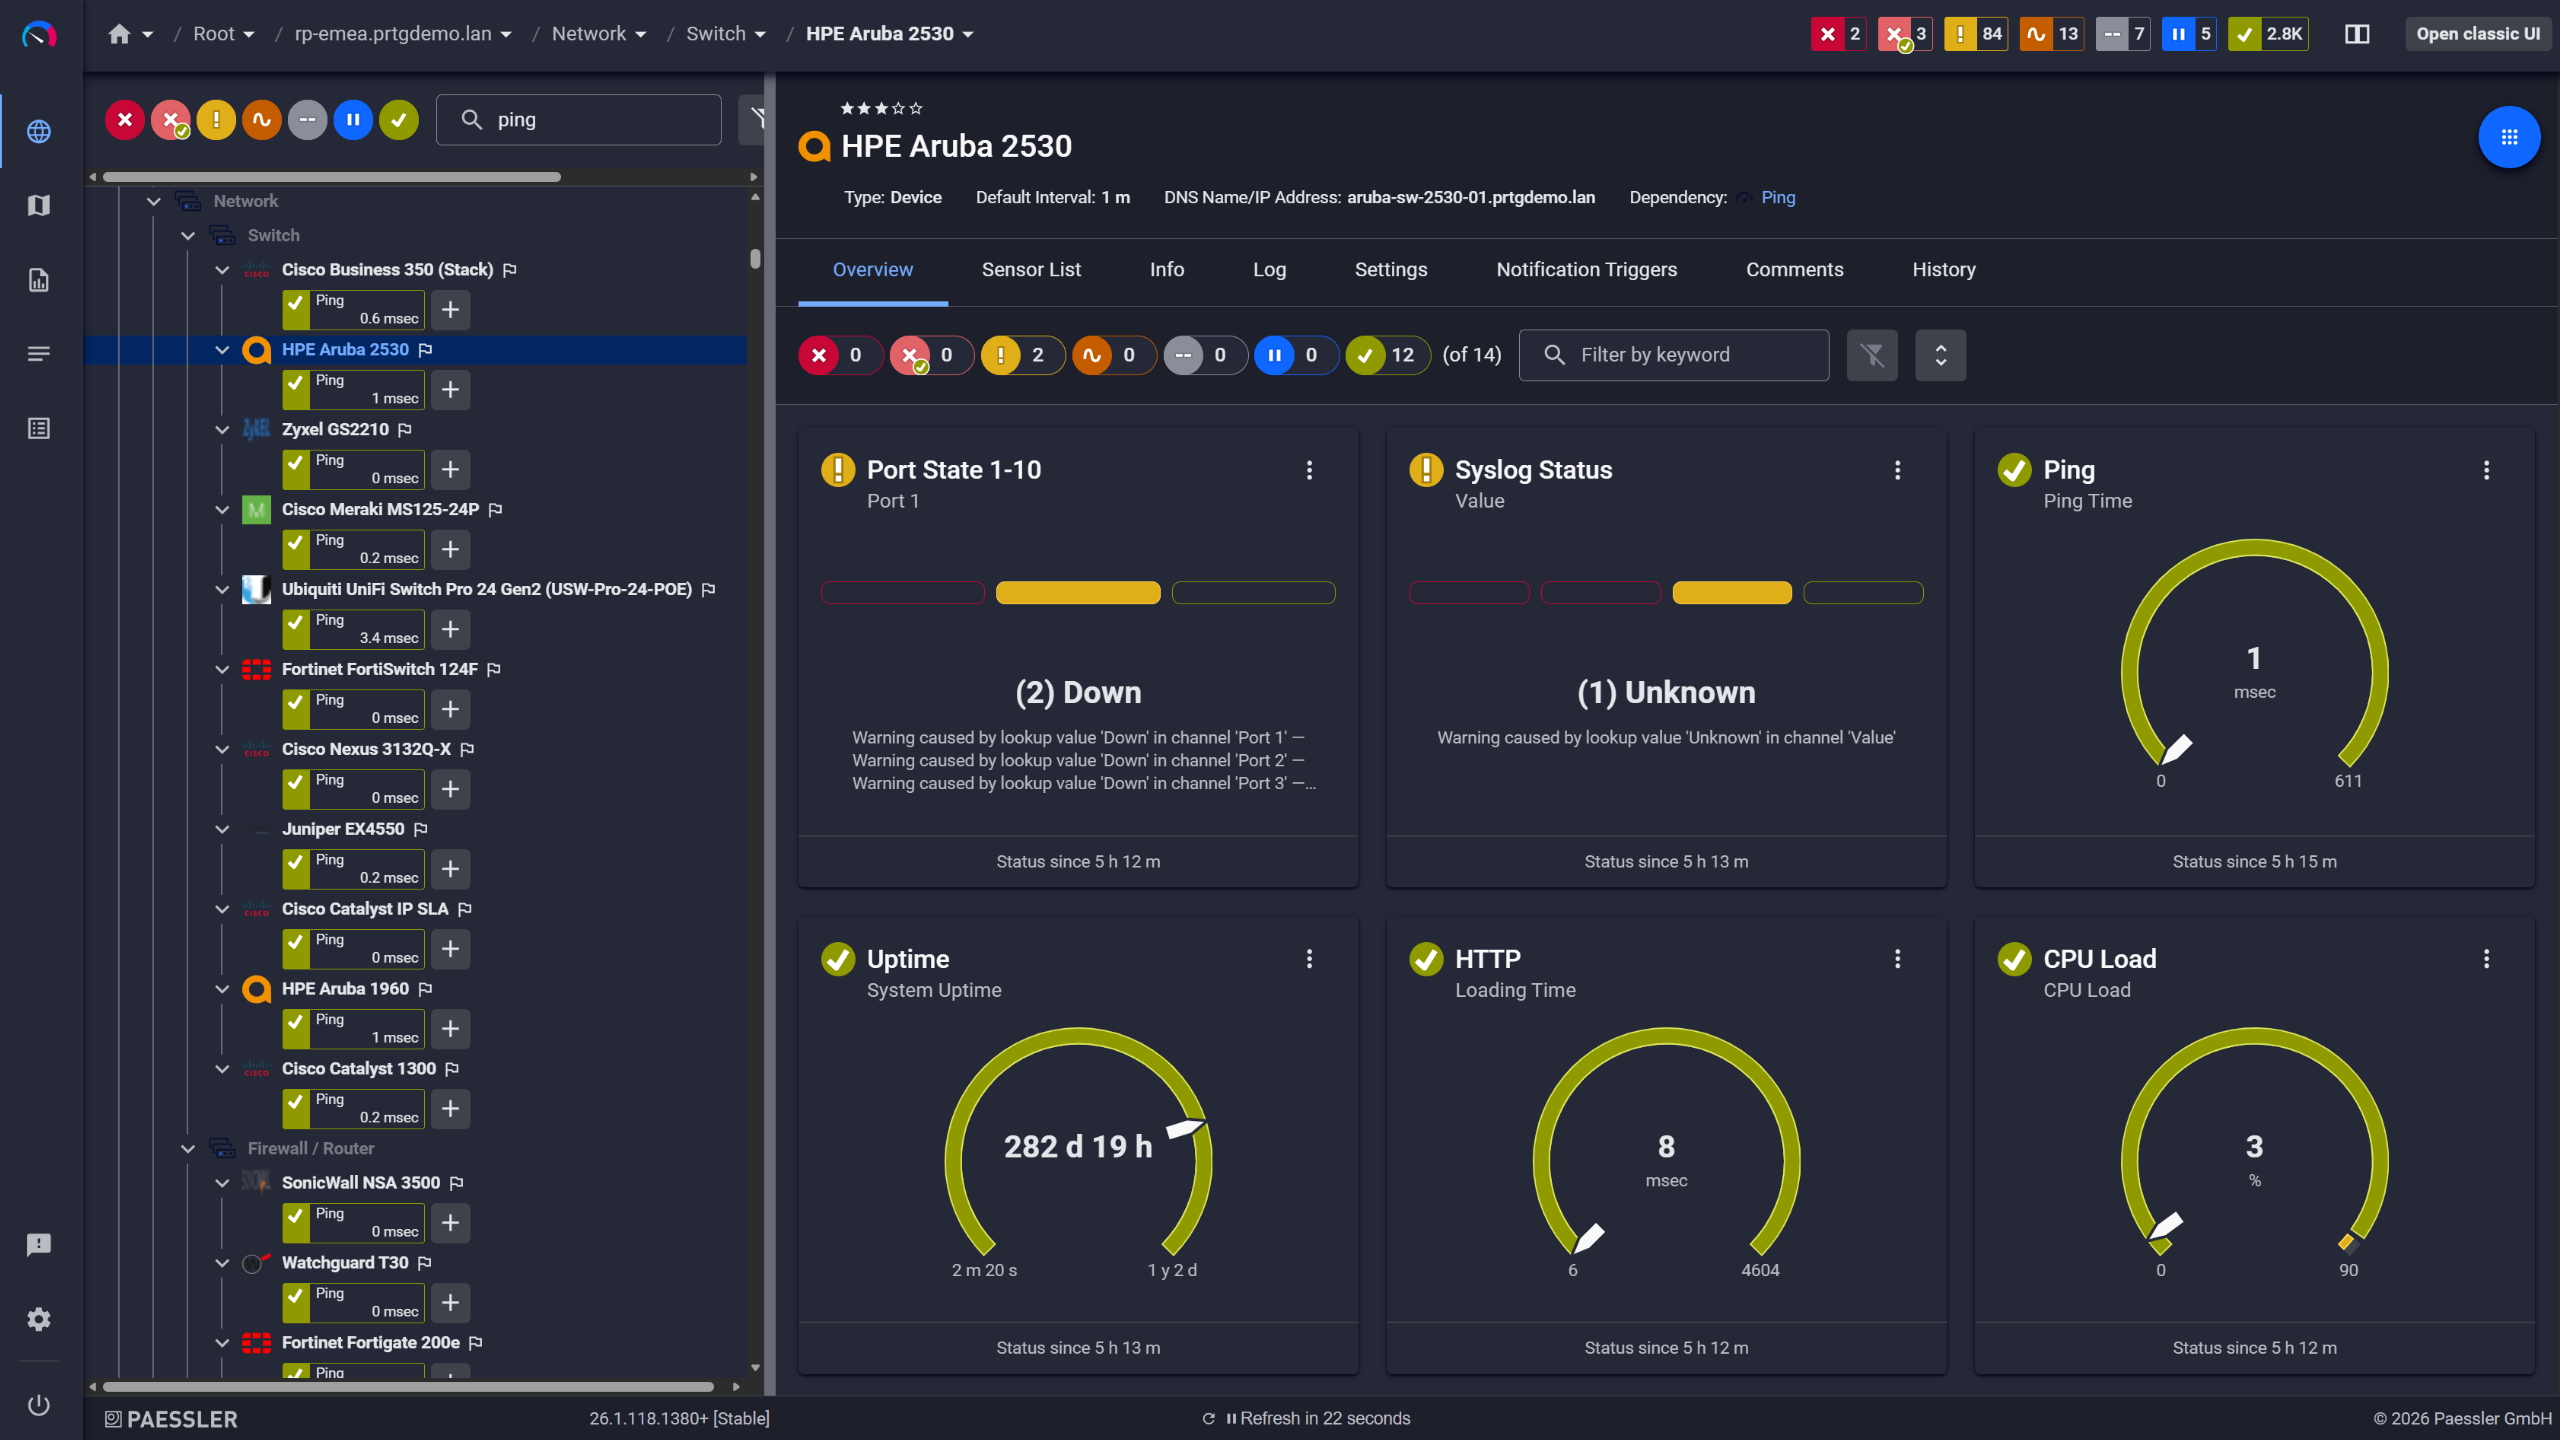
Network switches monitored across vendors
Traffic history turns capacity conversations into data-backed decisions. PRTG stores sensor data continuously across all monitored interfaces, with historical reports available per sensor for any time range, from one day to six months or more, delivered automatically on whatever schedule you configure.
Start monitoring your infrastructure in minutes. No professional services, no complex configuration, no risk.
PRTG remote probes give distributed environments consistent traffic visibility at every site without standing up separate tools at each location. The classic probe runs on Windows 10+; the multi-platform version covers Debian, Ubuntu, and RHEL. Either way, traffic data and local device metrics feed back to your central PRTG core server across firewalls and NAT. If you're running multiple independent PRTG instances, PRTG MultiBoard (available with PRTG Enterprise Monitor) pulls them into one view.
Note: The multi-platform probe supports core monitoring functions. Some sensor types available on the classic Windows probe are not currently supported on the Linux version.
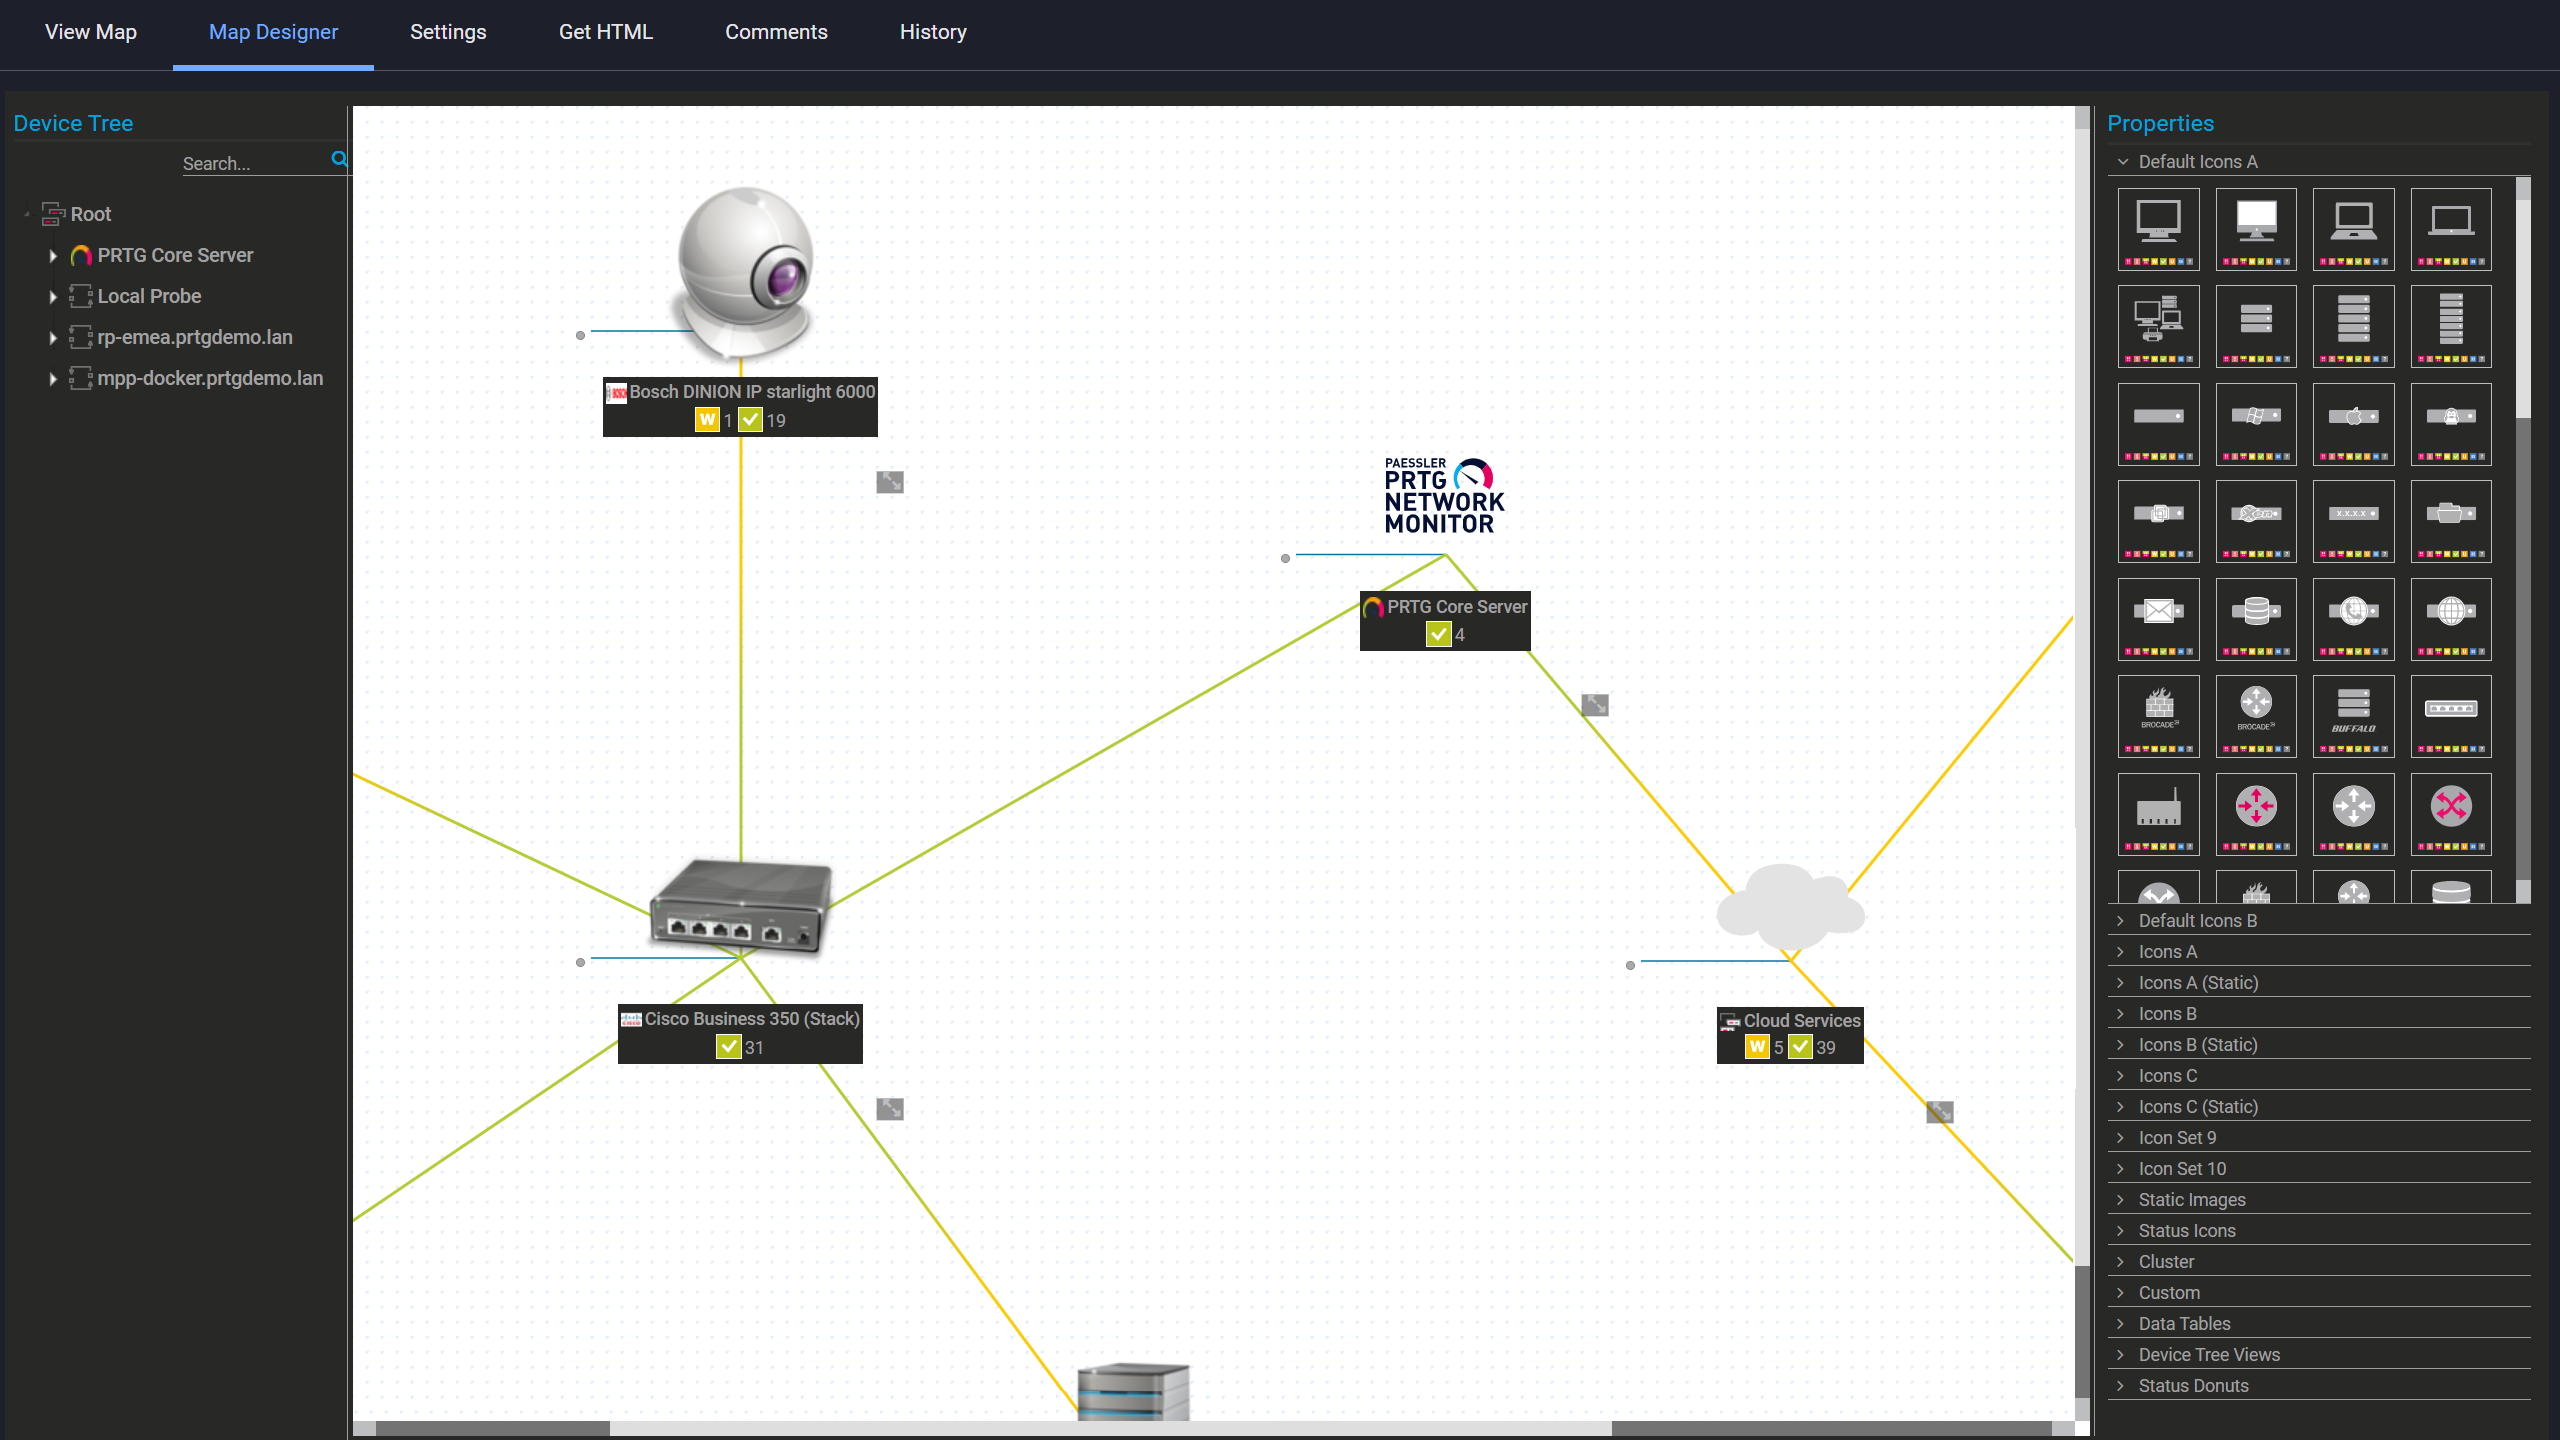
Custom maps with live status
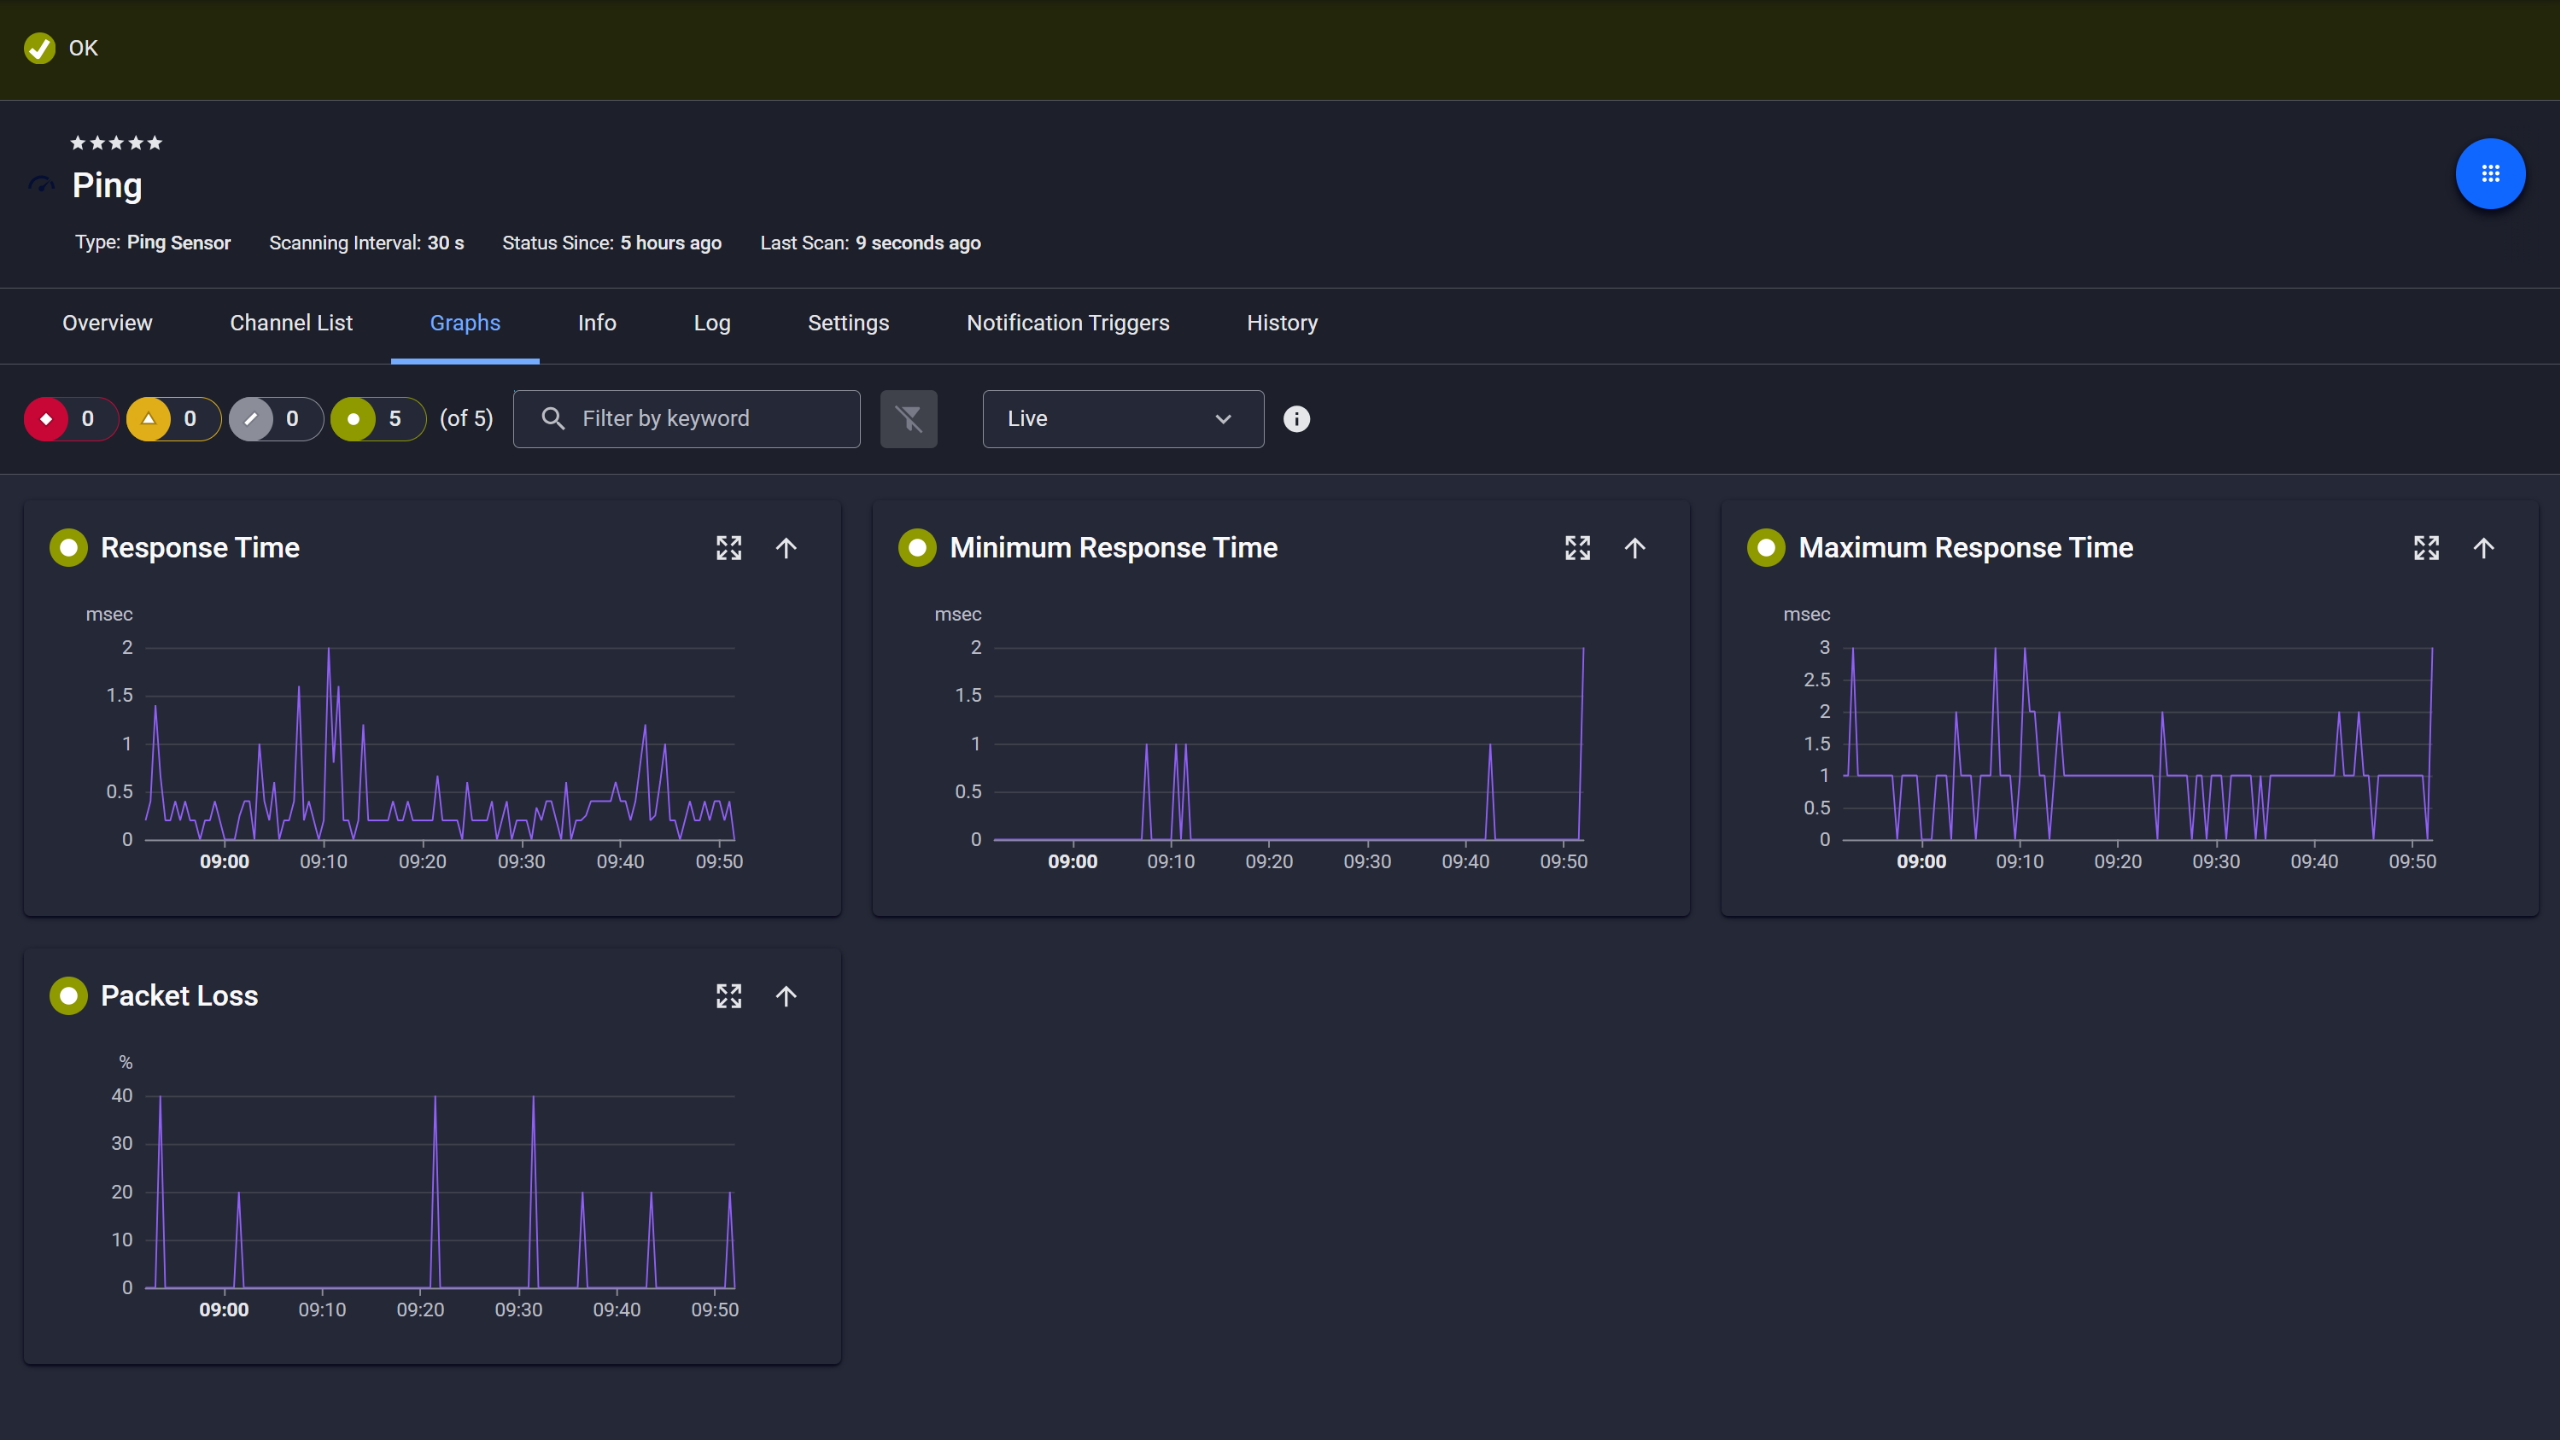
Ping response and packet loss

Scheduled reports, always on time
PRTG covers flow-based traffic analysis, SNMP device monitoring, availability checks, alerting, and reporting in one platform with one interface and one shared data set. All sensor data feeds the same alerting framework, so during troubleshooting you work from a single context rather than switching between tools to piece together what happened.
There's no single way to monitor network traffic. PRTG runs several methods in parallel because each one tells you something the others don't. Here's how each works.
FEATURE | Without PRTG Without PRTG | With PRTG With PRTG |
|---|---|---|
Identify top bandwidth consumers | Without PRTG Manual log review across multiple devices | With PRTG Top Talkers view built into flow sensor data |
VoIP path quality data | Without PRTG None, or a separate dedicated QoS tool | With PRTG Built-in Cisco IP SLA sensor + QoS (Quality of Service) Round Trip sensor |
Historical traffic reports | Without PRTG Manual data export and spreadsheet assembly | With PRTG Scheduled, automated reports per interface |
Multi-site visibility | Without PRTG Separate tool per site, or none | With PRTG Remote probes feeding one central dashboard |
Traffic threshold alerts | Without PRTG Manual threshold configuration in firewall only | With PRTG Per-sensor alerting with escalation and routing |
Choose the PRTG Network Monitor subscription that's best for you.
| License Name | License description | Price | License Details | Get started | Pricing Details | |
|---|---|---|---|---|---|---|
| PRTG 500 | $200 | per month paid annually | Buy nowBuy now | Enough to monitor multiple aspects of 50 devices | ||
| PRTG 1000 | $358 | per month paid annually | Buy nowBuy now | Enough to monitor multiple aspects of 100 devices | ||
| PRTG 2500 | $742 | per month paid annually | Buy nowBuy now | Enough to monitor multiple aspects of 250 devices | ||
| PRTG 5000 | $1,300 | per month paid annually | Buy nowBuy now | Enough to monitor multiple aspects of 500 devices | ||
| PRTG 10000 | $1,642 | per month paid annually | Buy nowBuy now | Enough to monitor multiple aspects of 1000 devices |

A network analyzer captures traffic data on a computer network and tells you what's happening on it. Which devices are talking, what's consuming bandwidth, and whether network parameters like latency or packet loss are creeping out of range. How network analysis works depends on the tool: some rely on flow exports from routers and switches (NetFlow, sFlow, IPFIX), some use packet header inspection on a local adapter, some poll network devices directly via SNMP. Most real deployments use more than one of these. The point is giving IT teams enough data to troubleshoot problems, make better capacity calls, and not find out about issues from a user ticket.
Yes. Most sensor types work with IPv6. SNMP polling, Ping, flow sensors included. Device polling via SNMP supports v1, v2c, and v3.
One exception worth knowing: the Cisco IP SLA sensor is IPv4 only. If VoIP monitoring on your network relies on Cisco IP SLA, that sensor won't cover IPv6-only paths.
PRTG monitors WiFi access points and connected devices via SNMP. That means availability status, traffic on WiFi interfaces, and connected device counts on access points that actually expose this data. Flow data from traffic passing through WiFi segments is also supported, handled the same way as wired LAN.
What isn't covered: RF spectrum analysis and signal strength mapping. Interference detection falls outside this too. Those need dedicated wireless tools. What PRTG does here is infrastructure monitoring: device up/down and traffic data, not wireless signal analysis.
On the flow side: NetFlow v5/v9, sFlow, IPFIX, jFlow. Device polling runs via SNMP v1/v2c/v3 and WMI. The Packet Sniffer sensor handles header-based local traffic classification. Connectivity monitoring has its own set of sensors covering Ping/ICMP, open port checks, DNS, traceroute, and SSH. Each runs as a separate sensor type.
If your environment includes OT and IoT alongside IT, PRTG also supports OPC UA, MQTT, and Modbus. Useful if you're monitoring industrial or mixed IT/OT networks from one platform.
No. PRTG is a commercial product. There's a time-limited free trial with full functionality. There's also a permanent free tier capped at 100 sensors, which is enough for smaller environments or for actually testing the platform before committing to a license.
Open-source tools give you more flexibility at the protocol and scripting level. What that flexibility costs is setup time and the integration work of connecting components that weren't built to talk to each other. For teams that need broad monitoring coverage without that overhead, PRTG is faster to get running. One interface, everything included.
Network Monitoring Software – Version 26.1.116.1532 (February 9th, 2026)
Download for Windows and cloud-based version PRTG Hosted Monitor available
English, German, Spanish, French, Portuguese, Dutch, Russian, Japanese, and Simplified Chinese
Network devices, bandwidth, servers, applications, virtual environments, remote systems, IoT, and more
Choose the PRTG Network Monitor subscription that's best for you


