
Syslog è uno standard per la registrazione dei messaggi di sistema. Molti dispositivi di rete supportano lo standard Syslog per essere utilizzati nella gestione della rete e negli audit di sicurezza o per inviare, ad esempio, messaggi a scopo analitico o di debug.
Le trappole SNMP sono notifiche asincrone provenienti da dispositivi di rete che supportano SNMP. Queste notifiche vengono attivate per segnalare incidenti importanti come eventi di sistema, interruzioni o altri problemi critici.
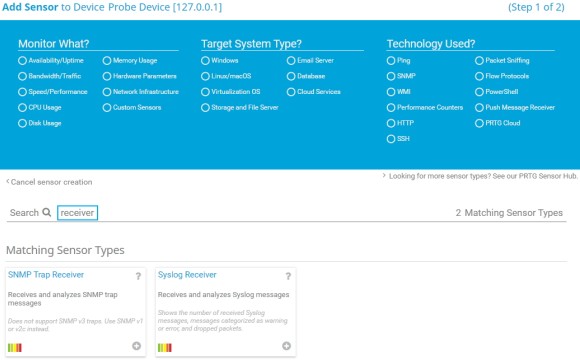
È possibile implementare PRTG Network Monitor come una sorta di server Syslog e di ricevitore di trappole SNMP utilizzando i rispettivi sensori nativi: il sensore e il sensore Syslog Receiver e il sensore SNMP Trap Receiver in questa guida vi forniremo un esempio di come impostare il monitoraggio dei messaggi Syslog e SNMP trap.
Prima di iniziare l'installazione di UPS (alimentazione elettrica ininterrotta) Syslog Receiver e SNMP Trap Receiver sensori, considerare quanto segue:
Ottieni una visibilità completa con dashboard in tempo reale, avvisi e sensori personalizzabili
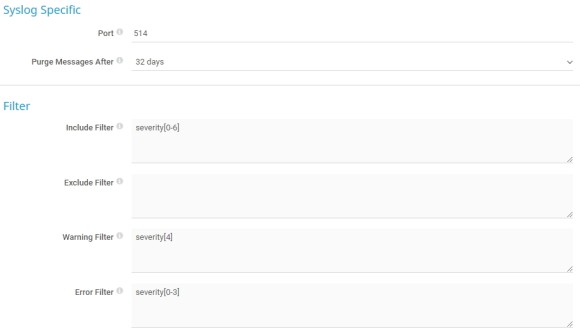
3. Per la prima configurazione, lasciare le impostazioni e i filtri predefiniti per vedere quali dati riceve effettivamente il PRTG.
La porta predefinita su cui il PRTG ascolta i messaggi Syslog è la 514. La porta predefinita su cui PRTG ascolta i messaggi SNMP traps è 162.
In base alle impostazioni predefinite dei filtri del sensore, il sensore mostra lo stato Attenzione il sensore Syslog Receiver mostra lo stato Warning se c'è stato almeno un messaggio Syslog con gravità 4 e lo stato Down se c'è stato almeno un messaggio con gravità 3 o inferiore durante l'ultima scansione del sensore.
4. Fare clic su Crea per aggiungere il sensore. Poiché il dispositivo di origine non è ancora stato configurato, PRTG non riceve dati e mostra lo stato Sconosciuto.
Prima che PRTG possa iniziare a ricevere messaggi Syslog o SNMP trap, è necessario configurare il dispositivo che invia i messaggi in modo che punti ai sensori corrispondenti di PRTG. Per la configurazione, consultare la documentazione del rispettivo fornitore.
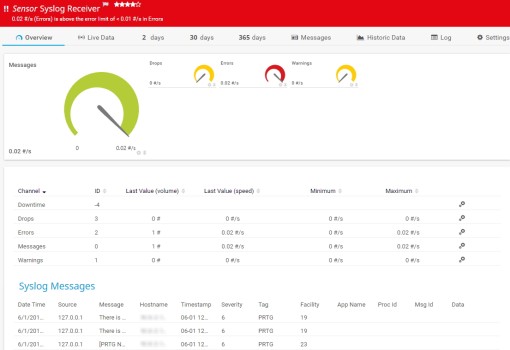
Quando il dispositivo sorgente inizia a inviare messaggi Syslog o Trap SNMP al sistema di sonde definito, i messaggi inviati che corrispondono al Filtro di inclusione appaiono automaticamente nell'interfaccia web PRTG. È possibile trovare i messaggi nella scheda Panoramica del rispettivo sensore nella sezione Messaggi Syslog o Messaggi Trap SNMP, nonché nella scheda Messaggi del sensore.
Durante ogni intervallo di scanning, PRTG conta i messaggi Syslog o Trap SNMP ricevuti e ne visualizza il numero nei rispettivi canali. I canali mostrano il numero totale di messaggi ricevuti e il numero totale di messaggi abbandonati, di errore e di warning.
Il PRTG definisce gli stati del sensore per ogni scansione del sensore. Ciò significa che se il sensore riceve un messaggio Syslog o una trappola SNMP che conta come errore, il sensore mostra lo stato Down per un intervallo di scanning. Se durante questo intervallo di scanning non compare alcun nuovo messaggio di errore, il sensore mostra nuovamente lo stato Up.
Avvisi personalizzati e visualizzazione dei dati ti aiutano a identificare e prevenire rapidamente ogni tipo di problema
PRTG elabora e memorizza tutti i messaggi Syslog o SNMP trap in arrivo che corrispondono all'impostazione Filtro includi. In questo caso, l'impostazione predefinita è severità[0-6] per il sensore e qualsiasi per il sensore Syslog Receiver e qualsiasi per il sensore SNMP Trap Receiver.
I dati ricevuti si trovano nelle sottocartelle \Syslog Database e \Trap Database della PRTG data directory. PRTG crea un file di dati all'ora.
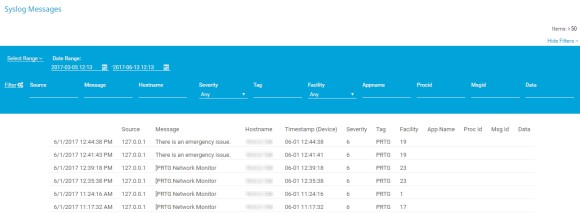
Per esaminare i messaggi Syslog o SNMP trap ricevuti, accedere alla scheda Messaggi del rispettivo sensore nell'interfaccia web PRTG. È possibile filtrare i messaggi in base alla data e a vari altri parametri.
Nota: I parametri inseriti nei campi del filtro sono sensibili alle maiuscole e devono corrispondere esattamente ai parametri del messaggio Syslog o della trappola SNMP.
Per rendere più comprensibili i messaggi delle trappole SNMP, è possibile aggiungere i file MIB dei dispositivi alla sottocartella \MIB della directory del programma PRTG. In questo modo, PRTG può risolvere gli identificatori di oggetto (OID) in un testo più comprensibile. Ad esempio, l'OID 1.3.6.1.4.1.32446.1.1.2 è visualizzato come SNMPv2-SMI-v1::enterprises.32446.1.1.2 = 0.
Per migliorare le prestazioni del vostro Syslog Receiver e SNMP Trap Receiver sensori e per raccogliere solo i dati realmente necessari, è possibile regolare i filtri dei messaggi nelle impostazioni dei sensori.
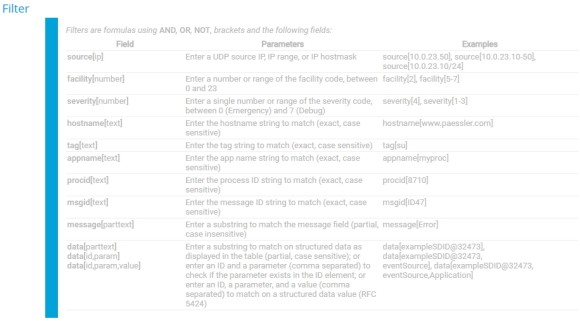
Accedere alla scheda Impostazioni del sensore in questione e utilizzare le regole di filtro fornite nella sezione Filtri per definire i seguenti filtri:
Per funzionare, le regole di filtro devono avere una sintassi corretta. Per ulteriori informazioni, vedere le regole di filtro per il sensore Syslog Receiver e le regole di filtro per il sensore SNMP Trap Receiver.
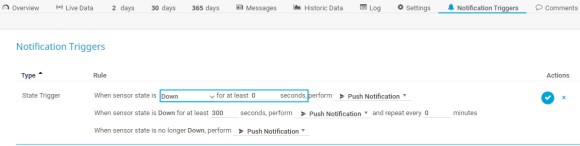
Per impostazione predefinita, i canali Warning ed Errore del pannello di controllo el sensore Syslog Receiver e del sensore SNMP Trap Receiver hanno un limite superiore di Warning ed Errore molto basso, pari a 0,00000001. In questo modo, è sufficiente un solo messaggio Syslog o SNMP trap che conta come messaggio di avviso o di errore perché PRTG mostri lo stato Warning o Down.
Se si desidera ottenere un'attivazione della notifica quando il PRTG riceve un messaggio di avviso o di errore, la prassi migliore è aggiungere un trigger di stato per lo stato Down e un trigger di stato per lo stato Warning al rispettivo sensore:

