Download a free, fully-featured 30-day trial.


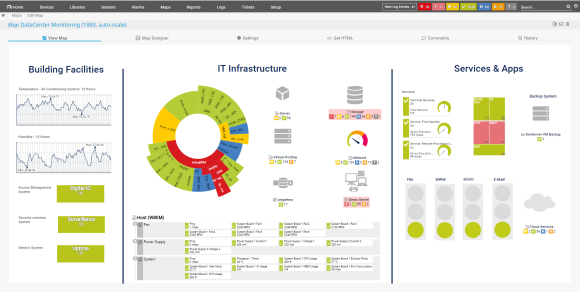
Know what’s up and what’s not: Monitor all your systems, devices, traffic, and applications.
Monitor specific datasets from your databases with individually-configured PRTG sensors and SQL queries.
Manage all your applications and get detailed statistics about every application running in your network.
Monitor all types of servers in real time with regard to availability, accessibility, capacity, and overall reliability.
Keep track of your entire local network, including your workstations, routers, switches, servers, and printers.
Monitor everything with PRTG!

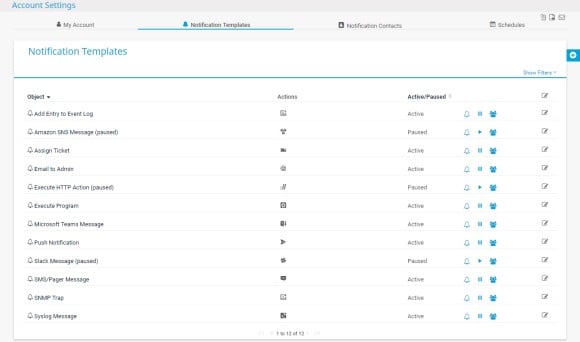
Users can customize and extend the functionality of PRTG using the HTTP API or custom sensors.
Transparent licensing and fair pricing that fits any budget and company size. See our pricing.
We have built PRTG with you in mind.
If you need our assistance, we're happy to help.
“All-around winning
network monitor”
“The real beauty of PRTG is the endless possibilities it offers”
“PRTG Network Monitor
is very hard to beat”
Download a free, fully-featured 30-day trial.