- English
- Deutsch
- Español
- Français
- Italiano
- Português
Database performance issues rarely announce themselves cleanly. Slow queries, connection pool exhaustion, resource saturation on the host, or a cloud instance running out of IOPS: each one shows up differently, and tracking them across multiple database platforms and environments without a unified view means gaps. Most teams find out something went wrong from an application error or a user complaint, not from their monitoring.
Paessler PRTG connects to databases via native protocols, ODBC/ADO connections, and cloud provider APIs, covering both on-premises and cloud environments in one place. Custom SQL queries run at intervals you define, execution time is measured at the connection and query level separately, and threshold-based alerts fire before resource limits or performance degradations reach applications. Supported platforms: Microsoft SQL Server, MySQL, PostgreSQL, Oracle, Azure SQL Database, AWS RDS (MySQL, PostgreSQL, MariaDB, Oracle, SQL Server), and any ODBC/ADO-compatible database.

Slow queries degrade application response times. Usually you only find out when users start complaining, and by then you're already in reactive mode. PRTG runs your custom SQL queries at defined intervals and measures execution time for each statement, connection overhead included. When execution time creeps past your defined threshold PRTG fires an alert, giving you time to optimize queries before they hit production workloads.
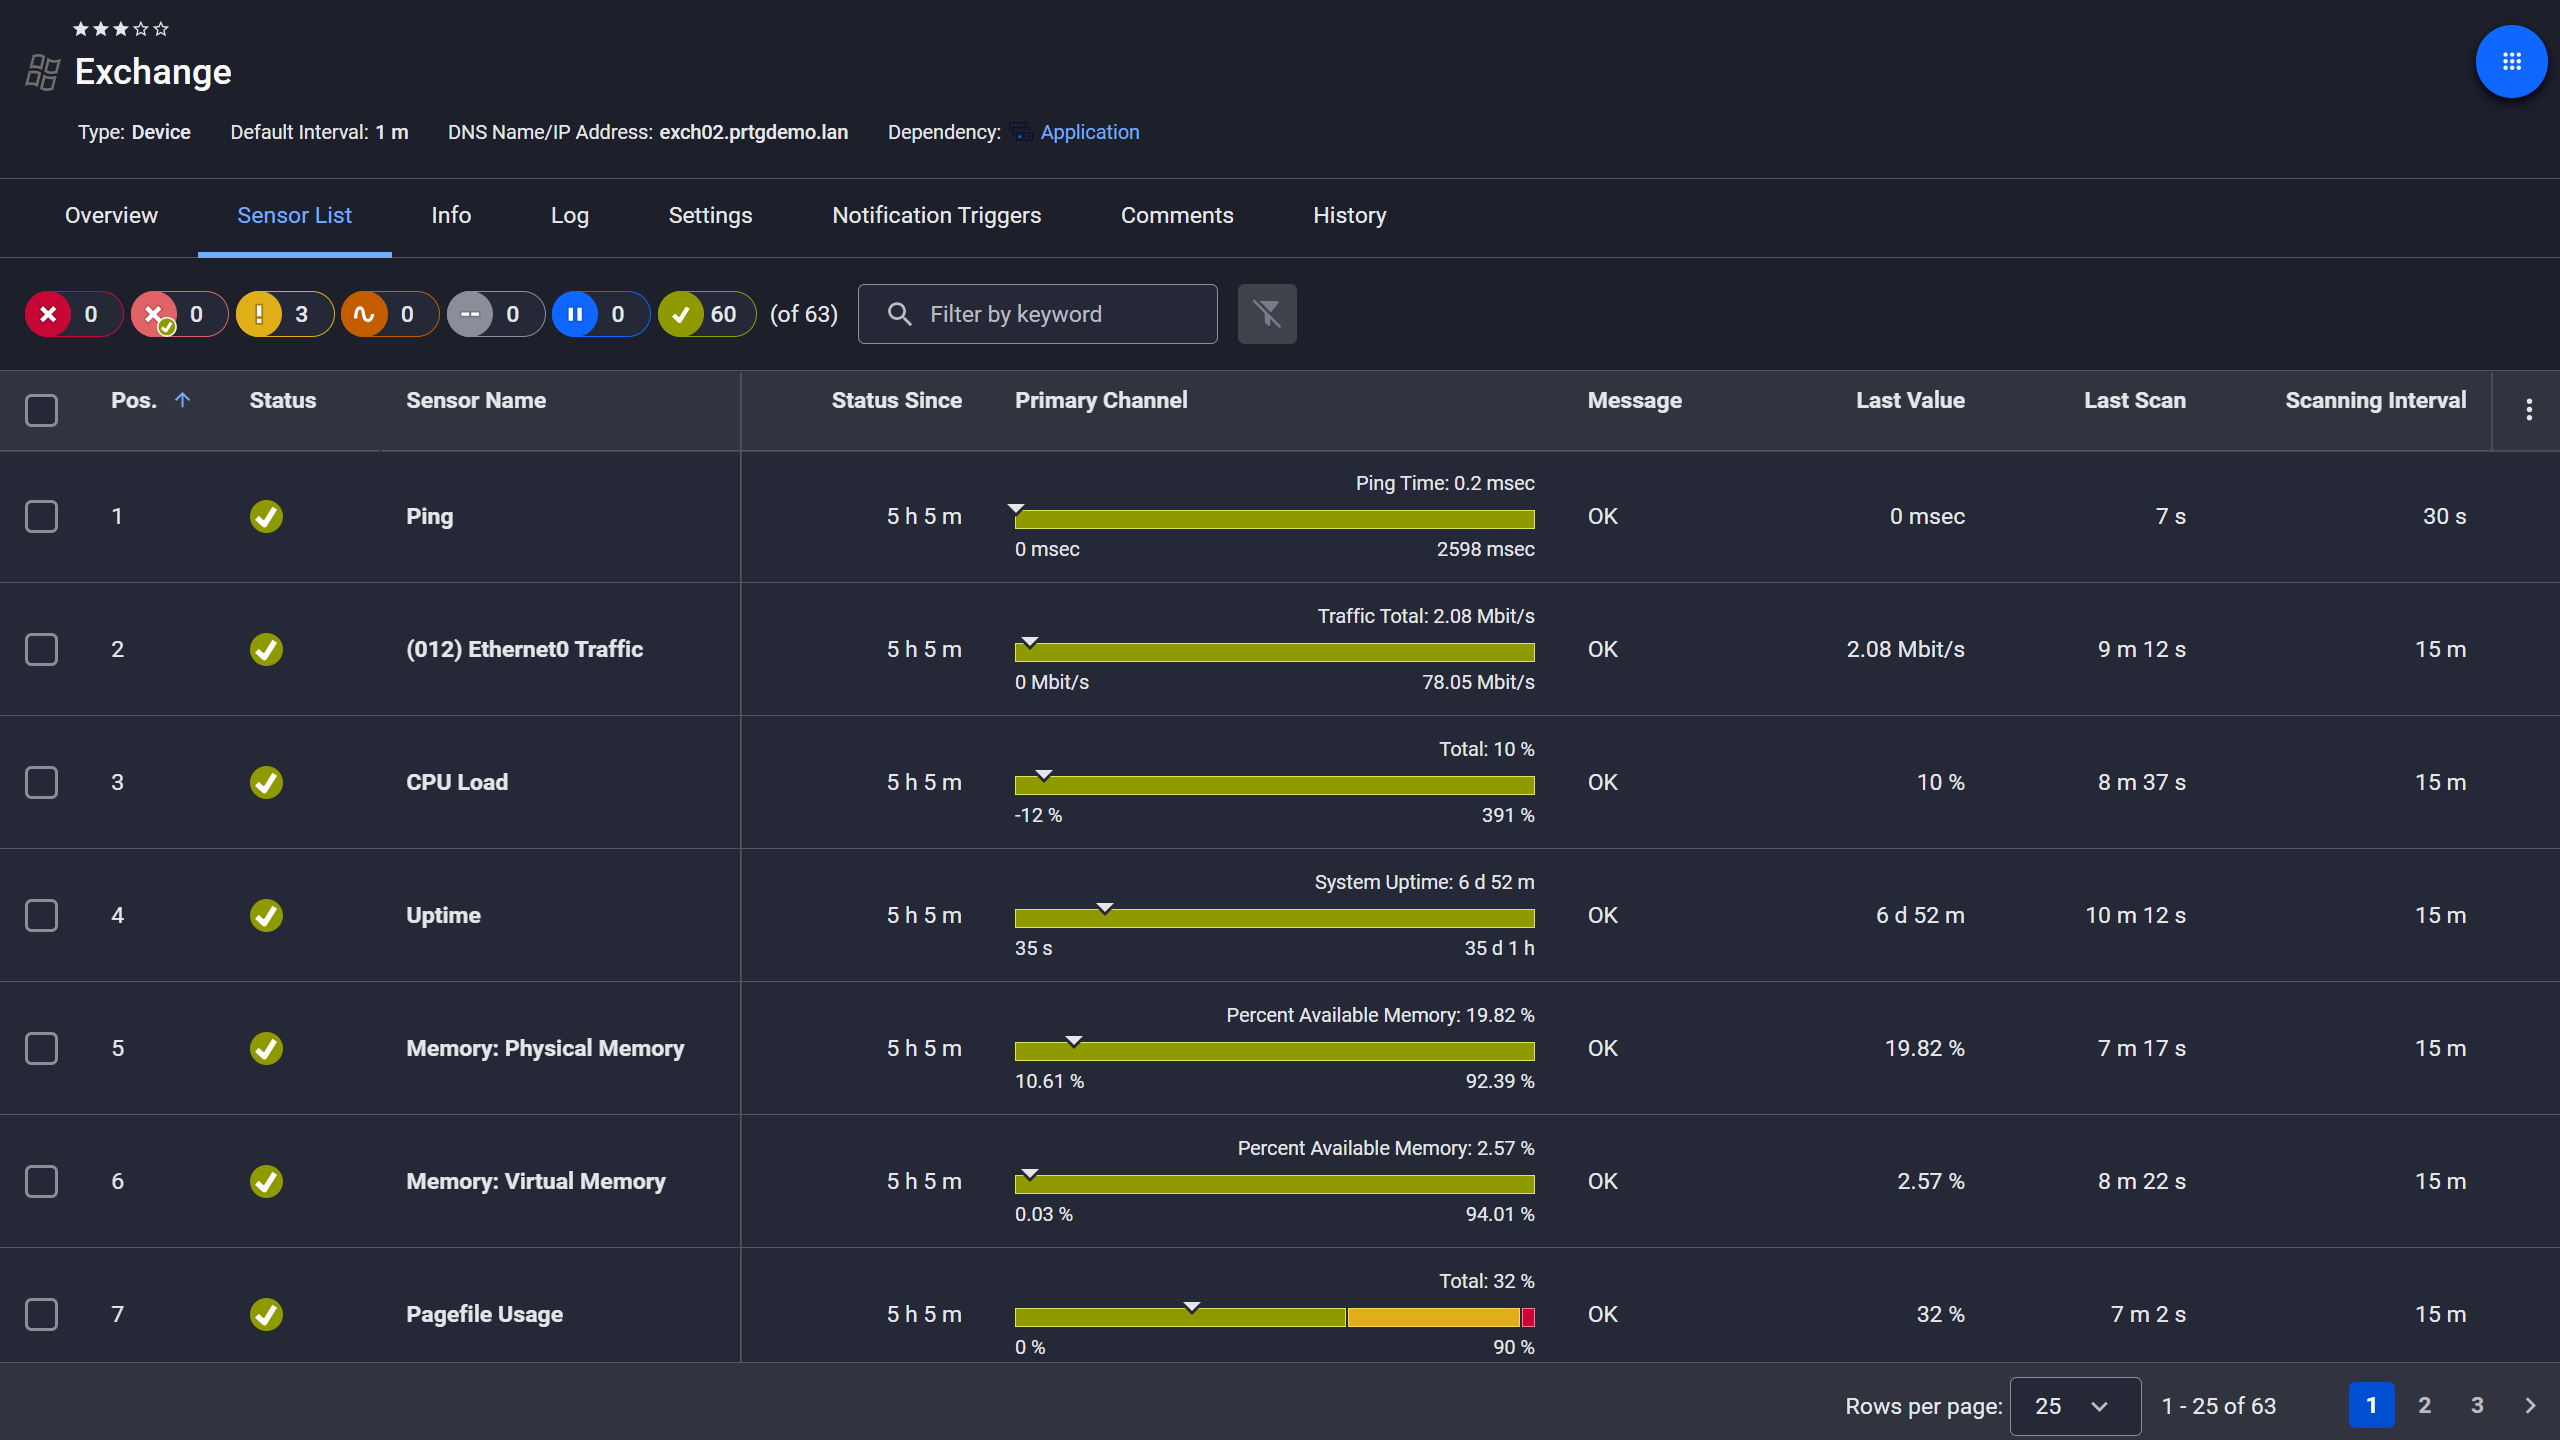
Exchange server, fully under control

Live graphs, real-time performance data
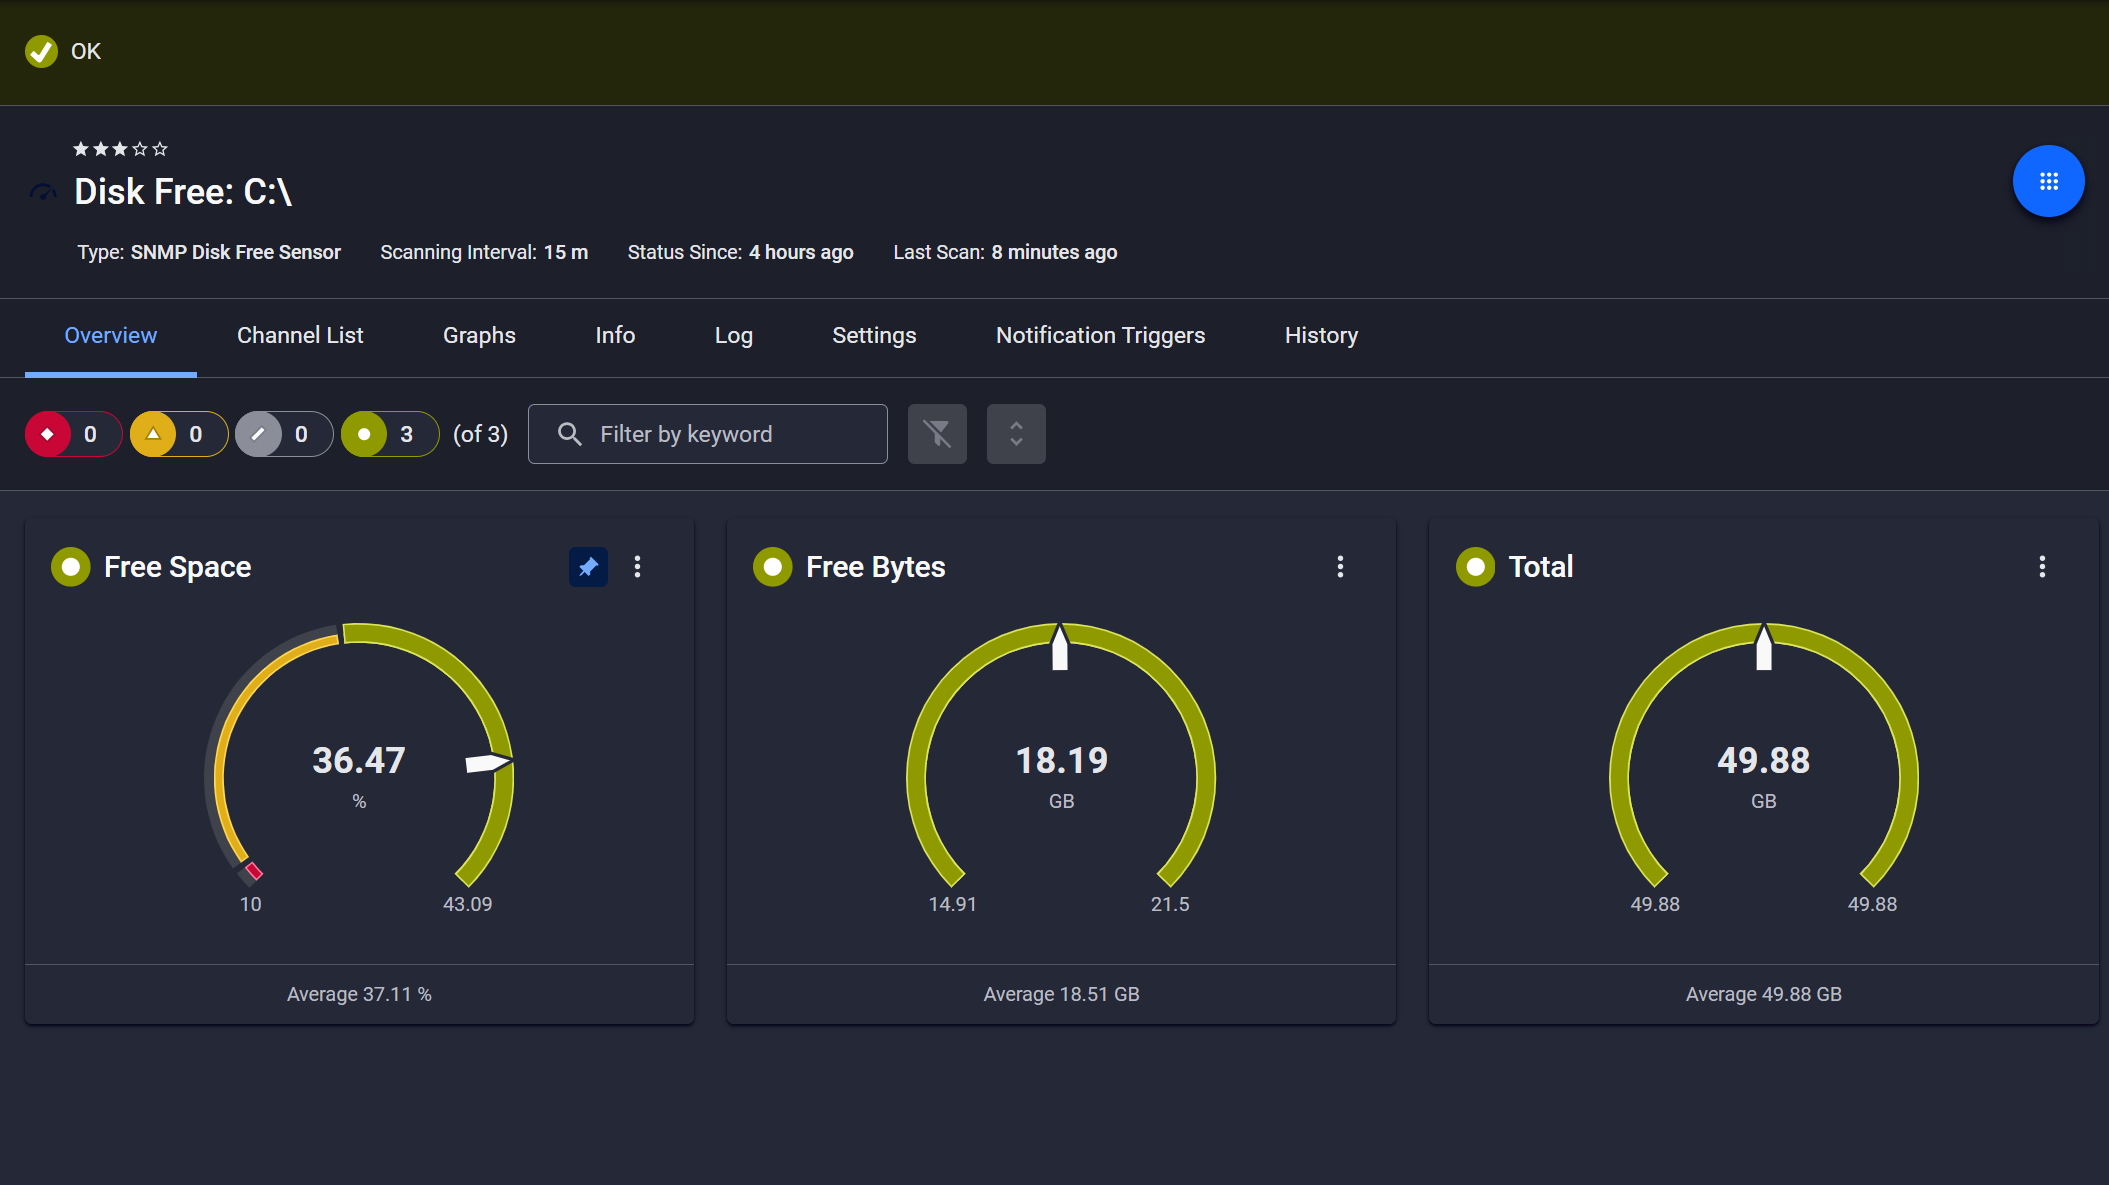
Disk space monitored, alerts ready
Connection failures cause complete application outages. By the time users report it, you're already behind. PRTG runs health-check queries at intervals you define, watching for connection timeouts, authentication failures, and service unavailability. When a database instance becomes unreachable, you get immediate notifications so issue resolution starts before downtime escalates.
Start monitoring your infrastructure in minutes. No professional services, no complex configuration, no risk.
Resource exhaustion causes performance degradation and unexpected outages, and tracking CPU, memory, and I/O across different database platforms is not simple. PRTG pulls resource metrics for both on-premises databases and cloud instances through native protocols and APIs. Set thresholds on CPU load, memory consumption, and disk I/O, and you get alerted before resources become constrained. That gives you time to plan for scalability before it becomes an actual problem.This is a bullet point

Scheduled reports, always on time
Tickets keep your team aligned

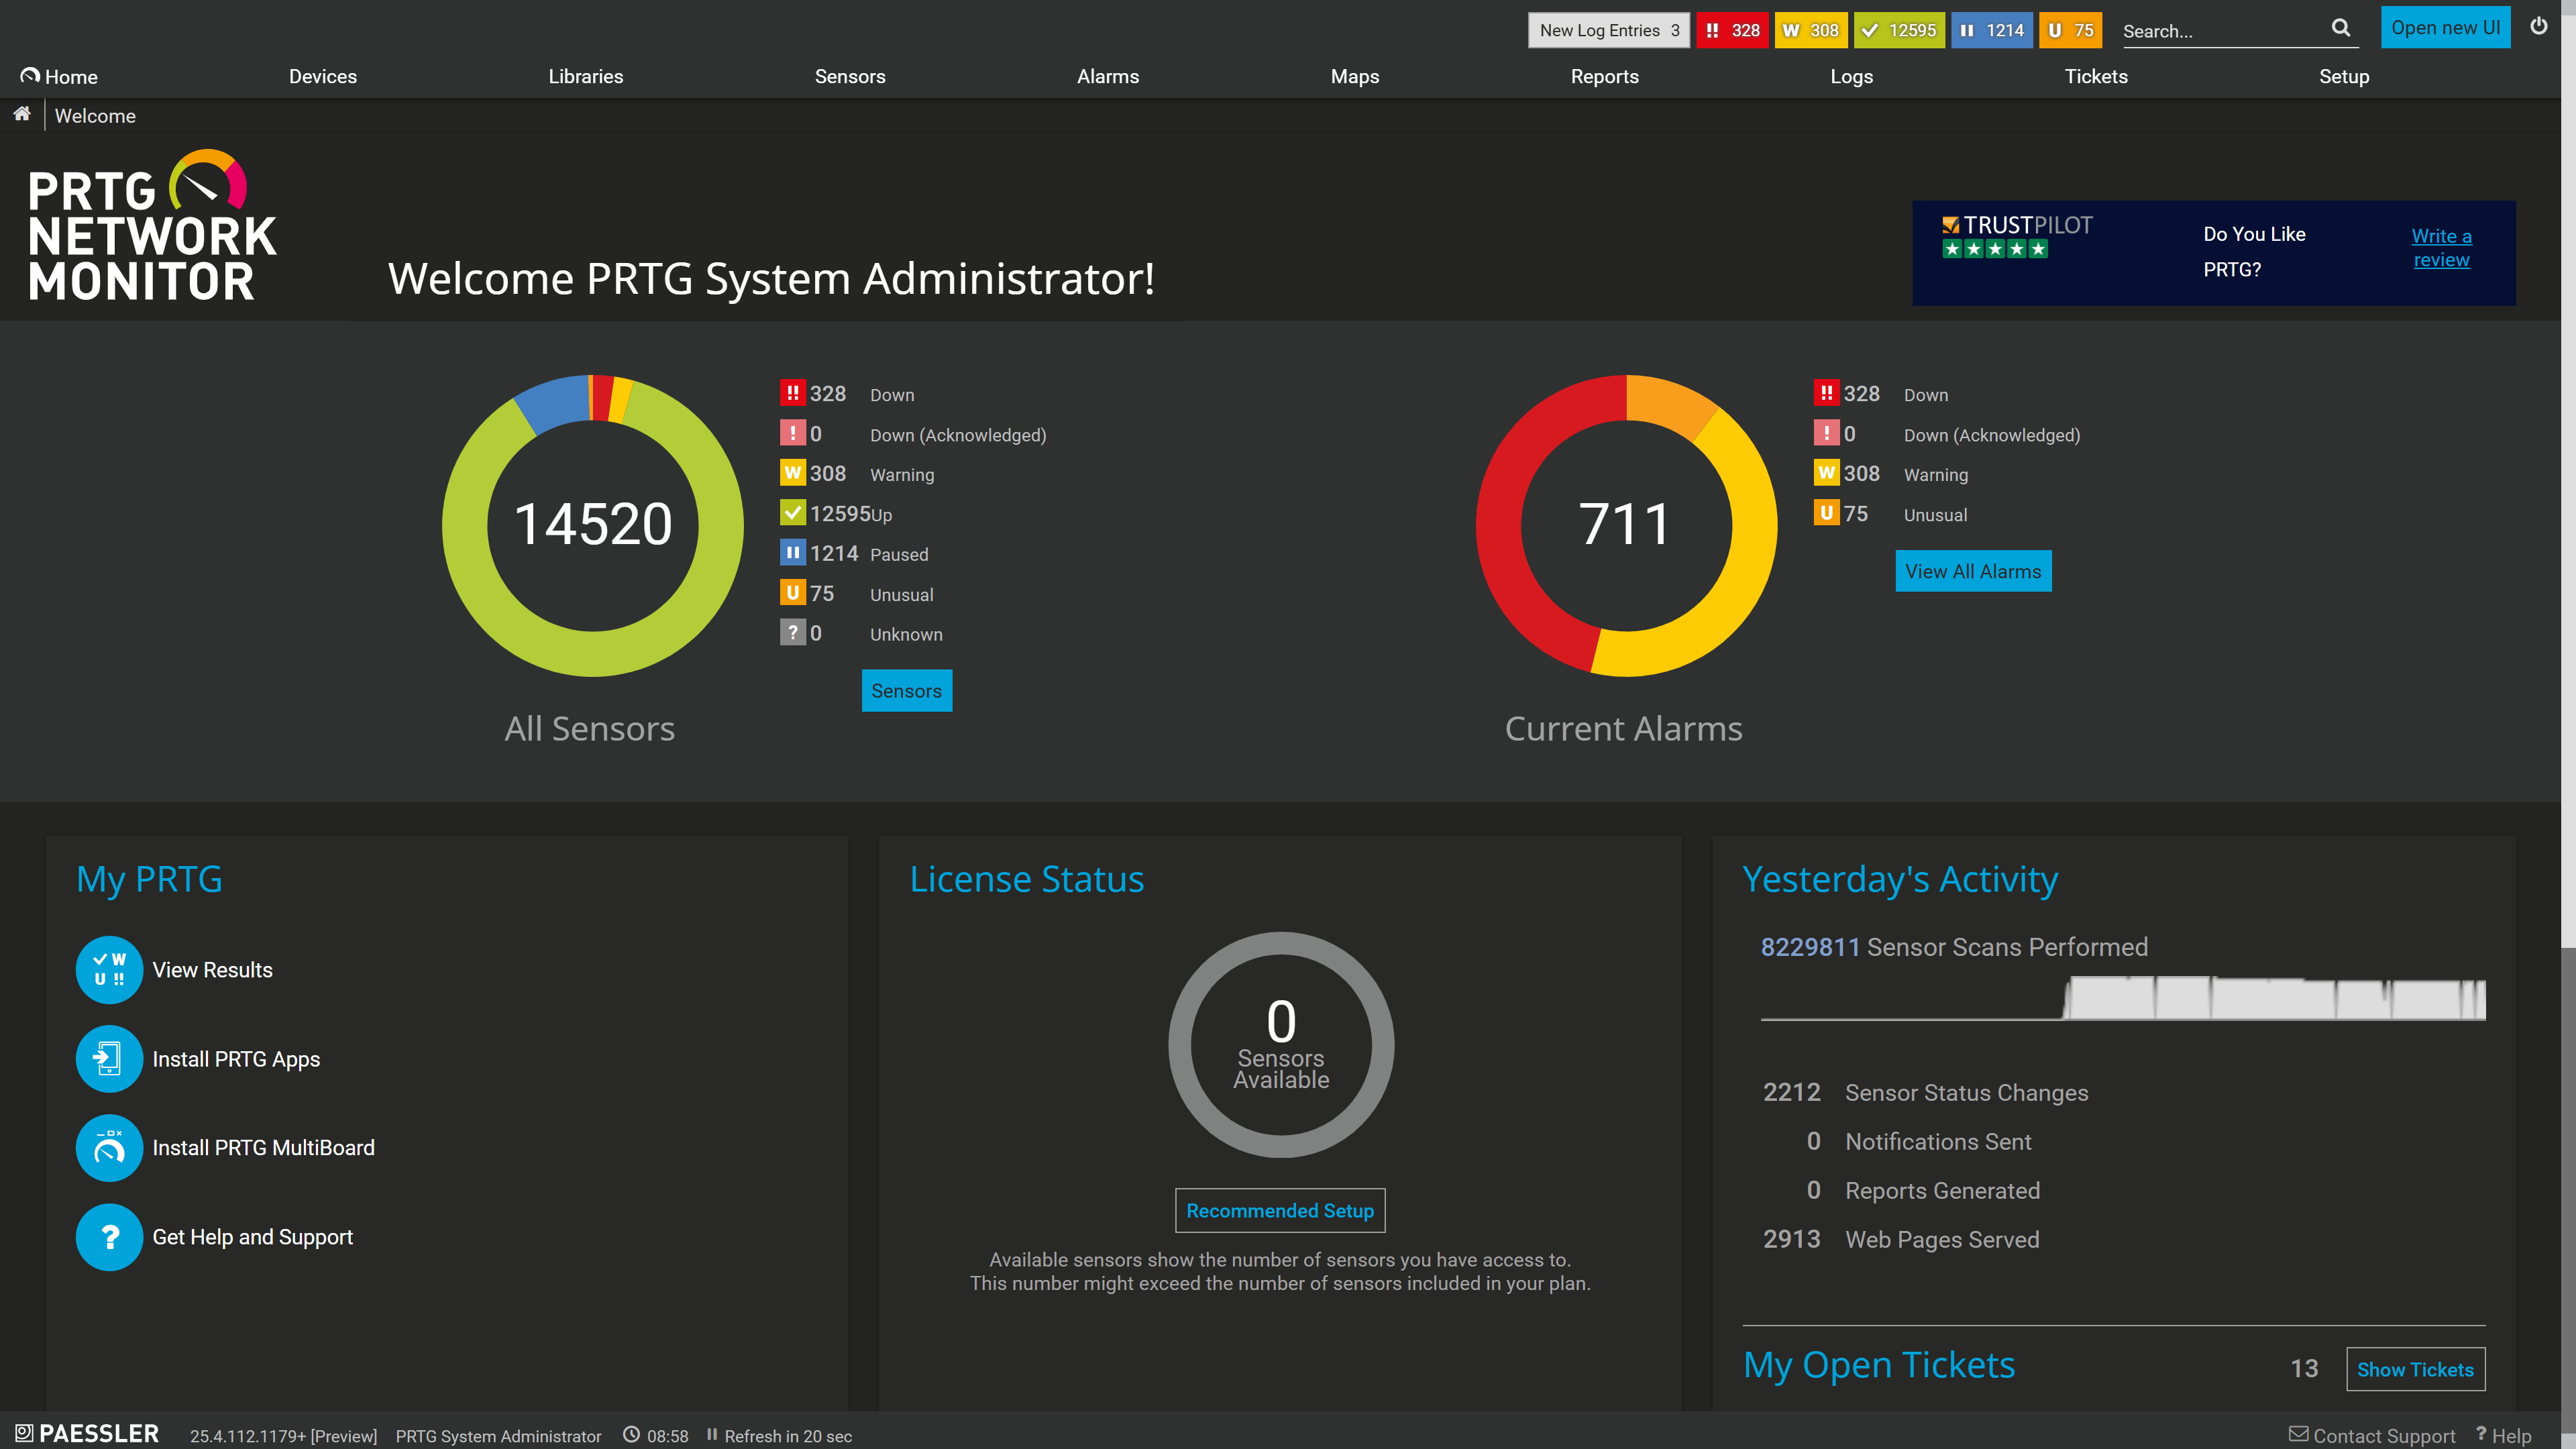
Full device list, instant overview
Database errors and failed transactions often hide in application logs. That makes troubleshooting slow, and finding the actual root cause even slower. PRTG runs validation queries against error tables or other quarriable structures exposed by the database and surfaces issues in near real-time. The access depends on the database making this information available through SQL queries. So when you correlate database performance data with infrastructure metrics, you can tell fast whether the problem comes from database configuration, query inefficiency, or system resource constraints.
To easily start database monitoring with PRTG you use preconfigured monitoring sensors that collect specific data types from your infrastructure. Database sensors connect through native protocols, ODBC/ADO interfaces, and cloud APIs to give you database observability across performance, availability, and resource metrics.
Task | Without PRTG Without PRTG | With PRTG With PRTG |
|---|---|---|
Query Performance Tracking | Without PRTG Run queries manually, check execution plans, log timestamps | With PRTG Automated query execution with millisecond-level execution time tracking |
Multi-Database Visibility | Without PRTG Log into each database platform separately, compare metrics manually | With PRTG Single dashboard for SQL Server, MySQL, PostgreSQL, Oracle, and cloud databases |
Error Detection | Without PRTG Check error logs periodically, search for failed transactions | With PRTG Automated validation queries with threshold-based alerts on error conditions |
Resource Monitoring | Without PRTG Check task manager, database-specific tools, cloud consoles | With PRTG Unified resource metrics across on-premises and cloud with historical trend data |
Alert Configuration | Without PRTG Set up database-specific alerts per platform, manage multiple notification systems | With PRTG Centralized threshold configuration with multi-channel notifications: email, SMS, syslog, webhook |
Choose the PRTG Network Monitor subscription that's best for you.
| License Name | License description | Price | License Details | Get started | Pricing Details | |
|---|---|---|---|---|---|---|
| PRTG 500 | $200 | per month paid annually | Buy nowBuy now | Enough to monitor multiple aspects of 50 devices | ||
| PRTG 1000 | $358 | per month paid annually | Buy nowBuy now | Enough to monitor multiple aspects of 100 devices | ||
| PRTG 2500 | $742 | per month paid annually | Buy nowBuy now | Enough to monitor multiple aspects of 250 devices | ||
| PRTG 5000 | $1,300 | per month paid annually | Buy nowBuy now | Enough to monitor multiple aspects of 500 devices | ||
| PRTG 10000 | $1,642 | per month paid annually | Buy nowBuy now | Enough to monitor multiple aspects of 1000 devices |

PRTG monitors Microsoft SQL Server, MySQL, PostgreSQL, and Oracle through native sensors. Any database that supports ODBC or ADO connections works with the ADO SQL sensor. For cloud environments, PRTG includes dedicated sensors for Azure SQL Database and AWS RDS instances covering MySQL, PostgreSQL, MariaDB, Oracle, and SQL Server.
Yes. You store custom SQL queries as script files, define the execution interval, and configure which values from the result set become monitoring channels. This gives database administrators the flexibility to monitor application-specific metrics, validate business logic, check error conditions, or test transaction processing, without writing a custom integration.
Threshold-based alerting. You set upper or lower limits on any metric: query execution time, connection counts, CPU usage, error counts, or custom values your queries return. When a threshold is exceeded PRTG sends notifications through whatever channels you've configured: email, SMS, syslog, push notifications, webhook.
The short answer: No. For on-premises databases, PRTG connects using native protocols: TDS for SQL Server, MySQL protocol, PostgreSQL protocol, Oracle TNS, or ODBC/ADO. Cloud databases go through their provider APIs, Azure Monitor and AWS CloudWatch. You do need database credentials for authentication.
Yes, through custom SQL queries that check backup history tables or file timestamps. Write a query that returns backup status or completion time, configure alert thresholds if backups are missing or outdated. Worth noting: this requires query-level configuration to account for how your specific database tracks backup status. Not a one-click setup, but straightforward once you know your backup tables.
You set the scanning interval per sensor. Five minutes is the recommended default for production database monitoring. That interval balances detection speed against performance impact on the monitored instance. Critical instances can run more frequent checks, development databases less frequent ones to reduce load. DevOps teams and database administrators each get the granularity they need without a global compromise.
Network Monitoring Software – Version 26.1.116.1532 (February 9th, 2026)
Download for Windows and cloud-based version PRTG Hosted Monitor available
English, German, Spanish, French, Portuguese, Dutch, Russian, Japanese, and Simplified Chinese
Network devices, bandwidth, servers, applications, virtual environments, remote systems, IoT, and more
Choose the PRTG Network Monitor subscription that's best for you


