• Company
    • About Us
    • Case Studies
    • Press Center
    • Careers
    • Blog
    • Contact us
  • Contact us
  • Login
 
  • English
    • Deutsch
    • Español
    • Français
    • Italiano
    • Português
Paessler
                    - The Monitoring Experts
  • Products
    • Paessler PRTG
      Paessler PRTGMonitor your whole IT infrastructure
      • PRTG Network Monitor
      • PRTG Enterprise Monitor
      • PRTG Hosted Monitor
      • PRTG UVexplorer
      • PRTG extensionsExtensions for Paessler PRTGExtend your monitoring to a new level
    • Icon Features
      FeaturesExplore all monitoring features
      • Maps & dashboards
      • Alerts & notifications
      • Multiple user interfaces
      • Distributed monitoring
      • Customizable reporting
  • Solutions
    • Industries
      IndustriesMonitor various industry sectors
      • Industrial
      • Healthcare
      • Data Center
      • Education
      • Finance
      • Government
    • IT Topics
      IT TopicsMonitor all areas of IT
      • Network Monitoring
      • Bandwidth Monitoring
      • SNMP Monitor
      • Network Mapping
      • WiFi Monitoring
      • Server Monitoring
  • Pricing
  • Resources
    • Getting Started
      Getting StartedModules for self-paced learning
    • How-to Guides
      How-to GuidesGet the most out of PRTG
    • Videos & Webinars
      Videos & WebinarsLearn from Paessler experts
    • IT  Knowledge
      IT KnowledgeExpand your IT knowledge
    • PRTG Manual
      PRTG ManualFull documentation
    • Knowledge Base
      Knowledge BaseShare community knowledge
    • PRTG Sensor Hub
      PRTG Sensor HubGet sensors, scripts & templates
    • Trainings
      PRTG TrainingLearn how to work with PRTG
  • Partners
    • Icon Handshake
      Become a PartnerFor resellers and channel partners
    • Icon MSP
      Become an MSPDeliver monitoring as a managed service
    • icon partner
      Partner PortalLog in to your partner account
    • Deal Registration
      Deal RegistrationRegister your sales opportunities
    • icon search
      Find a PartnerFind partners selling Paessler products
    • icon technology
      Technology AlliancesSee Paessler technology partnerships
    • Partner HubTools for Your Success
  • Company
    • About Us
    • Case Studies
    • Press Center
    • Careers
    • Blog
    • Contact us
  • Contact us
  • Login
  • English
    • Deutsch
    • Español
    • Français
    • Italiano
    • Português
  • Get a quote
  • Free trial

Powerful SQL Server Monitoring Tool 

Get real-time visibility into SQL Server performance and catch issues before they impact your operations 

Free download
PRODUCT OVERVIEW

How do you monitor SQL Server performance across on-premises and cloud instances without switching tools?

SQL Server monitoring spans several different data layers: query execution times, connection health, buffer cache performance, transaction log growth, and underlying server resources. Most teams end up covering these with a mix of SSMS, Performance Monitor, and cloud console views depending on where their instances run. That works until you need to correlate across them, which is exactly when it gets slow.

PRTG covers SQL Server through two main sensor approaches: SQL v2 sensors that execute queries directly against the database and return execution times or custom result values, and WMI sensors that pull server-level performance counter data from Windows without touching the database itself. Azure SQL Database has a dedicated sensor connecting via the Azure management API. Hybrid environments with instances split across on-premises and cloud work without separate configuration. Supported databases: Microsoft SQL Server, MySQL, PostgreSQL, Oracle, Azure SQL Database, and any database accessible via ODBC or OLE DB.

Download PRTG Trial

What you will find on this page

  • SQL Server Performance
  • How PRTG Monitors SQL
  • Manual SQL Monitoring vs. PRTG
  • FAQs

PRTG is compatible with all major vendors, products, and systems

compatible with all major vendors, products, and systems

SQL Server Performance and Availability, Fully in View

SQL Server Performance Metrics in One Unified View

SQL Server performance data tends to live in too many places at once. Query execution times in SSMS, CPU and memory in Task Manager, connection states in application logs. Matching those up when something degrades takes time, and the actual bottleneck stays unclear until you've already spent too long looking. PRTG consolidates SQL Server database metrics into a single view. Query execution times, CPU and memory utilization, active connections, and I/O wait times all sit together. When performance drops you see exactly which component is struggling, without switching between tools or manually matching timestamps across separate systems.

  • Monitor query execution time and row counts returned by custom SQL statements
  • Track CPU utilization, memory consumption, and disk I/O across all SQL Server instances
  • Active session and failed connection data show you where connection bottlenecks actually form
  • Correlate database metrics with underlying server performance, whether the host runs Windows or Linux
  • Set thresholds on critical metrics and get notified before users notice anything is wrong
PRTG device view showing sensor list for a monitored Microsoft Exchange server

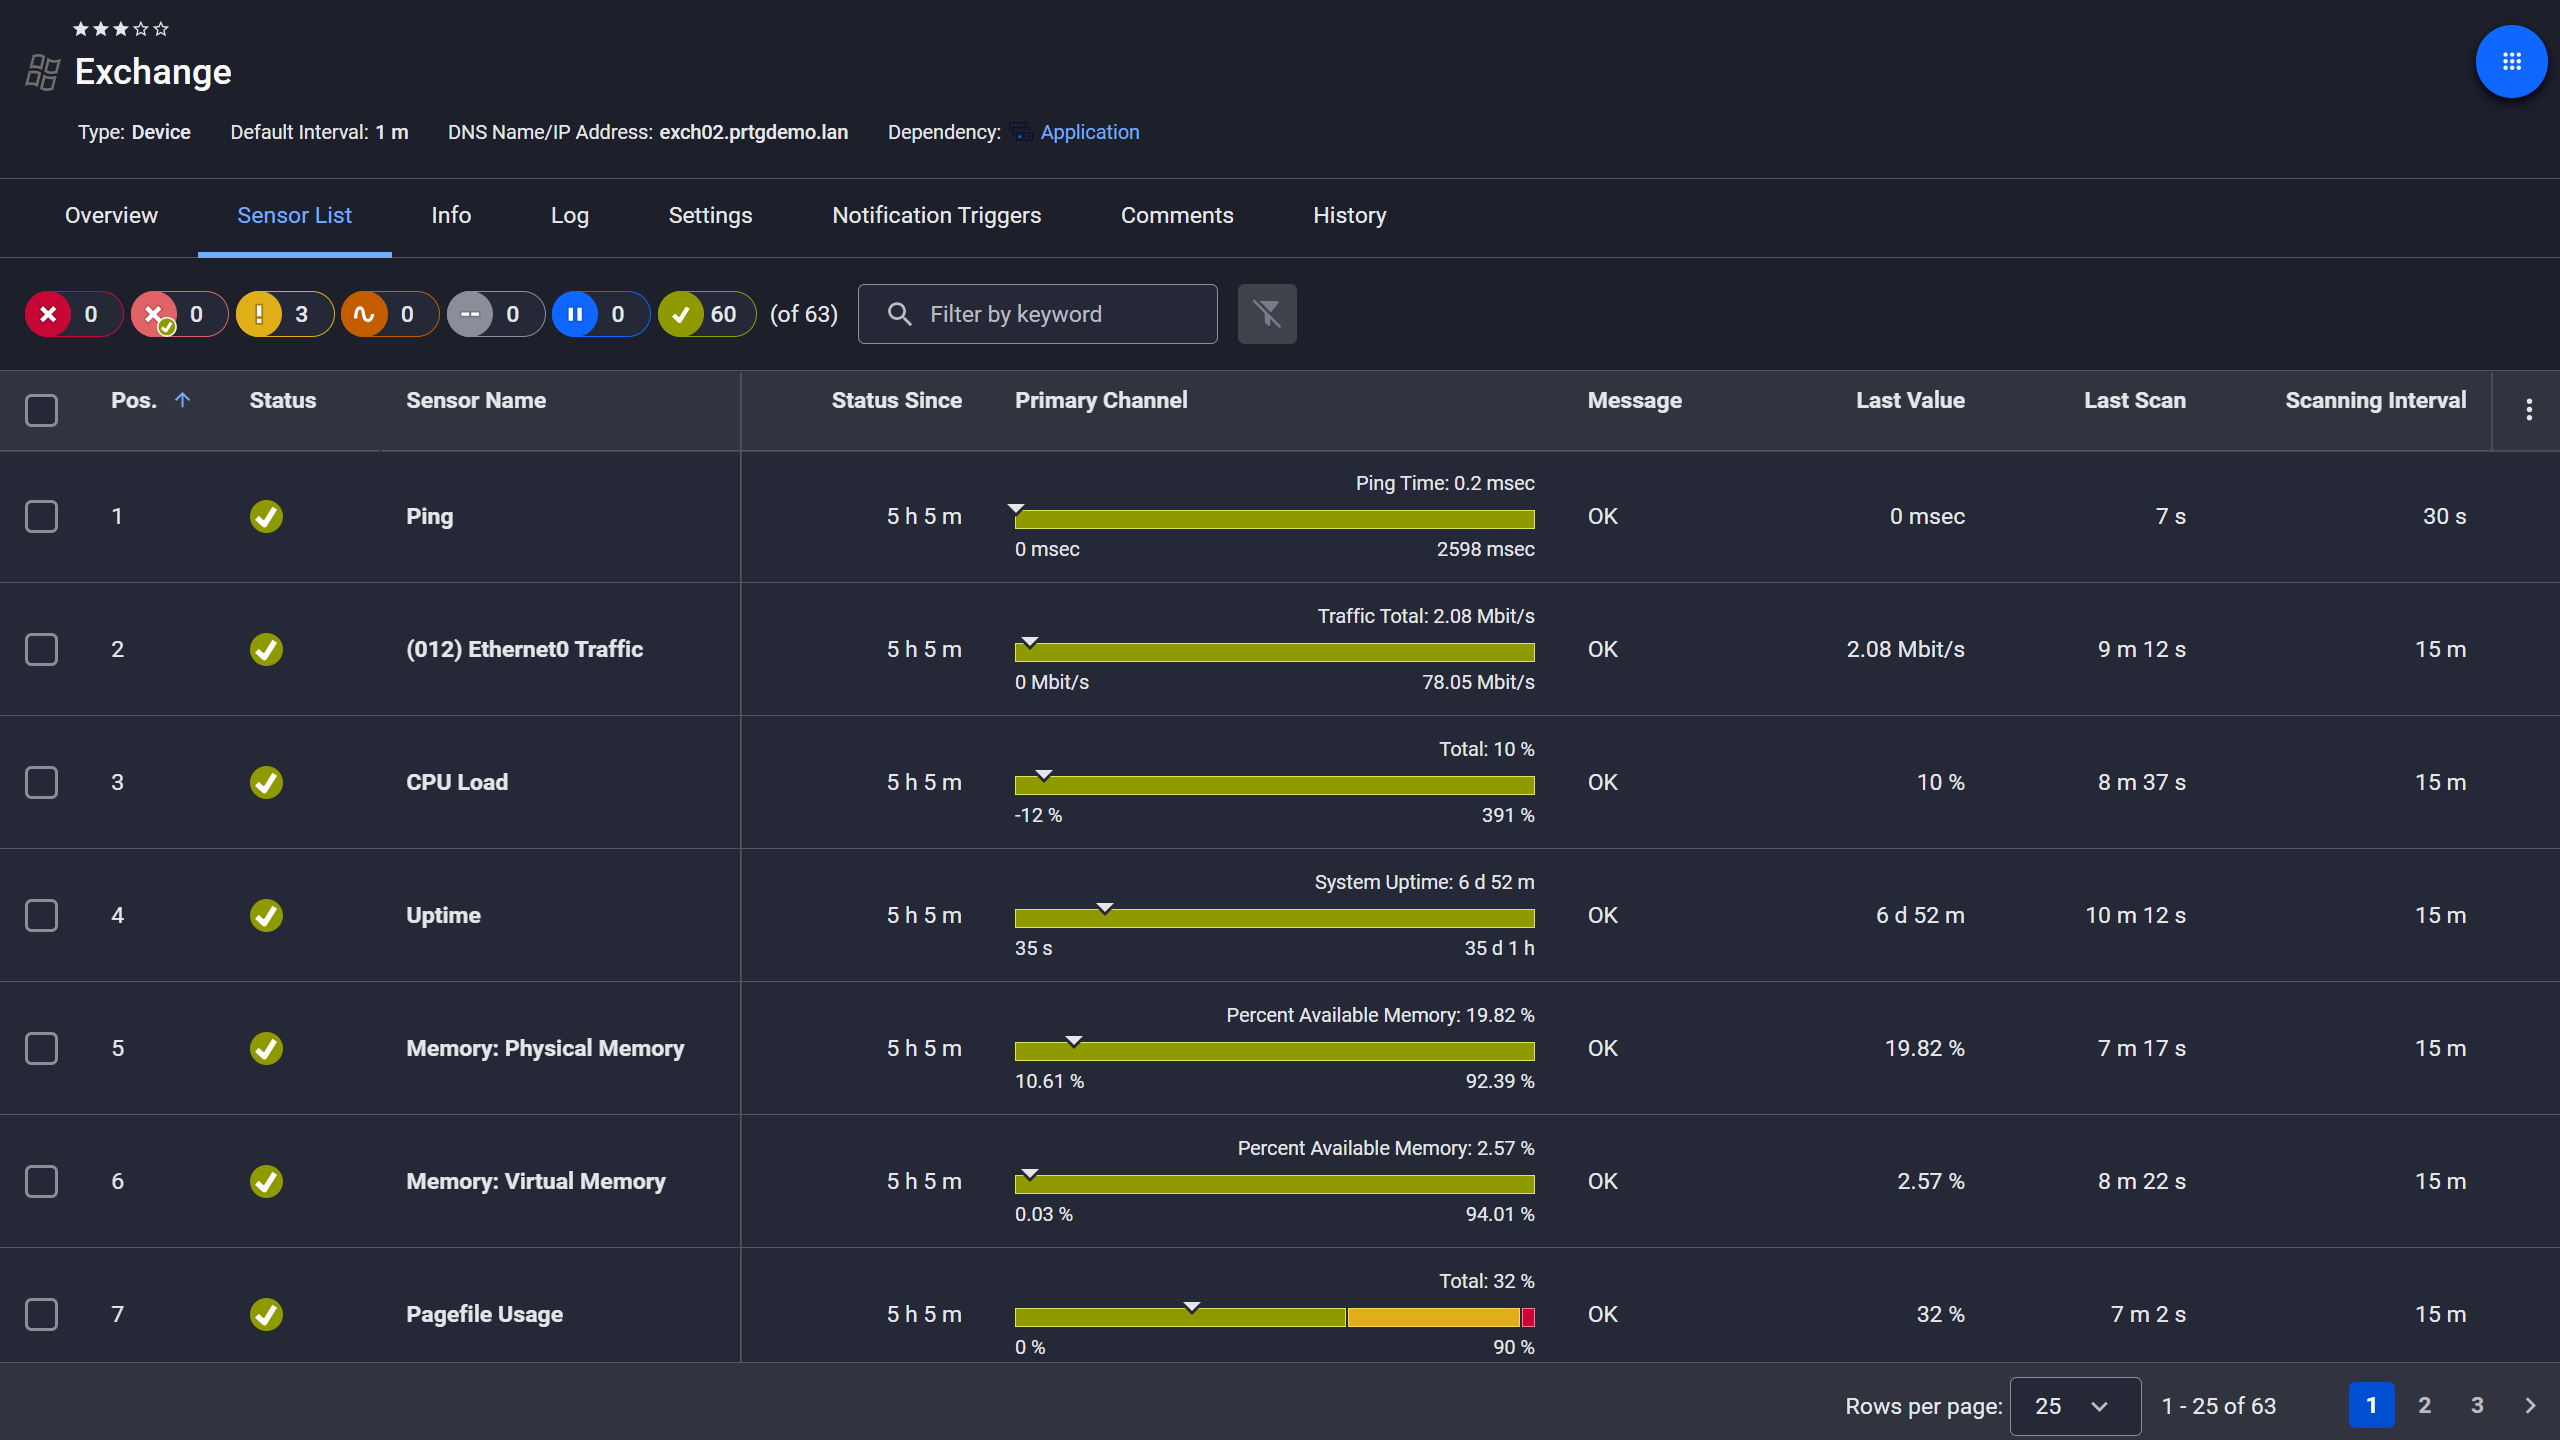
Exchange server, fully under control

PRTG SNMP Disk Free sensor showing free space, free bytes, and total disk capacity gauges

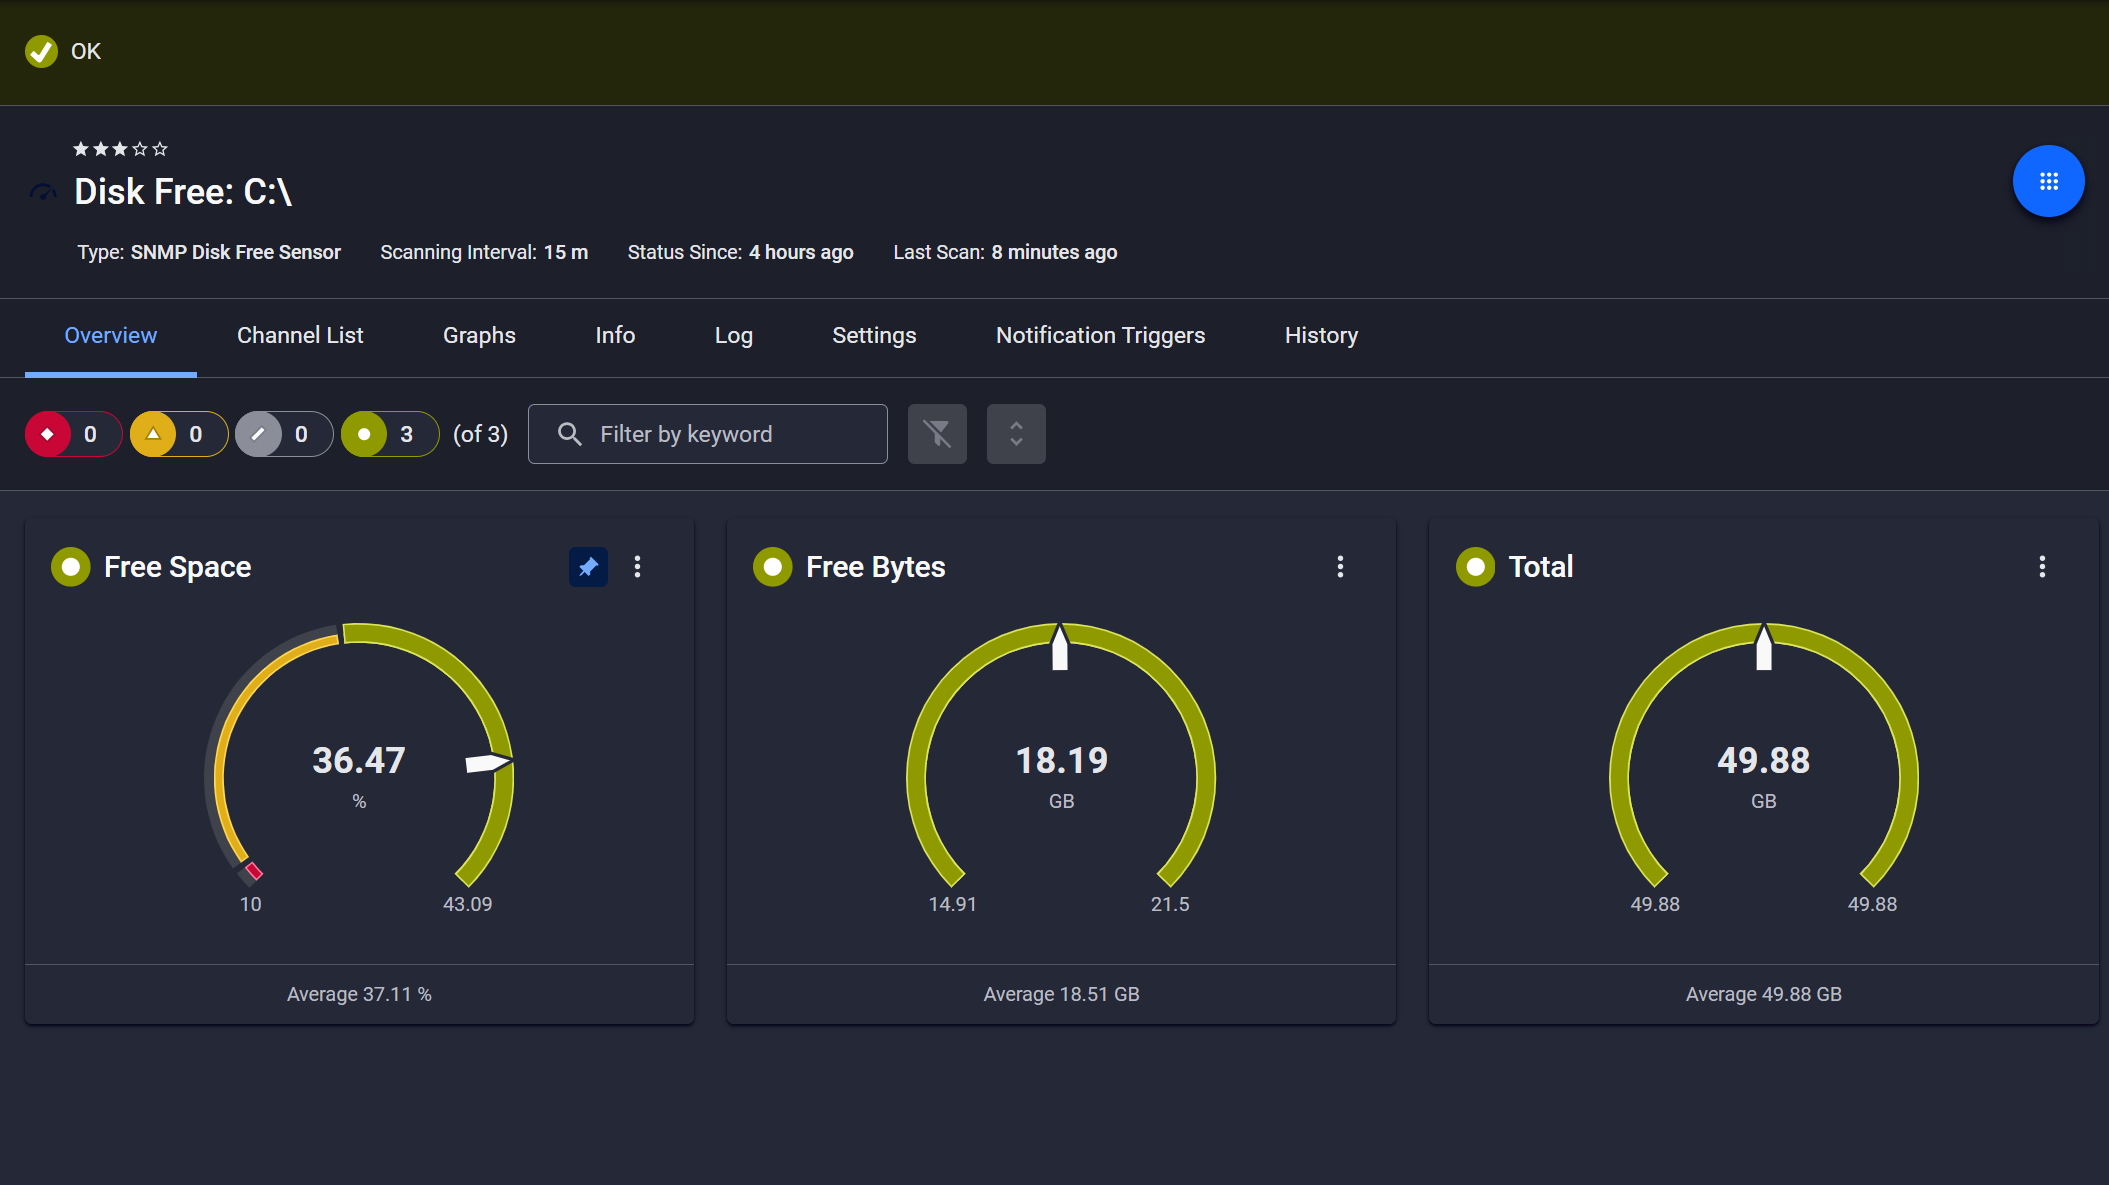
Disk space monitored, alerts ready

PRTG web interface showing live performance graphs for a Probe Health sensor

Live graphs, real-time performance data

Resource Utilization Trends Before They Become Critical

SQL Server environments accumulate load gradually. Database files grow, memory fills up, disk space on log volumes tightens. Tracking those trends manually across multiple instances means periodic spot checks, and spot checks miss what happens between them. PRTG tracks resource utilization trends in real time. You get visibility into database file sizes, transaction log growth, memory buffer usage, and disk space on volumes hosting your SQL instances, before they become a problem. When metrics approach critical levels, threshold alerts fire and give you time to optimize resources before services are affected.

  • Track database and transaction log file sizes with automatic threshold alerting
  • Monitor SQL Server memory buffer pool and cache hit ratios
  • Watch disk space on volumes hosting database files and backups
  • Get alerts when resource consumption approaches your defined limits
  • Performance data shows consumption patterns to help you plan capacity

See Why IT Professionals Trust PRTG

Start monitoring your infrastructure in minutes. No professional services, no complex configuration, no risk.

Free download
PRODUCT OVERVIEW

Simplify Multi-Instance and Multi-Database Monitoring 

Managing multiple SQL Server instances across development, staging, and production means juggling credentials, connection strings, and separate monitoring configurations. Mixed platforms like MSSQL, MySQL, and PostgreSQL make it worse. You need visibility across all of them without rebuilding your monitoring setup from scratch each time.

PRTG uses a unified sensor approach across all SQL database types. Microsoft SQL v2 sensors handle SQL Server, MySQL v2 sensors cover MySQL, and ADO SQL v2 sensors connect to any ODBC or OLE DB data source. Configure once, deploy across your environment. Also credentials are managed at the device level, so per-sensor configuration repetition is not something you deal with here.

  • Monitor Microsoft SQL Server, MySQL, PostgreSQL, and Oracle with platform-specific sensors
  • Use ADO SQL v2 sensor for any database accessible via ODBC or OLE DB
  • Track Azure SQL Database metrics (DTU consumption, eDTU usage, storage, failed connections) natively
  • Manage credentials centrally at the device level without repetitive configuration per sensor
  • Single dashboard view consolidates metrics across all database platforms
PRTG reports list showing scheduled monitoring reports with run times and sensor counts

Scheduled reports, always on time

PRTG tickets list showing system notifications, report completions, and update alerts

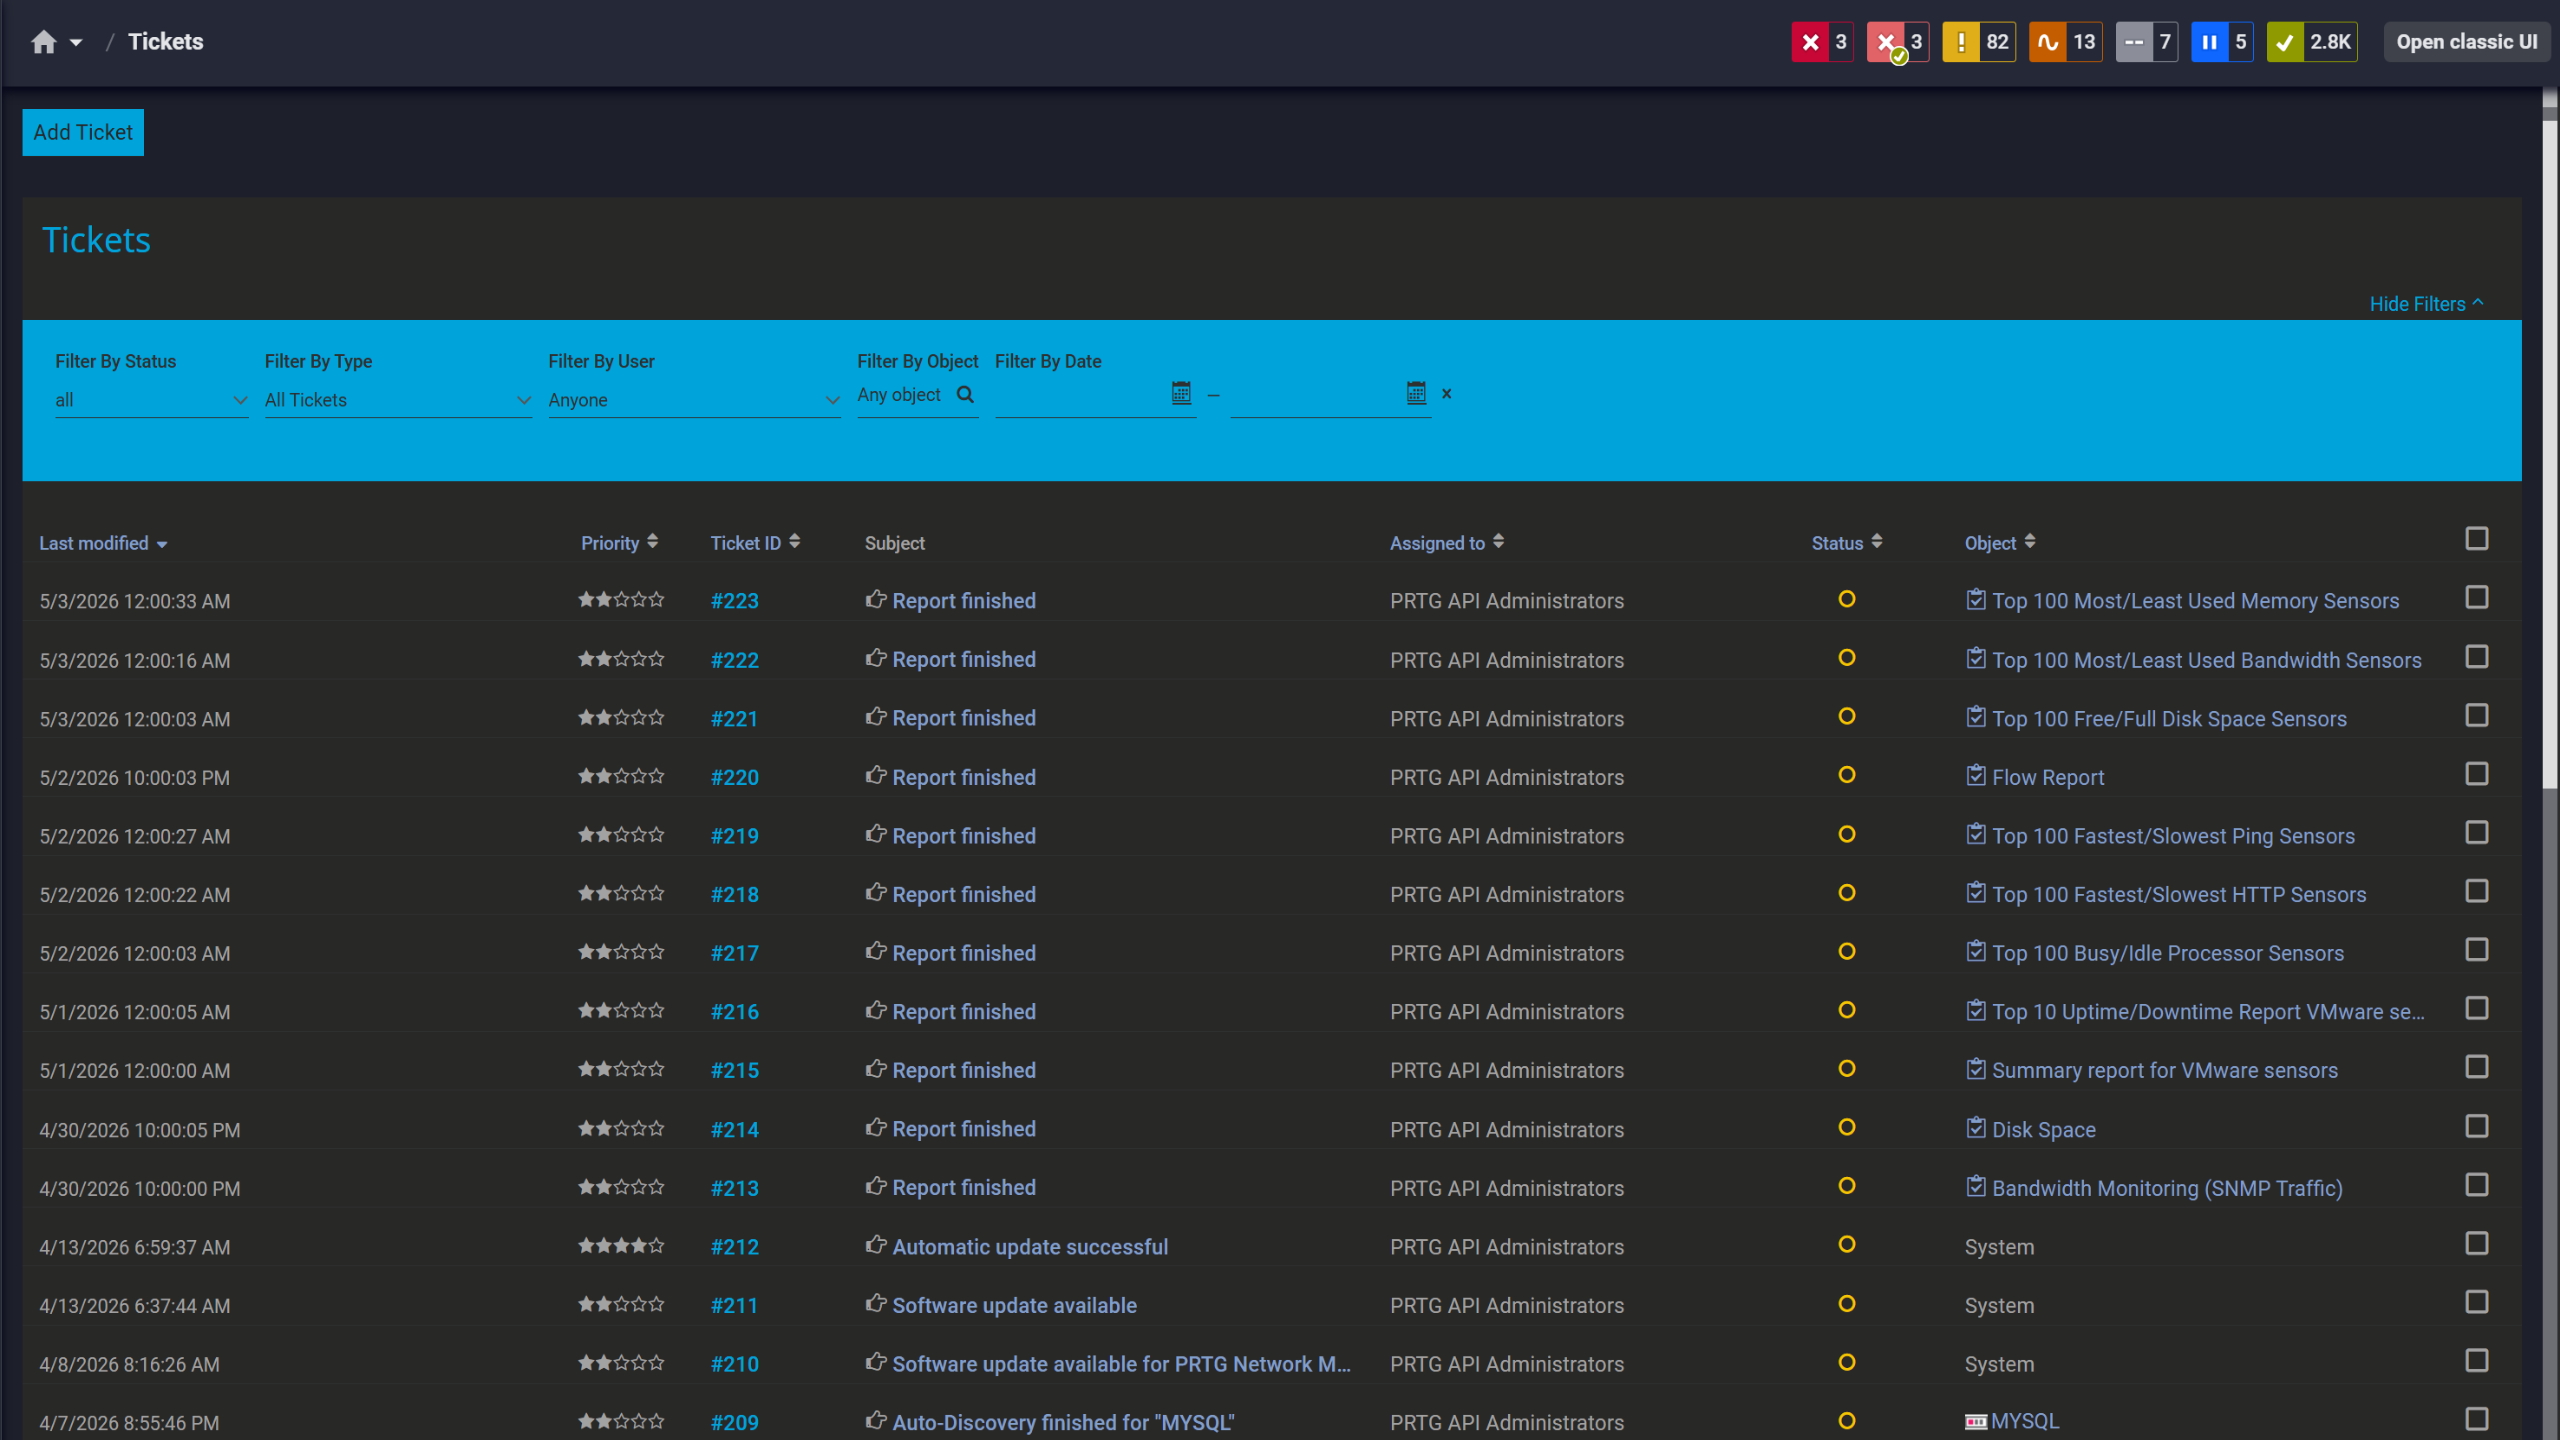
Tickets keep your team aligned

PRTG web interface showing device tree and full device list with sensor status badges

Full device list, instant overview

Application-Level Database Visibility Beyond System Metrics

Application teams report "the database is slow" but system-level metrics look fine. CPU is normal. Memory is fine. The actual problem is specific queries taking too long, deadlocks blocking transactions, or availability group failovers causing brief outages. Infrastructure monitoring alone won't surface these things.

PRTG executes custom SQL statements and monitors the results. Run queries that check for blocking sessions, deadlock counts, replication lag, or slow-running stored procedures. PRTG then processes return values into individual monitoring channels, so you're not reading raw query output to find what's wrong. When application-level problems occur they show up in PRTG alongside your infrastructure metrics.

  • Execute custom SQL statements and monitor execution time and results
  • Process query return values into individual monitoring channels
  • Check for long-running queries, blocking sessions, and deadlock occurrences
  • Monitor SQL Server availability groups, replication status, and failover events (via custom queries)
  • Combine database-specific metrics with infrastructure data for complete visibility

How PRTG Monitors SQL Servers  

PRTG collects SQL Server performance monitoring data through several different methods, and which one applies depends on what you're monitoring. SQL v2 sensors execute queries directly against the database. WMI sensors pull performance counter data from the Windows operating system. Azure SQL Database sensors connect via Azure API for cloud databases. Here's how each approach works.

SQL v2 Sensors

Paessler’s Microsoft SQL v2, MySQL v2, PostgreSQL, and Oracle SQL v2 sensors connect directly to databases using their native protocols. You provide a SQL query file stored on the probe system under \Custom Sensors\sql\ and the sensor runs it at each monitoring interval. PRTG measures total request time across the full cycle: connection, query execution, transaction handling, and disconnection. Query-specific execution time gets tracked separately.

Also the sensor processes the data table your query returns. You define individual channels for specific return values, which means one sensor can cover both query performance metrics and application-specific database checks at the same time. That's a lot of flexibility without requiring separate sensors for each check.

WMI Performance Counters

PRTG provides WMI-based SQL Server sensors for specific versions: 2008, 2012, 2014, 2016, 2017, and 2019. Each version has a dedicated sensor tailored to that SQL Server release's performance counters. They query Windows performance counters via WMI to collect system-level database metrics without executing any database queries directly. Useful when you need SQL Server health data but don't want to run queries against the database itself.

By default, these sensors use WMI to query performance counter data. You can optionally enable a hybrid mode in the device's Windows Compatibility Options where PRTG tries performance counters directly first, then falls back to WMI if direct counters aren't available. Worth knowing before you assume the default is always what you're getting.

Azure SQL Monitoring

The dedicated Microsoft Azure SQL Database sensor connects to Azure subscriptions and monitors single databases or elastic pools. It pulls metrics from Azure's management API: data usage, CPU percentage, DTU and eDTU consumption, session counts, failed connections, and I/O operations. No database queries required, no connection strings to manage inside the database itself.

This native Azure integration means cloud database visibility doesn't require a separate monitoring approach or additional credentials.

ADO SQL Sensor

With the ADO SQL v2 sensor you can monitor any database accessible via ActiveX Data Objects using ODBC or OLE DB drivers. That covers databases without dedicated PRTG sensors: SAP databases, IBM Db2, legacy systems, cloud databases with generic driver support. You provide the connection string and SQL query file. The sensor executes the query, measures performance and processes return values into monitoring channels.

It functions as the fallback option, but in mixed environments it often ends up doing more work than you'd expect.

free downLoad

Manual SQL Monitoring vs. PRTG

Feature

Without PRTG

Without PRTG

With PRTG

With PRTG

Query Performance Tracking

Without PRTG
not included

Run queries manually in SSMS; review execution plans one at a time

With PRTG
included

Automated query execution with real-time tracking of execution time and return values

Multi-Database Visibility

Without PRTG
not included

Switch between SSMS connections for each database platform

With PRTG
included

Unified dashboard for MSSQL, MySQL, PostgreSQL, Oracle, and Azure SQL

Resource Utilization Monitoring

Without PRTG
not included

Check Task Manager, Performance Monitor, and Windows logs separately

With PRTG
included

Consolidated view of CPU, memory, disk I/O, and database metrics in one interface

Historical Performance Data

Without PRTG
not included

Export data manually; build custom scripts for trend analysis

With PRTG
included

Automatic historical data collection with built-in graphs and trend visualization

Threshold Alerting

Without PRTG
not included

Set up SQL Agent jobs or write custom scripts for alerts

With PRTG
included

Point-and-click threshold configuration with multi-channel notifications

free downLoad

“We set up PRTG to read the event logs of the service. If the service is no longer able to access the database, then this information is recorded in the service’s EventLog and immediately detected by PRTG via WMI. The software then automatically triggers a script that restarts the service. The service reestablishes its connection to the database and the problem is solved.”

David Jungwirth
Austrian Red Cross

“Thanks to significant improvements in performance, the integration of all monitoring (including that of databases and SAP services) into PRTG, numerous automation options, and the consolidation of all locations into the centralized monitoring system, we have been able to greatly relieve our help desk and provide for the most reliable and comprehensive of monitoring services.”

Mirco Blöchliger
Somnitec AG

“We are currently using 4,500 sensors across the whole hospital which monitor physical servers, virtual machines, physical switches, ports, special devices such as ventilators and we also started writing some scripts which check SQL databases. So far PRTG has led to faster problem resolution, which has helped reduce downtime, made the team more efficient and, as a consequence, has freed up time for other projects.”

Uri Inbar, Director of IT
ALYN Hospital

Paessler PRTG Network Monitor licenses & pricing

Choose the PRTG Network Monitor subscription that's best for you.

License NameLicense descriptionPriceLicense DetailsGet startedPricing Details
PRTG 500$200per month paid annuallyBuy nowBuy now

Enough to monitor multiple aspects of 50 devices

PRTG 1000$358per month paid annuallyBuy nowBuy now

Enough to monitor multiple aspects of 100 devices

PRTG 2500$742per month paid annuallyBuy nowBuy now

Enough to monitor multiple aspects of 250 devices

PRTG 5000$1,300per month paid annuallyBuy nowBuy now

Enough to monitor multiple aspects of 500 devices

PRTG 10000$1,642per month paid annuallyBuy nowBuy now

Enough to monitor multiple aspects of 1000 devices

Over 100,000 Customers Worldwide Love Paessler  

customer success stories

 SQL Server Monitoring Tool: Frequently Asked Questions


Can PRTG monitor SQL Server on Linux?

Yes. SQL v2 sensors connect via the database protocol directly, not WMI, so Linux-hosted SQL Server instances work fine. The Microsoft SQL v2 sensor executes SQL statements against them the same way it does on Windows. For operating system metrics on the Linux host itself, use SSH-based sensors or SNMP if that's enabled on the server.  

Does PRTG monitor SQL Server AlwaysOn availability groups?

No dedicated sensor exists for this, but it's doable with custom SQL statements via the Microsoft SQL v2 sensor. Query the DMVs for replica status, synchronization state, and failover readiness, then process the return values into individual channels to track each replica separately. Combine that with WMI sensors on the cluster nodes and you have reasonable availability group visibility. Not the same as a purpose-built solution, but it covers the important states.

How does PRTG handle authentication for SQL Server monitoring?

Two options. Windows Authentication uses impersonation and inherits credentials from the object hierarchy: set them at the probe, group, or device level under Windows credentials. SQL Server Authentication uses the Database Management Systems credentials section at the device level. Either way, DBAs set credentials once and sensors inherit them. No re-entering per sensor.

Can PRTG track specific SQL queries or stored procedures?

Yes, with one important clarification: PRTG doesn't inspect live traffic or hook into SQL Server's query execution engine. Write a SQL query that checks for the metrics you care about, like execution counts, duration, or wait times for stored procedures and functions, then run it via the Microsoft SQL v2 sensor. The sensor measures execution time and processes return values into channels. Works well for application-specific checks, less useful if you need real-time query plan analysis.

What's the difference between the Microsoft SQL v2 sensor and WMI Microsoft SQL Server sensors?

Different data sources entirely. The SQL v2 sensor connects directly to the database and executes SQL statements. It measures query execution time and processes whatever your query returns. WMI sensors pull performance counters from Windows via WMI: buffer cache hit ratio, page life expectancy, batch requests per second, that kind of thing. SQL v2 is for query-level SQL Server performance monitoring and custom checks. WMI is for system-level SQL Server metrics. Most setups run both.

Paessler PRTG

Paessler PRTG

Network Monitoring Software – Version 26.1.116.1532 (February 9th, 2026)

Hosting icon

Hosting

Download for Windows and cloud-based version PRTG Hosted Monitor available

Languages icon

Languages

English, German, Spanish, French, Portuguese, Dutch, Russian, Japanese, and Simplified Chinese

test

Monitor everything

Network devices, bandwidth, servers, applications, virtual environments, remote systems, IoT, and more

test

Pricing

Choose the PRTG Network Monitor subscription that's best for you

Discover more monitoring insights and stories

Content illustration

Powerful stories from the monitoring world

  • Complete SQL Performance Monitoring Guide with PRTG SQL ...
  • SQL Server Performance Monitoring: Essential Tools and Best ...
  • Monitoring (Almost) Any SQL Server Through ADO with PRTG ...
Support illustration

Resources to master your monitoring challenges

  • PRTG Manual: Microsoft SQL v2 Sensor - Paessler
  • PRTG Manual: WMI Microsoft SQL Server 2012 Sensor
  • PRTG Manual: Monitoring Databases - Paessler
Solution illustration

Solutions for all your monitoring needs

  • SQL Server Monitoring
  • Database Performance Monitoring
  • Monitoring Databases
PRTG Logo

Start Monitoring with PRTG and see how it can make your network more reliable and your job easier.

Free download
PRODUCT OVERVIEW

Products

  • Paessler PRTG
    Paessler PRTGMonitor your whole IT infrastructure
    • PRTG Network Monitor
    • PRTG Enterprise Monitor
    • PRTG Hosted Monitor
    • PRTG UVexplorer
    • PRTG extensions
      Extensions for Paessler PRTGExtend your monitoring to a new level
  • Icon Features
    FeaturesExplore all monitoring features

Monitoring with PRTG

  • Network monitoring
  • Bandwidth monitoring
  • SNMP monitoring
  • Network mapping
  • Wi-Fi monitoring
  • Server monitoring
  • Network traffic analyzer
  • NetFlow monitoring
  • Syslog server

Useful Links

  • PRTG Manual
  • Knowledge Base
  • Customer Success Stories
  • About Paessler
  • Subscribe to newsletter
  • PRTG Support
  • PRTG Consulting
  • PRTG Feedback & Roadmap

Contact

Paessler GmbH
Thurn-und-Taxis-Str. 14, 
90411 Nuremberg 
Germany

[email protected]

+49 911 93775-0

  • Contact us
©2026 Paessler GmbHTerms & ConditionsPrivacy PolicyImprintReport VulnerabilityDownload & InstallSitemap
How to run an auto-discovery in PRTG in 5 steps How to run an auto-discovery in PRTG in 5 steps How to run an auto-discovery in PRTG in 5 steps