




Custom alerts and data visualization let you quickly identify and prevent virtual machine performance issues and problesm with your vSphere environment.
Virtualization works best if you can keep an eye on CPU load, disk usage, performance, and network utilization of your VMs. If an issue arises there, then there will also be an issue with the virtual machines – which means you'll soon be struggling with compounding problems.
VMware monitoring with Paessler PRTG allows you to keep track of all parts of your virtual environment – from the host server to the applications running on each virtual server.
If too many virtual machines run on one host, it can lead to system overload and performance issues. With PRTG, you can set customized warning and error thresholds (for example, at 75%).
If this threshold is crossed, you’ll quickly receive a notification by email, SMS, push, and more. This way, you’re alerted to problems before your clients or coworkers are aware that anything is wrong. use the tone and voice of your organization.
PRTG is also available as a hosted monitoring solution (Monitoring as a Service). You can easily get the cloud-based tool up and running within minutes, and it offers the full range of features.
With our comprehensive PRTG VMware monitoring tools – on premises or in the cloud – any potential trouble spots will be instantly visible so you can take quick action.

Paessler achieved VMware's highest level of endorsement due to our technological excellence, leading market position, and superior compatibility with VMware products.
What does this mean for you?
Diagnose network issues by continuously tracking VMware vSphere performance and the health of your VMware ESXi servers and hypervisors. Show VM monitoring stats, CPU usage, resource usage, uptime, and other key metrics in real time. Visualize monitoring data in clear graphs and dashboards to identify problems more easily. Gain the overview you need to troubleshoot VMware tools, virtual machines, and devices.
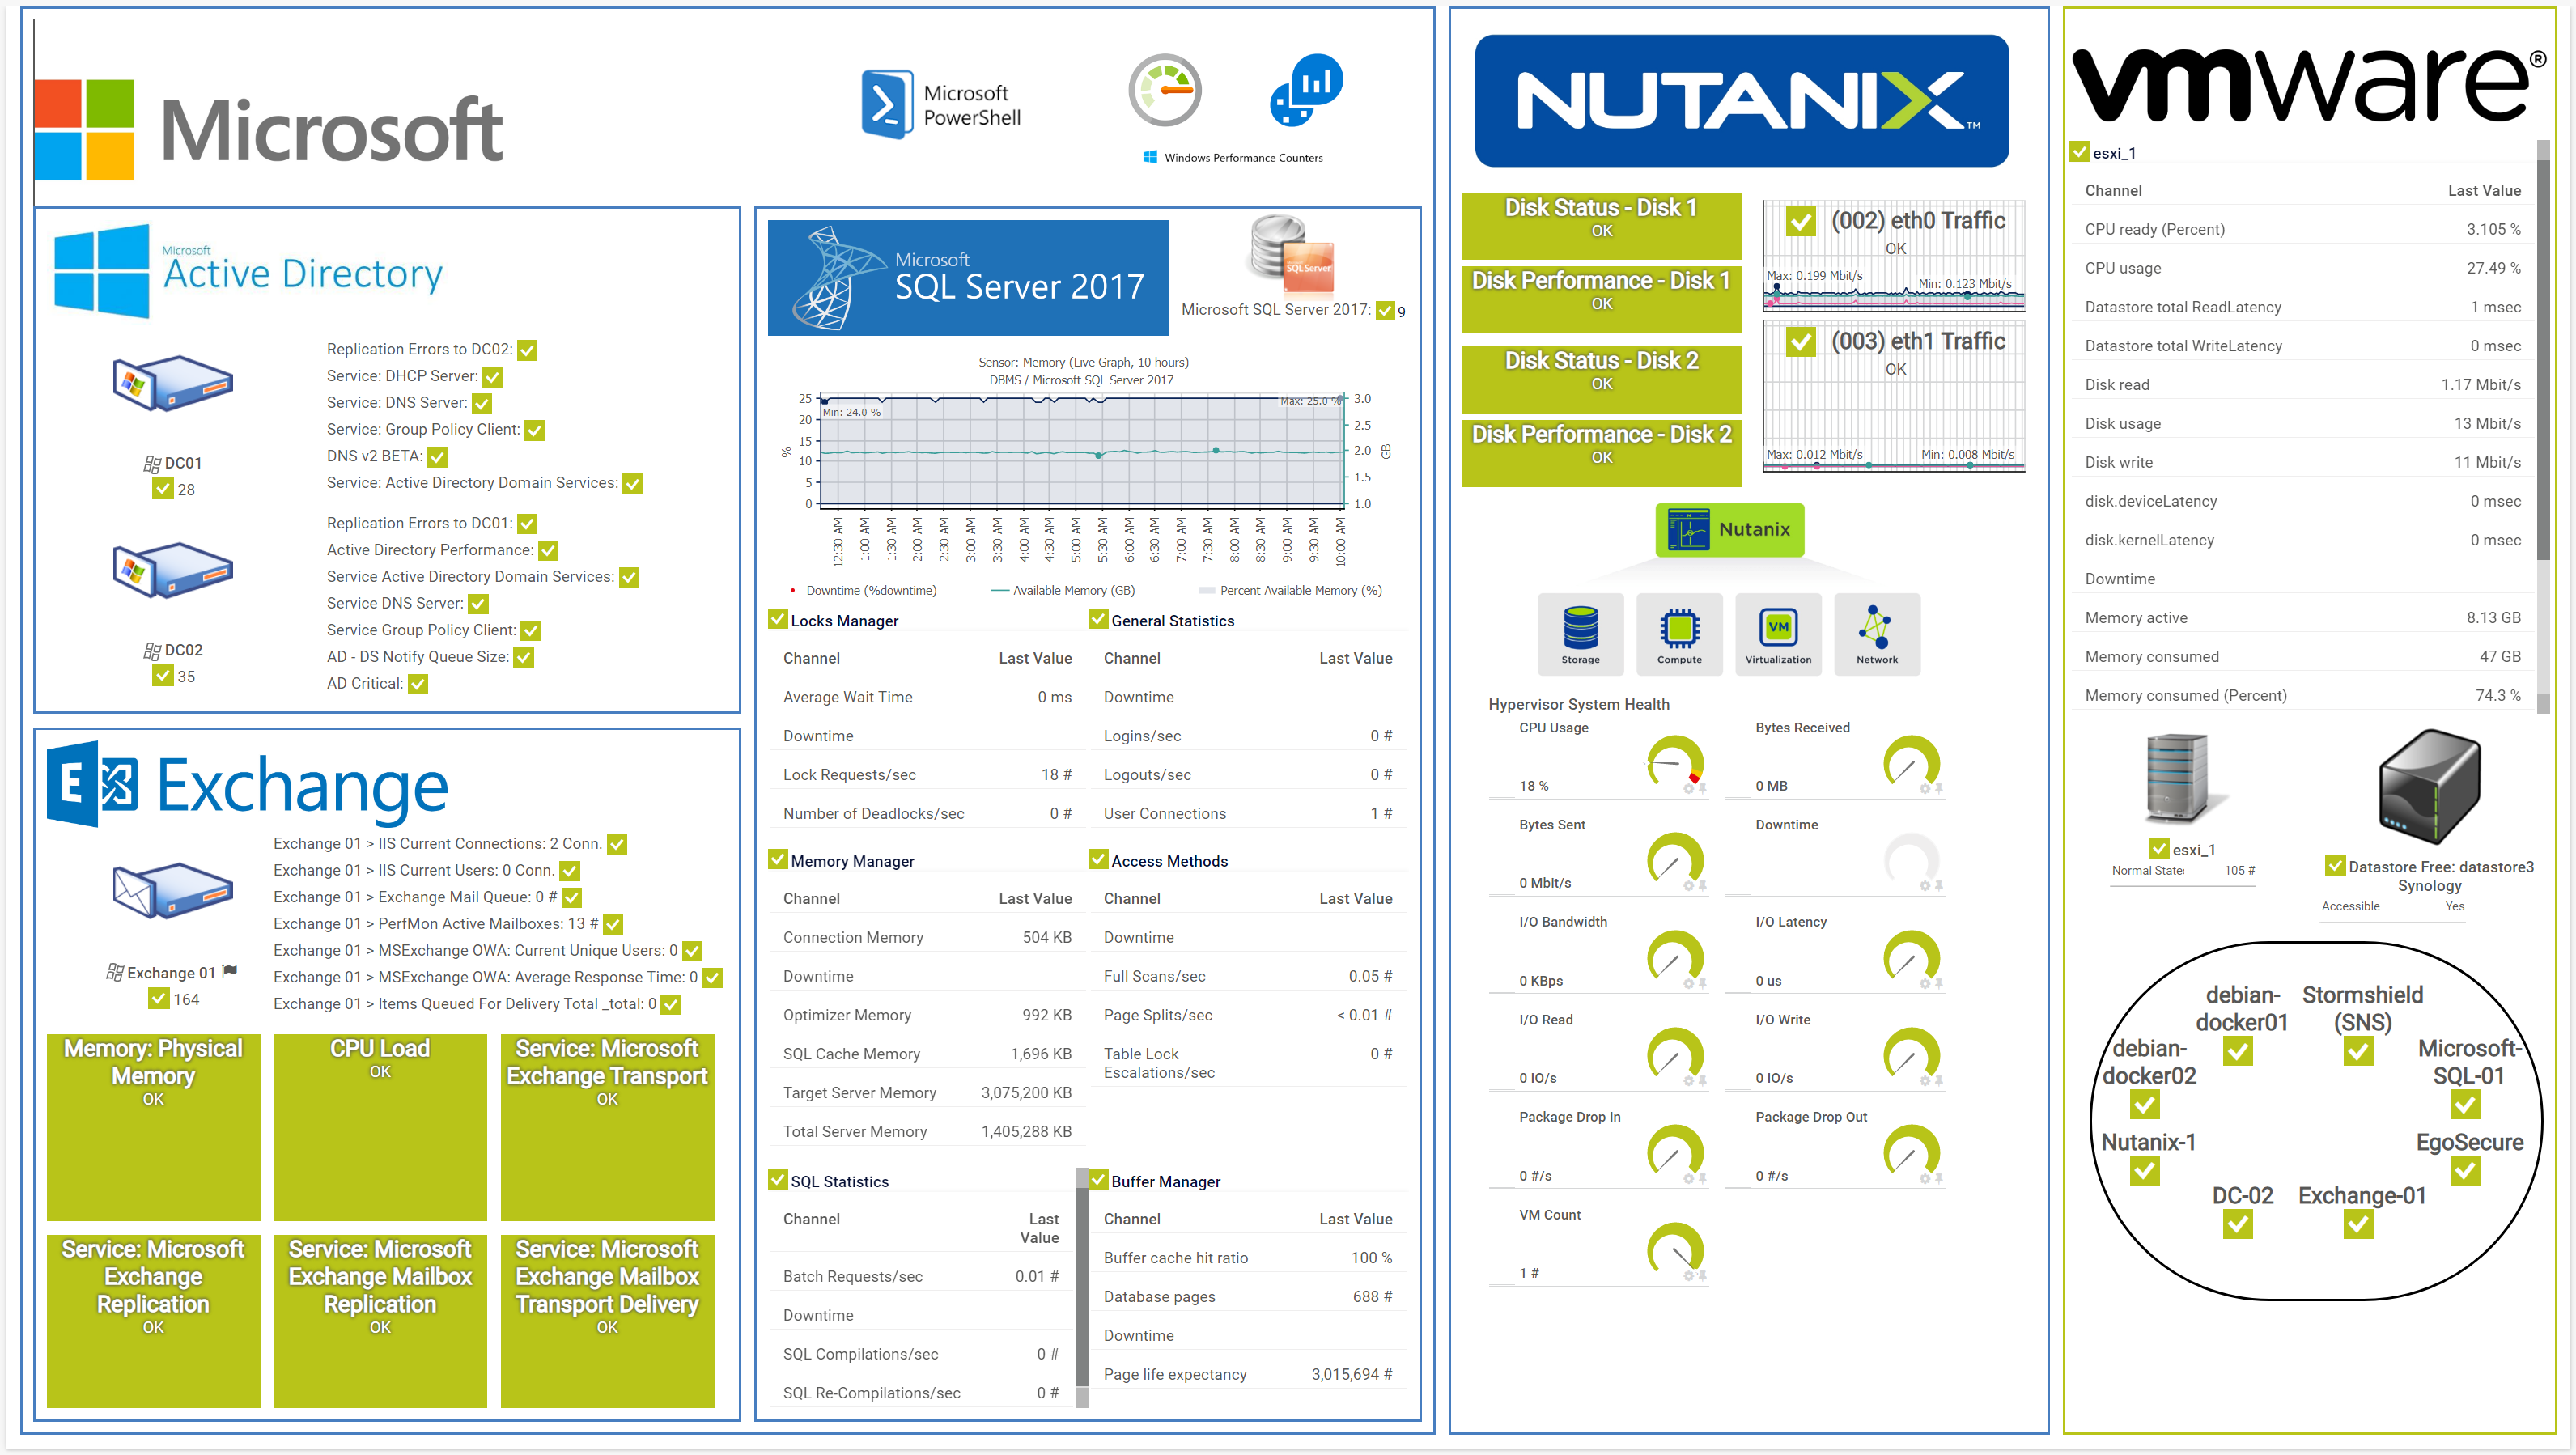
PRTG overview map MS, Nutanix, VMware
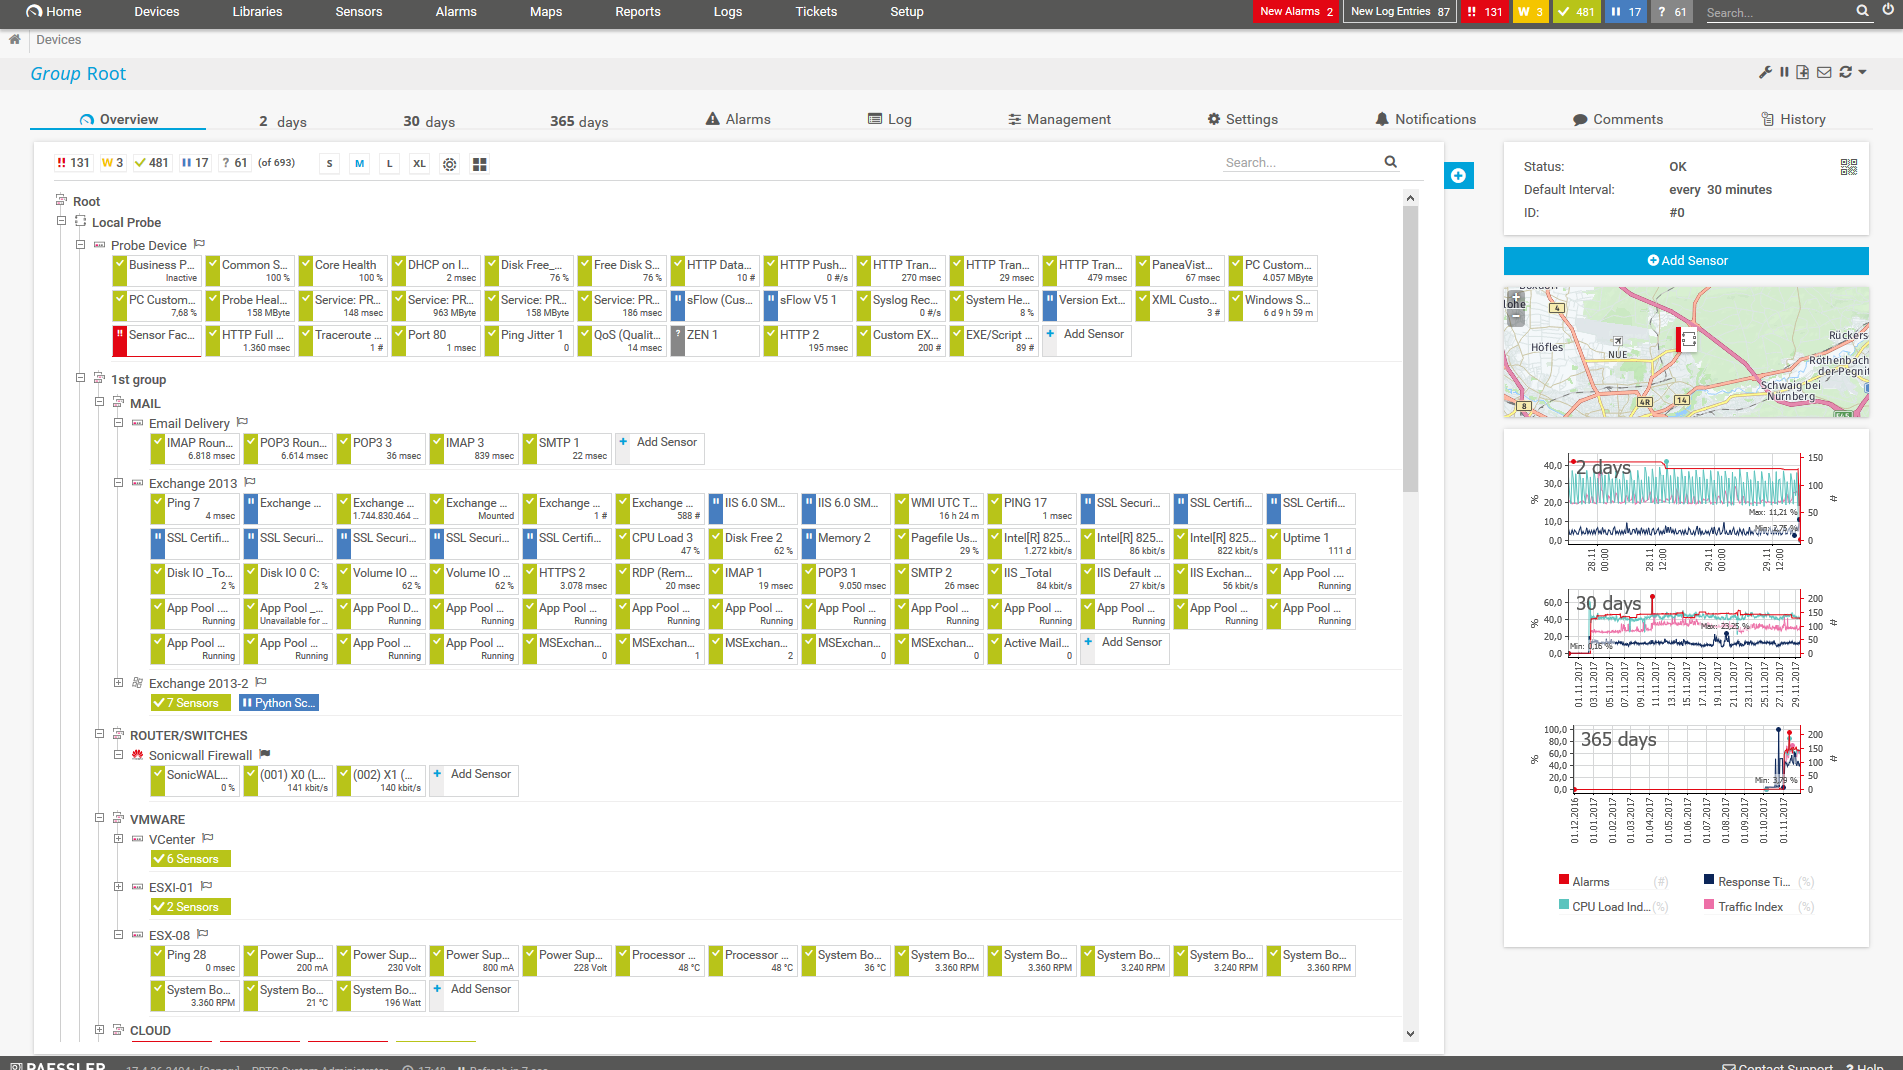
Device tree view of the complete monitoring setup
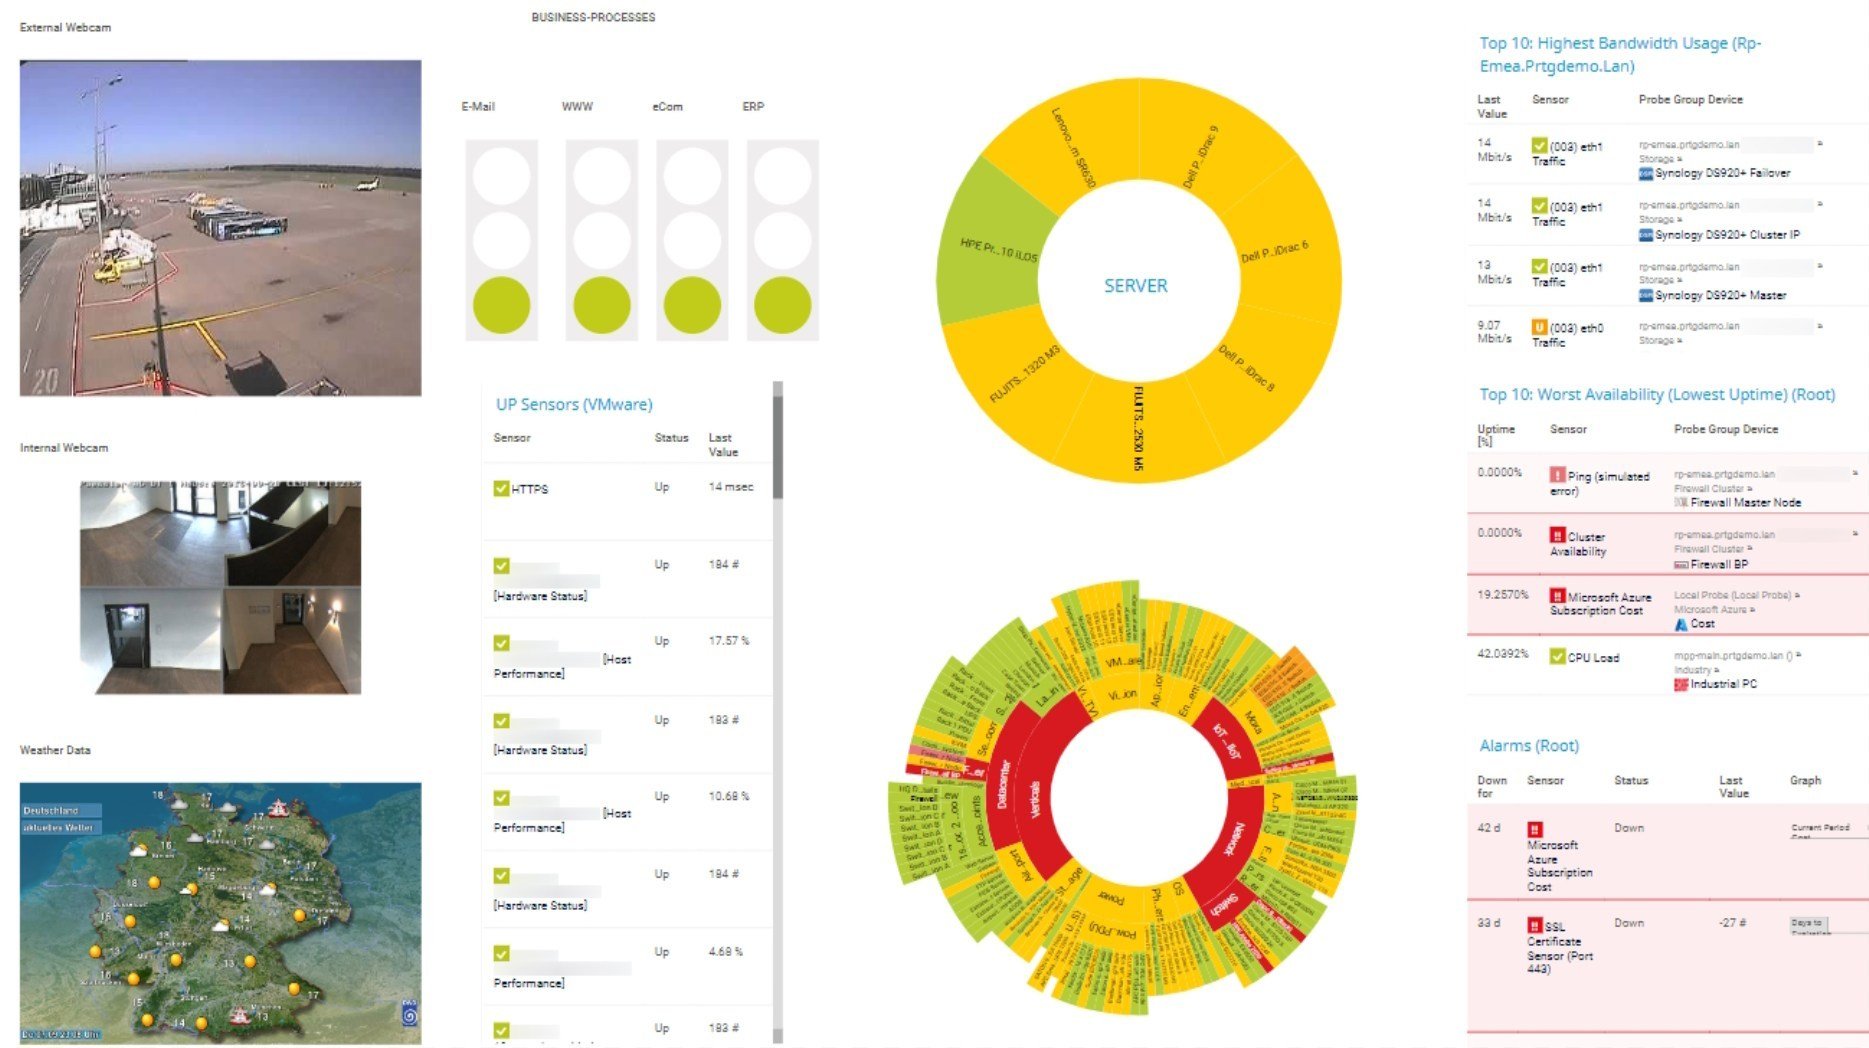
Custom PRTG dashboard for keeping an eye on the entire IT infrastructure
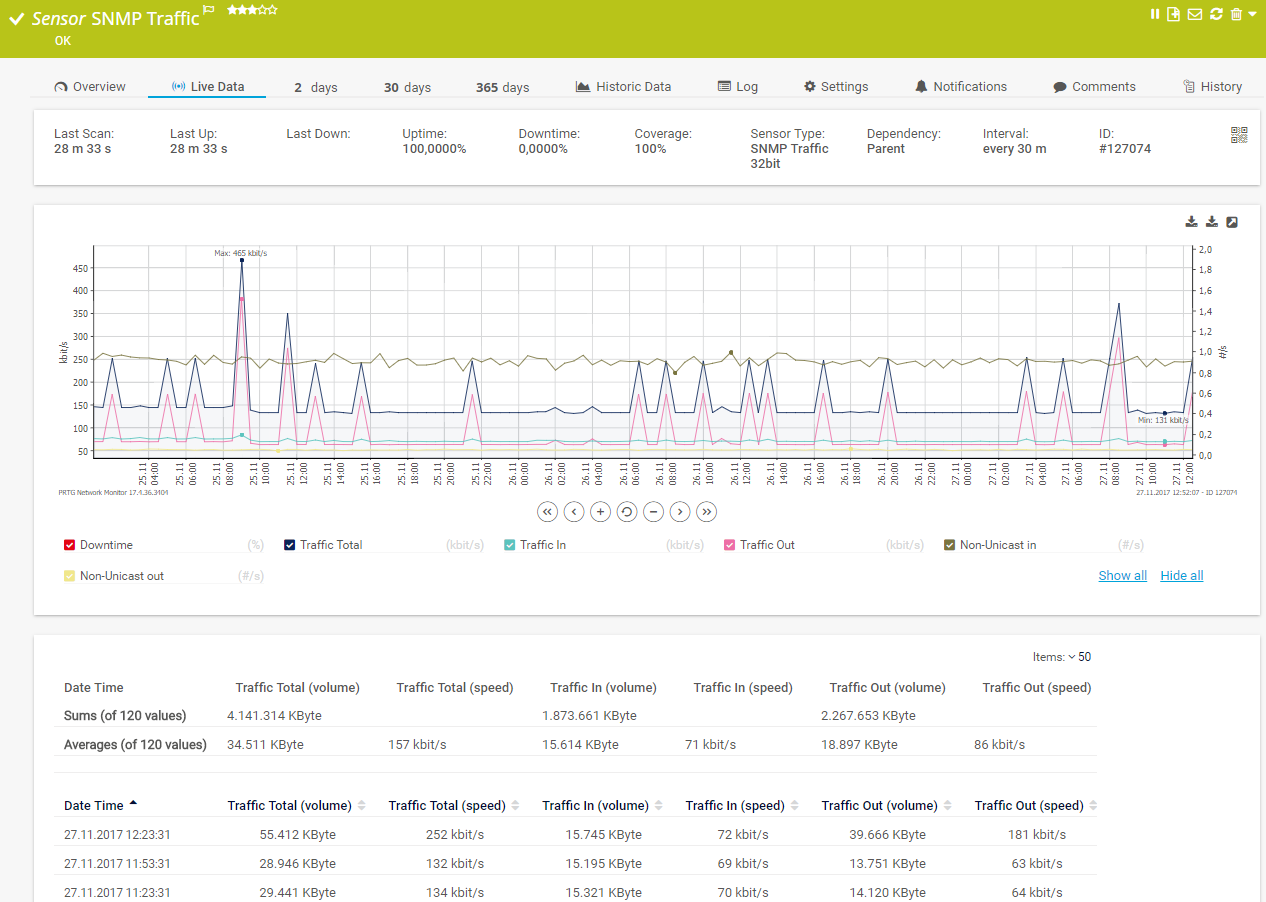
Live traffic data graph in PRTG

“All-around winning
network monitor”

“The real beauty of PRTG is the endless possibilities it offers”

“PRTG Network Monitor
is very hard to beat”
Although our sensors for monitoring ESXi host hardware servers work only directly with your VMware ESX 5+ server and its parent devices, you can also use the VMware Virtual Machine (SOAP) sensor to monitor your virtual machines in two different ways:
Monitoring the vCenter server allows you to continue to monitor virtual machines directly, even after they change physical hosts with vMotion.
Real-time notifications mean faster troubleshooting so that you can act before more serious issues occur.
Unlike VMware vRealize Operations, PRTG offers monitoring of your virtual machines on different levels and keeps track of your physical servers, server hardware, and much more.
Another advantage is that PRTG allows you to monitor all the other elements and services in your network, such as the bandwidth usage of your applications, the availability and performance of your websites, and the available disk space of your network drives.
PRTG is set up in a matter of minutes and can be used on a wide variety of mobile devices.
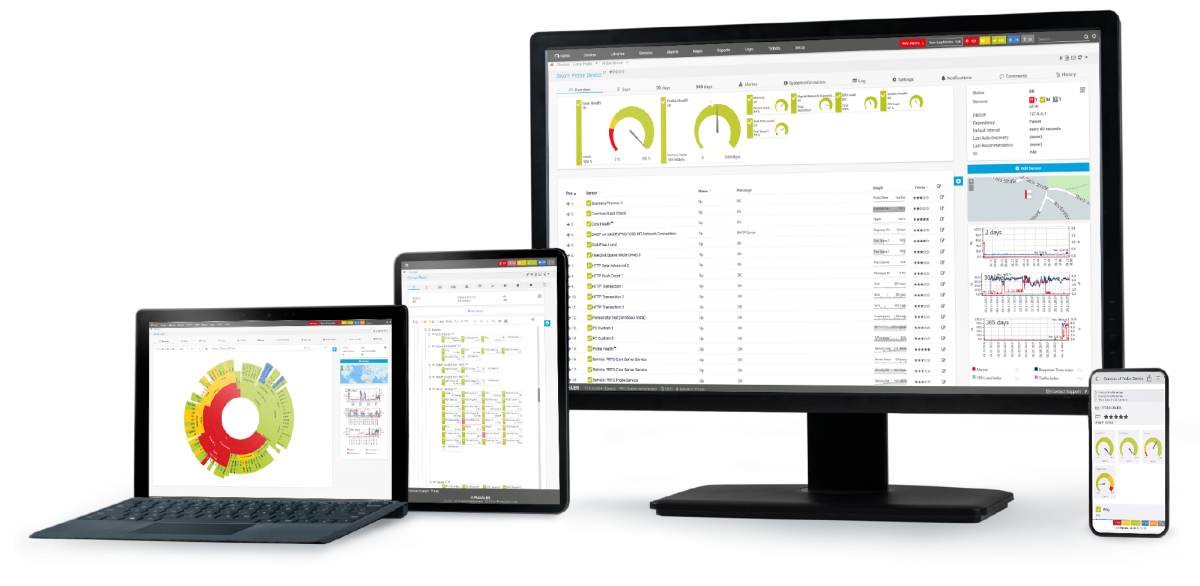
Real-time notifications mean faster troubleshooting so that you can act before more serious issues occur.
VMware is a leading virtualization and cloud computing software company. It provides a range of products and solutions for virtualizing computing, networking, storage, and management resources in data centers. VMware's flagship product is its virtualization platform, which allows multiple operating systems to run on a single physical server concurrently.
VMware monitoring allows you to keep a constant eye on important application and performance data of your virtual machines. This includes parameters like CPU load, memory usage or downtime. By monitoring VMware, you are always up to date with the performance of your virtual machines.
Monitoring virtual machines is essential for maintaining optimal performance, ensuring the reliability of services, and making informed decisions about resource allocation and capacity planning in virtualized environments.
VMware virtual machine monitoring with PRTG allows you to keep track of all parts of your virtual environment – from the host server to the applications running on each VM.
Virtualization using VMware products, for example, is a crucial part of many IT environments and an effective way to reduce expenses while boosting efficiency and flexibility of your business. It allows you to distribute applications and databases over different servers, networks, and locations. To avoid downtimes and ensure a good overall performance, you should monitor your VMware servers and all of your virtual machines.
In PRTG, “sensors” are the basic monitoring elements. One sensor usually monitors one measured value in your network, for example the traffic of a switch port, the CPU load of a server, or the free space on a disk drive. On average, you need about 5-10 sensors per device or one sensor per switch port.
Paessler PRTG is used by companies of all sizes. Sysadmins love PRTG because it makes their job a whole lot easier.
Bandwidth, servers, virtual environments, websites, VoIP services – PRTG keeps an eye on your entire network.
Everyone has different monitoring needs. That’s why we let you try PRTG for free.
