![]()
Trace network traffic with PRTG
and keep a constant eye on everything

Network traffic and
data packet tracer
Packet Sniffing, Flow, SNMP
Monitor routers, switches,
ports, and servers
Transparent licensing & pricing
Trace network traffic with PRTG Network Monitor
Jump to the topic of your choice
- Sensors for tracing your network traffic
- 5 advantages of PRTG for conveniently tracing your network traffic
- Network traffic: Monitoring vs. recording
- Traceroute tools in Linux and Windows
- The following 2 articles from our blog take a closer look at Traceroute
- How to record port traffic
- Reader tips from our Knowledge Baseon “trace” and “hops”
- Perform a traceroute on a server
Sensors for tracing your network traffic
![]() How PRTG defines sensors
How PRTG defines sensors
In PRTG, “sensors” are the basic monitoring elements. One sensor usually monitors one measured value in your network, e.g. the traffic of a switch port, the CPU load of a server, the free space of a disk drive. On average you need about 5-10 sensors per device or one sensor per switch port.
![]()
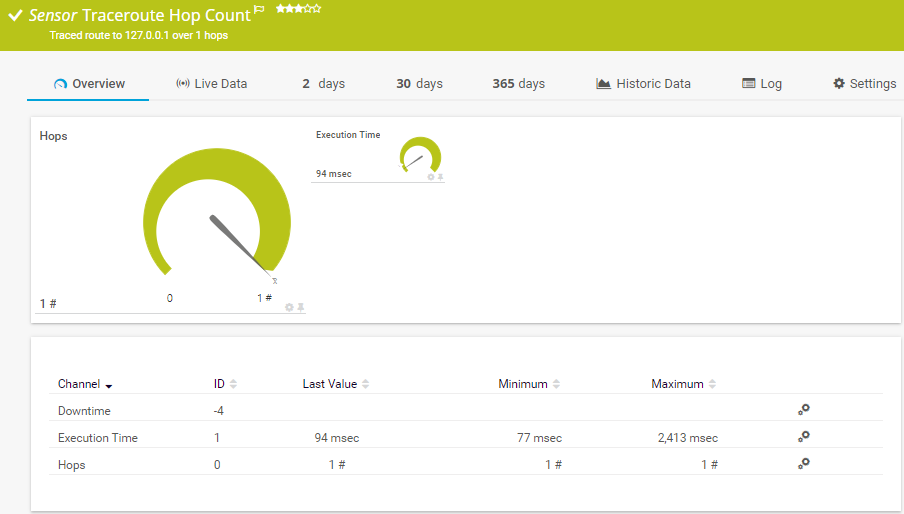
Traceroute Hop Count Sensor
The Traceroute Hop Count Sensor measures the time and number of hops a data packet needs to reach its destination. It therefore helps you gauge the stability of your network. This sensor can also sound the alarm if a data packet’s route changes.
![]()
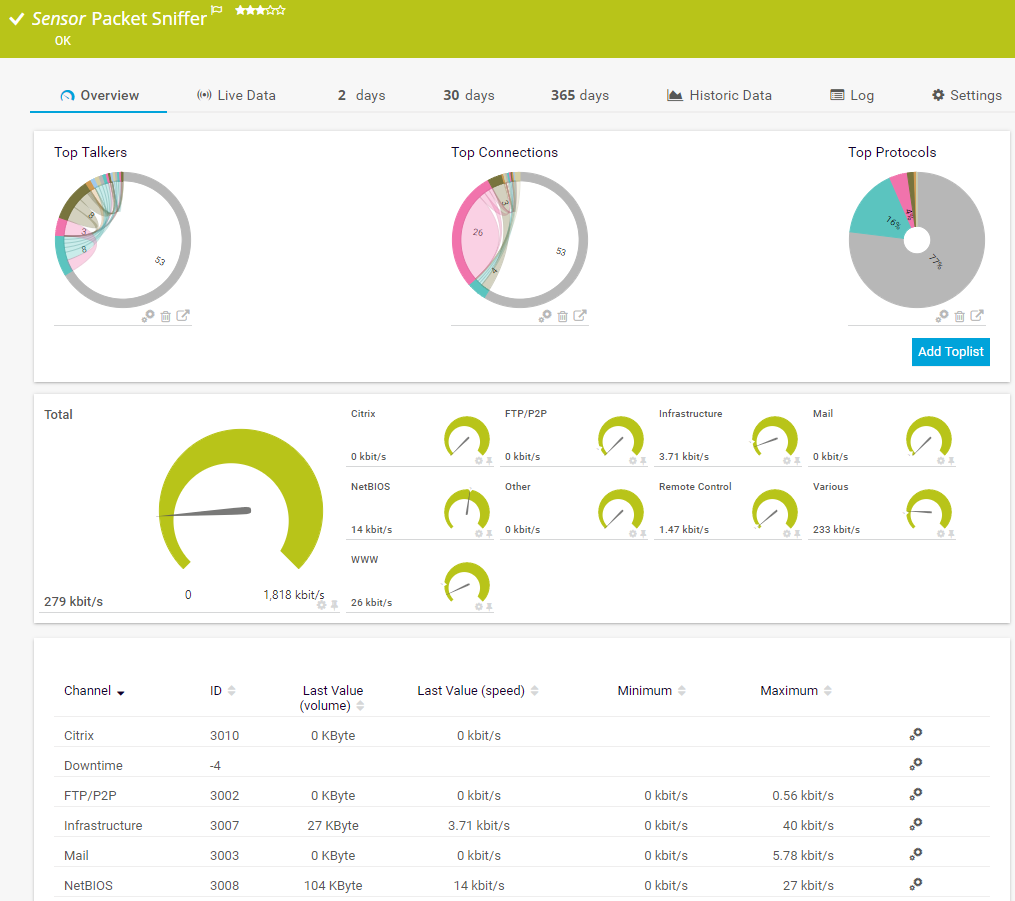
Packet Sniffer Sensor
The Packet Sniffer Sensor is a vital sensor for tracing network traffic. It displays the amount of bandwidth needed for connections and applications such as web, mail, and FTP traffic, as well as the origin and destination of data. More on packet sniffing.
![]()
NetFlow sensors
IPFIX Sensor, NetFlow V5/V9, or jFlow and sFlow: PRTG comes with Flow sensors that monitor devices from Cisco, as well as other manufacturers which support Flow technology. This sensor also displays the connections and applications that use the most bandwidth. More on NetFlow monitoring and IPFIX monitoring.
![]()
SNMP sensors
PRTG comes with dozens of SNMP sensors which allow you to monitor your data traffic and hardware. For when it comes to bandwidth or network traffic issues, the problem can also lie in your hardware. More on SNMP monitoring.

5 advantages of PRTG for conveniently tracing your network traffic
![]()
PRTG is always accessible
PRTG consolidates all your monitoring information into an easy-to-read, customizable dashboard. A quick glance is all it takes to know that everything is OK.
![]()
Easy installation
Thanks to the Auto Discovery feature, which pings a specific range of IP addresses, PRTG is set up and ready to go in no time. You can therefore start checking your network traffic at once.
![]()
Customizable
PRTG comes with over 250 predefined sensors. It also offers customizable sensors (“custom sensors”) that can monitor the values which are most important to your company.
![]()
Customizable alarm
Is your data line about to overload? PRTG promptly lets you know if your traffic increases and risks causing problems in your network. Its built-in alarm feature is fast-acting, and allows you to take action at once.
![]()
All-in-one monitoring
With a PRTG license, you get the full range of sensors, the notification system (alarm), the reports feature, and technical support. And that is sure to make your higher-ups happy.
Network traffic: Monitoring vs. recording
Network traffic monitoring
PRTG is a network monitoring tool that allows you to monitor your traffic as well as the status of your hardware and applications. PRTG provides you with a constant ove.
Network traffic recording
If you specifically wish to record your traffic and have a look at individual data packets, then you will need another type of software. There are many such tools on the market.
“The Packet Sniffer Sensor allows you to analyze traffic in your network in much the same way as deep packet inspection. You can see, for example, if mail traffic is alarmingly high, or if P2P file sharing is being used in your company network and thus posing a risk to network security.” Stephan Linke, Paessler Technical Support
“Hey Stephan, do you have any tips for packet sniffing
with PRTG?”
Traceroute tools in Linux and Windows
![]()
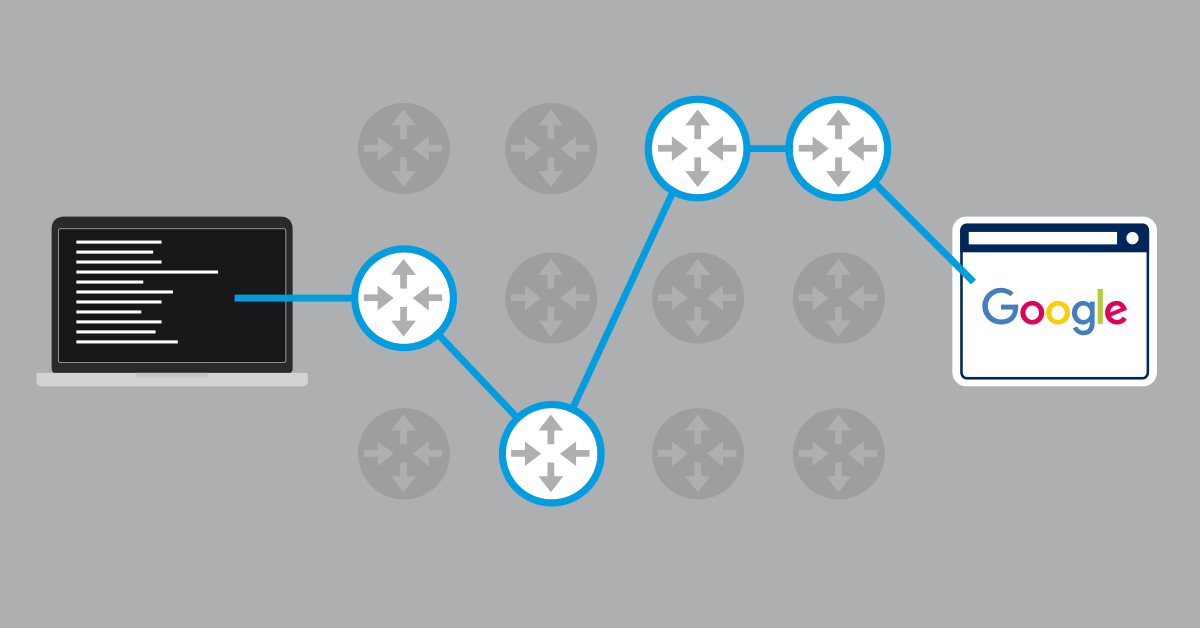
Linux tool
Trace Route (or “Traceroute”) is a command line tool in Linux/Unix. It lets you trace the route of data in your network. Individual hops are captured and recorded. As a result, you can identify bottlenecks and disruptions.
![]()
Windows tool
A similar command line tool exists for Windows. This tool is called “Tracert.” Tracert also allows you to determine the path of data packets by entering commands in the command line. With Tracert, you can pinpoint (for example) where a data packet got delayed.
![]()
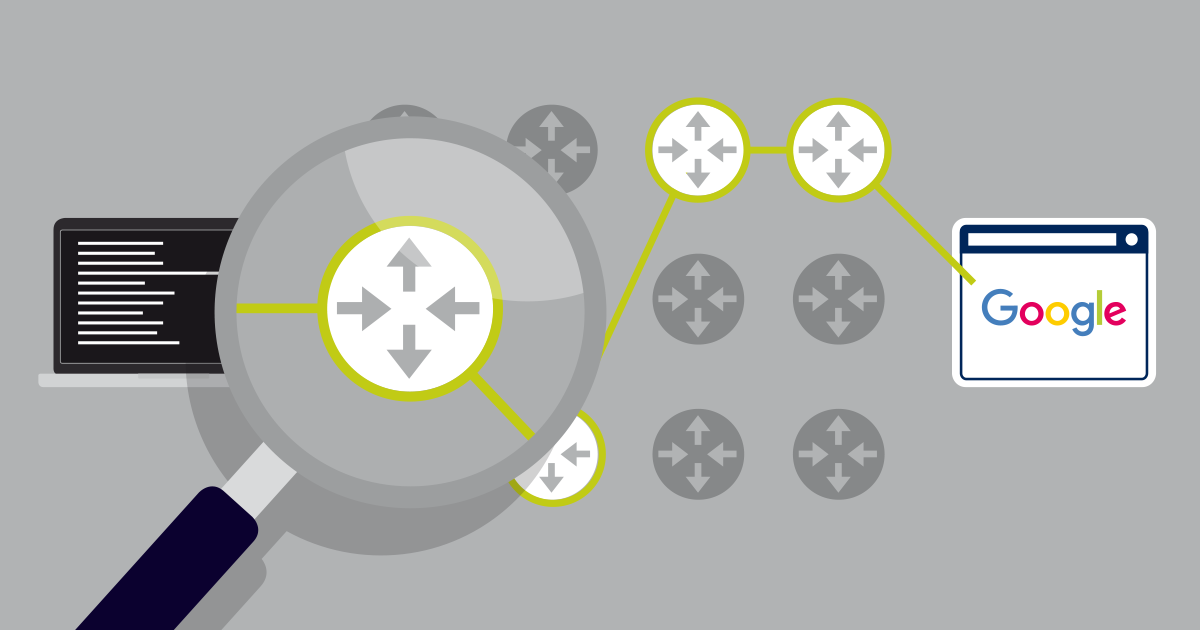
PRTG
Unlike command line tools such as Traceroute and Tracert which are used selectively, PRTG continually monitors your entire IT structure. In the event of delays, disruptions, or crashes, PRTG immediately sounds the alarm. There are many possible reasons for a data packet not reaching its destination. With PRTG, troubleshooting is a whole lot faster and easier.
Trusted by 500,000 users and recognized
by industry analysts as a leader

“Fantastic network and infrastructure monitoring solution that is easy to deploy and easier still to use. Simply the best available.”

“Software is absolutely perfect, Support is superior. Meets all needs and requirements, this is a must have solution if you are needing any form of monitoring.”

“The tool excels at its primary focus of being a unified infrastructure management and network monitoring service.”
How to record port traffic
Why port monitoring is important
Open ports are gateways for Trojan horses and other attacks. Ports are often used on a temporary basis. In large, unmonitored networks, there are almost always open ports which go forgotten. Monitoring data traffic across network ports is important to prevent overloads and sniff out suspicious traffic.
Port traffic: How PRTG can help
PRTG monitors open and closed ports. The network monitoring tool monitors all traffic and records the connections. As an IT manager, you therefore get a constant overview of the traffic that flows through your ports.
Sensors for recording port traffic
PRTG comes with a number of preconfigured port sensors. These include the above-mentioned SNMP Traffic Sensor, Packet Sniffer Sensor, and Flows sensors, as well as the Port Sensor and the Port Range Sensor, which monitors a range of ports and indicates whether these ports are open or closed. More on port monitoring.
“Easy to implement and configure with good technical support.”
R. v. S., ICT Manager at Heinen & Hopman Eng BV
Perform a traceroute on a server
With PRTG, you can perform a traceroute on a specific server or another network device with just two clicks of the mouse.
- The target device should already be incorporated into your monitoring. If not, add the desired device to PRTG.
- In the PRTG device tree, scroll down to the device upon which you would like to perform the traceroute.Right-click on the device to open its context menu.In the “Device Tools” menu, click on “Traceroute...”.
- Right-click on the device to open its context menu.
- In the “Device Tools” menu, click on “Traceroute...”.
PRTG will now perform a traceroute on the target device and display the results in a matter of seconds.
Keep a constant eye on your network – even while on the go
Set up PRTG in minutes and use it on almost any mobile device.


PRTG: The multi-tool for sysadmins
Adapt PRTG individually and dynamically to your needs and rely on a strong API:- HTTP API: Access monitoring data and manipulate monitoring objects via HTTP requests
- Custom sensors: Create your own PRTG sensors for customized monitoring
- Custom notifications: Create your own notifications and send action triggers to external systems
- REST Custom sensor: Monitor almost everything that provides data in XML or JSON format
We asked: would you recommend PRTG?
Over 95% of our customers say yes!
Paessler AG conducted trials in over 600 IT departments worldwide to tune its network monitoring software closer to the needs of sysadmins.
The result of the survey: over 95% of the participants would recommend PRTG – or already have.


Learn more about how to trace and monitor your network traffic
QoS monitoring – Do away with delays
PRTG comes with several QoS sensors which are perfect for quality of service monitoring. With these sensors, you will discover when (and why) delays and disruptions occur in your VoIP. Other QoS-related topics include jitter monitoring and the analysis of packet loss.
IP SLA monitoring
PRTG comes with special sensors for Cisco devices. With IP SLA monitoring, evaluating the quality of service of your Cisco routers and switches is easy.
CPU monitoring
When processors are overloaded, the entire network is brought to its knees. PRTG lets you monitor the CPUs of servers, routers, and switches. In the event of bottlenecks, you’ll be notified at once.
Still not convinced?
![]()
More than 500,000 sysadmins love PRTG
Paessler PRTG is used by companies of all sizes. Sysadmins love PRTG because it makes their job a whole lot easier.
Still not convinced?
![]()
Monitor your entire IT infrastructure
Bandwidth, servers, virtual environments, websites, VoIP services – PRTG keeps an eye on your entire network.
![]()
Try Paessler PRTG for free
Everyone has different monitoring needs. That’s why we let you try PRTG for free. Start now with your trial.
|
PRTG |
Network Monitoring Software - Version 24.2.94.1400 (April 10th, 2024) |
|
Hosting |
Download for Windows and cloud-based version PRTG Hosted Monitor available |
Languages |
English, German, Spanish, French, Portuguese, Dutch, Russian, Japanese, and Simplified Chinese |
Pricing |
Up to 100 sensors for free (Price List) |
Unified Monitoring |
Network devices, bandwidth, servers, applications, virtual environments, remote systems, IoT, and more |
Supported Vendors & Applications |
|
Combining the broad monitoring feature set of PRTG with IP Fabric’s automated network assurance creates a new level of network visibility and reliability.