![]()
Combine your data storage management with PRTG NetApp monitoring
- Get detailed insights into your NetApp storage systems
- Always keep an eye on correct data storage operations
- Be notified immediately if there is a storage issue
- Visualize your NetApp monitoring in customizable dashboards
Our users give top ratings for monitoring with Paessler PRTG


Why choose NetApp monitoring with PRTG?
Start NetApp monitoring with PRTG and see how it can make your IT infrastructure more reliable and your job easier.
Comprehensive overview of your NetApp storage systems
![]() How PRTG defines sensors
How PRTG defines sensors
In PRTG, “sensors” are the basic monitoring elements. One sensor usually monitors one measured value in your network, e.g. the traffic of a switch port, the CPU load of a server, the free space of a disk drive. On average you need about 5-10 sensors per device or one sensor per switch port.
![]()
Deep insights into NetApp health and more
Paessler PRTG helps you look at your NetApp systems in detail. Keep an eye on the overall health status of your NetApp storage and watch CPU utilization, downtimes, storage usage, and general system health. Or dive deeper into NetApp performance and monitor different operations as well as read & write processes.
![]()
Monitor different NetApp cDOT & ONTAP components
With PRTG, you can monitor various hardware and software components of your cDOT and ONTAP storage systems so that you always know what’s going on in your NetApp environment. Monitor storage aggregates, logical interfaces, logical units, network interface cards, hard drives, enclosures, and more.
![]()
Collect detailed information via the NetApp API
Our PRTG sensors for NetApp monitoring request data in XML format from the ONTAP API. Depending on the sensor version you choose, PRTG accesses the API via SOAP or directly (as of ONTAP 9.6). This allows more details to be requested, such as data about complex NetApp systems.
![]()
Benefit from data-based storage capacity planning
Since more and more data is produced every year, storage space has become a valuable asset. IT teams need to make sure that enough storage is available at all times to meet the needs of software appliances and users alike.
PRTG informs you in good time if free space is becoming scarce so that you can react proactively and provide more storage. In addition, reports on your storage usage help you estimate future storage capacity so that you can plan your expenditures based on real data.
![]()
Identify potential security vulnerabilities
Use the easy-to-read and highly customizable dashboards in PRTG to visualize all monitoring data collected from your NetApp data storage & management systems. This way, you can see at one glance if there are anomalies that might indicate a potential security threat, for example unusual input or output operations.
PRTG increases IT security by immediately triggering an alarm if such unusual events occur.
Start NetApp monitoring with PRTG and see how it can make your IT infrastructure more reliable and your job easier.
Easy NetApp storage monitoring with preconfigured PRTG NetApp sensors
No matter if you’re looking for on-premises NetApp storage monitoring or hybrid NetApp cloud monitoring – if your IT infrastructure includes NetApp appliances, PRTG has got you covered. With our preconfigured sensors for NetApp monitoring, you can keep an eye on different aspects of your NetApp cDOT and NetApp ONTAP storage systems round the clock.
![]()
NetApp Aggregate v2 sensor
The NetApp Aggregate v2 sensor monitors the status of a NetApp storage aggregate. It displays metrics such as the number of disks on the aggregate, the free size, and the overall aggregate status.
![]()
NetApp I/O v2 sensor
The NetApp I/O v2 sensor monitors input and output operations such as CIFS, FCP, iSCSI, and NFS operations, read and write speed, as well as the number of bytes read and written.
![]()
NetApp LIF v2 sensor
The NetApp LIF v2 sensor monitors a logical interface of a NetApp storage system. It shows the number of read and written bytes, the total number of bytes, and if the LIF is on the home port.
![]()
NetApp LUN v2 sensor
The NetApp LUN v2 sensor monitors the logical unit number of a NetApp storage system. It displays the overall LUN status, the read, write, and total latency, IOPS, and throughput, as well as the number of free bytes.
![]()
NetApp NIC v2 sensor
The NetApp NIC v2 sensor monitors a network interface card of a NetApp storage system. It displays the overall NIC status, the number of bytes read and written, sent and received errors, and link status changes from up to down.
![]()
NetApp Physical Disk v2 sensor
The NetApp Physical Disk v2 sensor monitors physical disks of a NetApp storage system. It displays the container type, latency, the number of IOPS and path errors, throughput, and the total time that the disk has been spinning.
![]()
NetApp SnapMirror v2 sensor
The NetApp SnapMirror v2 sensor monitors SnapMirror relationships of an ONTAP storage system. It displays the system status, lag and last transfer duration and size, age of the last transfer, mirror and transfer status, policy type of the relationship, and the number of resynchronization and update fails.
![]()
NetApp System Health v2 sensor
The NetApp System Health v2 sensor monitors the health of a node of a NetApp storage cluster. It displays the node health, the number of failed power supplies and spare disks, temperature and NVRAM battery status, usable spare size, uptime, and the storage configuration path to the node connection.
![]()
NetApp Volume v2 sensor
The NetApp Volume v2 sensor monitors a volume of a NetApp storage system. It displays the number of snapshots, free physical bytes, and files that can be created on the volume, the time since the latest snapshot, the oldest snapshot age, the free size, and the autogrow status.
Visualize your NetApp performance monitoring in real time
All PRTG NetApp sensors provide you with an overview of the health status or performance of your NetApp devices as well as memory usage of your storage resources. This way, you can make sure that your NetApp storage systems always have sufficient storage space available and function as intended.
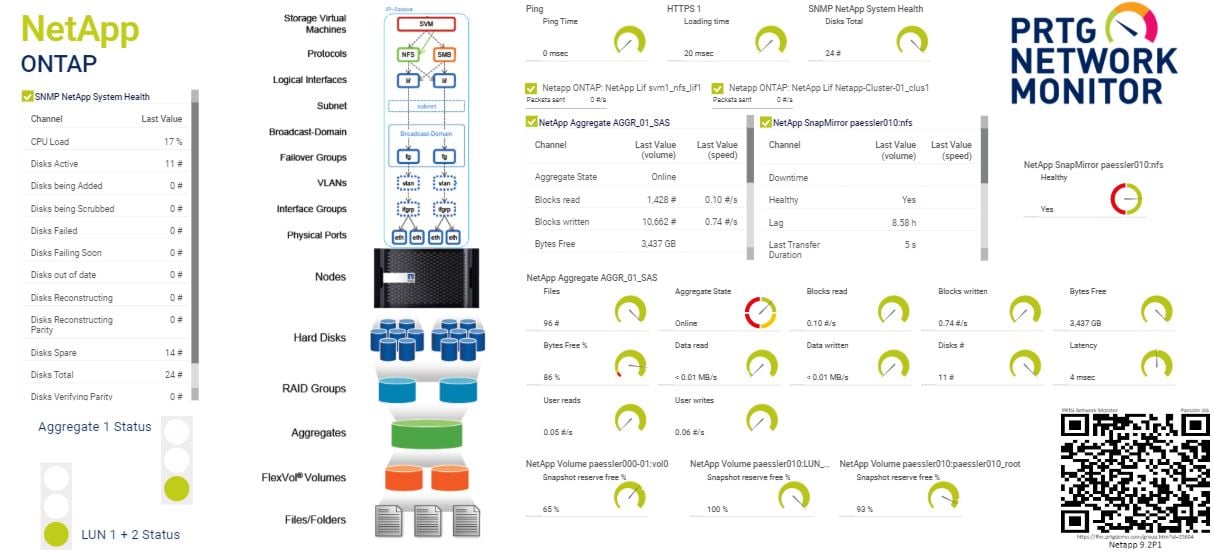
Dashboard for NetApp monitoring
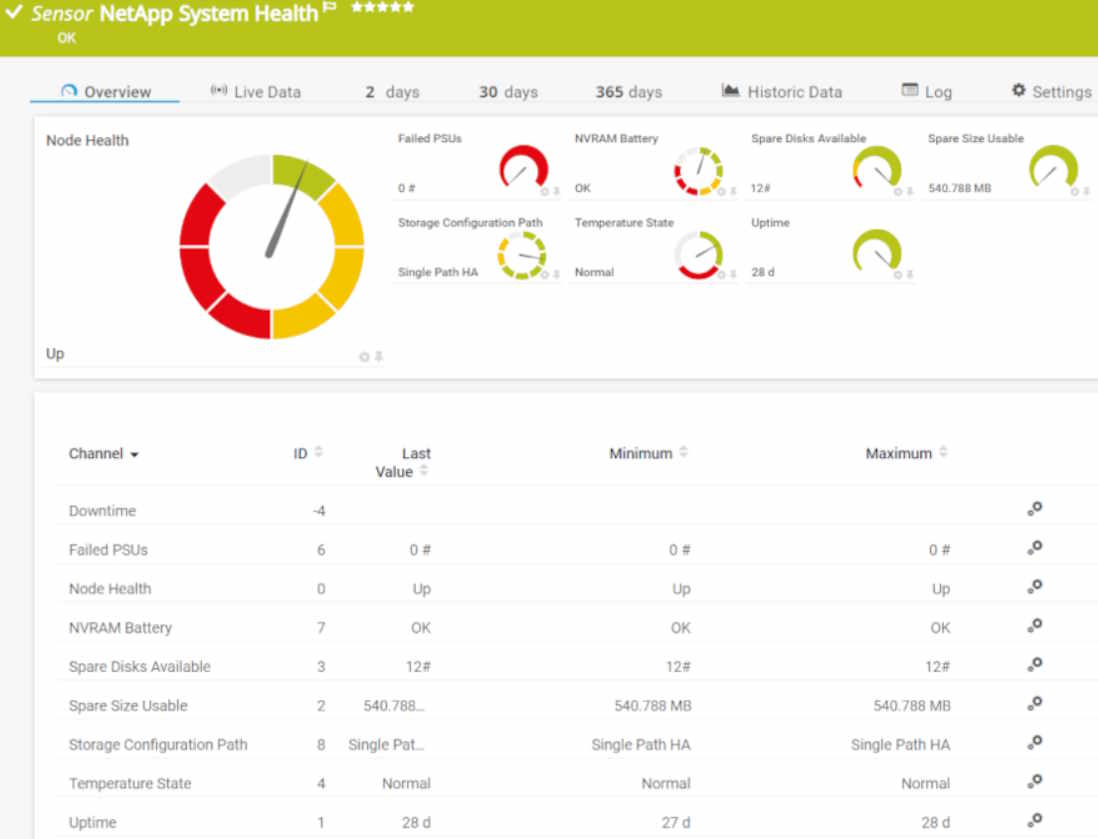
NetApp System Health v2 sensor

PRTG Sunburst view
PRTG makes NetApp monitoring easy
Custom alerts and data visualization make it easy to monitor, identify, and prevent NetApp storage issues.
Your NetApp monitoring at a glance – even on the go
Set up PRTG in minutes and use it on almost any mobile device.


3 reasons why PRTG is the perfect NetApp monitoring tool for you
![]()
Free NetApp monitoring for up to 100 sensors
PRTG comes as a freeware edition for up to 100 sensors. This is ideal for comprehensively monitoring smaller NetApp environments that include only a small number of NetApp storage devices.
If your monitoring needs grow and you need a higher number of sensors, you can always easily upgrade to one of our cost-efficient commercial editions. This makes PRTG the perfect fit for both small and large companies.
![]()
One monitoring tool for all requirements
NetApp's data management solutions are industry-leading: data is protected and accessible anytime, anywhere. For native NetApp monitoring, you could therefore also use NetApp OnCommand Insight (OCI) data management software to monitor and troubleshoot NetApp systems.
However, this also means that you need to use multiple monitoring tools to keep an eye on network devices from other vendors. This is not the case if you choose PRTG: our all-in-one monitoring tool lets you monitor your entire IT infrastructure including NetApp monitoring.
![]()
Customizable thresholds, alerts, and notifications
PRTG immediately alerts you if there is an issue with your NetApp monitoring. You can set individual warning and error thresholds as well as notification triggers that suit your monitoring requirements best.
In case of an alarm, PRTG notifies the responsible administrator or IT team via SMS, email, push notification, or many other channels. This way, you will always have peace of mind knowing that if PRTG doesn’t alert you, everything’s working as intended.
NetApp Alliance Partner since 2017
As a NetApp Alliance Partner, we provide you with a NetApp monitoring solution that lets you monitor your NetApp storage systems on multiple levels.
Benefit from strong support for and guaranteed compatibility with all your NetApp entities so that you can always keep an eye on the health, availability, and performance of your NetApp storage.

Start NetApp monitoring with PRTG and see how it can make your IT infrastructure more reliable and your job easier.
PRTG is compatible with all major vendors and manufacturers
![]()
IT experts agree: Paessler PRTG is a great solution for IT infrastructure monitoring

“All-around winning
network monitor”

“The real beauty of PRTG is the endless possibilities it offers”

“Outstanding cloud
monitoring”
Oliver Jähn, IT Manager at the University of Bonn![]()
“For us, PRTG Network Monitor is the most effective tool for monitoring our IT infrastructure in the long run.”
Create innovative solutions with Paessler’s partners
Partnering with innovative vendors, Paessler unleashes synergies to create
new and additional benefits for joined customers.


With ScriptRunner, Paessler integrates a powerful event automation platform into PRTG Network Monitor.
ScriptRunner
Start NetApp monitoring with PRTG and see how it can make your IT infrastructure more reliable and your job easier.
NetApp monitoring: FAQs
1. What is NetApp?
NetApp is a company that is specialized in hybrid cloud data services and data management. NetApp offers both data storage hardware and software solutions.
2. Which NetApp devices can I monitor with PRTG?
With Paessler PRTG, you can monitor NetApp storage systems like NetApp cDOT or ONTAP via SNMP, REST, or SOAP.
3. Which metrics can I monitor on my NetApp storage systems?
Paessler PRTG keeps track of the availability, the physical discs, the health, and the input and output operations of a NetApp storage system.
4. Can I also monitor NetApp cloud storage with PRTG?
Yes, you can if you use a NetApp ONTAP system. NetApp cloud solutions provide ONTAP in AWS, for example. With our preconfigured NetApp v2 sensors, you can query monitoring data directly from the ONTAP REST API so that it doesn’t matter if the storage itself is hosted in a cloud environment or on premises.
5. What is a monitoring tool?
Companies monitor their networks and applications to optimize their performance and proactively detect errors. To do this, they also use so-called network manager tools and network monitoring software.
The choice of monitoring products on the market is huge: solutions for open-source monitoring, such as Nagios or Zabbix, are free of charge. Products like PRTG are proprietary but offer a lot of advantages such as easier setup and maintenance, and extensive support.
6. Why do you need data management & monitoring solutions?
The volume of data has been rapidly increasing for years. The reasons for this are increasingly networked production and more complex infrastructures that produce more and more data. Control over company data is therefore becoming more difficult.
This presents companies with new challenges of how to use and manage their data efficiently. As the number of cyber-attacks is also growing, threats targeting data must be detected and defended against early on.
The visual representation of all data collected from your network therefore also provides answers to pressing IT security questions: Are there any anomalies in the network? Suspicious processes such as network traffic that is much too high can indicate an attack. Network monitoring solutions like PRTG help to uncover anomalies and can thus contribute to IT security.
7. What is a sensor in PRTG?
In PRTG, “sensors” are the basic monitoring elements. One sensor usually monitors one measured value in your network, for example the traffic of a switch port, the CPU load of a server, or the free space on a disk drive.
On average, you need about 5-10 sensors per device or one sensor per switch port.

PRTG: The multi-tool for sysadmins
Adapt PRTG individually and dynamically to your needs and rely on a strong API:- HTTP API: Access monitoring data and manipulate monitoring objects via HTTP requests
- Custom sensors: Create your own PRTG sensors for customized monitoring
- Custom notifications: Create your own notifications and send action triggers to external systems
- REST Custom sensor: Monitor almost everything that provides data in XML or JSON format
PRTG makes NetApp monitoring easy
Custom alerts and data visualization make it easy to monitor, identify, and prevent NetApp storage issues.
We asked: would you recommend PRTG?
Over 95% of our customers say yes!
Paessler AG conducted trials in over 600 IT departments worldwide to tune its network monitoring software closer to the needs of sysadmins.
The result of the survey: over 95% of the participants would recommend PRTG – or already have.

Still not convinced?
More than 500,000
sysadmins love PRTG
Paessler PRTG is used by companies of all sizes. Sysadmins love PRTG because it makes their job a whole lot easier.
Monitor your entire IT infrastructure
Bandwidth, servers, virtual environments, websites, VoIP services – PRTG keeps an eye on your entire network.
![]()
Start NetApp monitoring with PRTG and see how it can make your IT infrastructure more reliable and your job easier.
|
PRTG |
Network Monitoring Software - Version 24.2.94.1400 (April 10th, 2024) |
|
Hosting |
Download for Windows and cloud-based version PRTG Hosted Monitor available |
Languages |
English, German, Spanish, French, Portuguese, Dutch, Russian, Japanese, and Simplified Chinese |
Pricing |
Up to 100 sensors for free (Price List) |
Unified Monitoring |
Network devices, bandwidth, servers, applications, virtual environments, remote systems, IoT, and more |
Supported Vendors & Applications |
|
Combining the broad monitoring feature set of PRTG with IP Fabric’s automated network assurance creates a new level of network visibility and reliability.