![]()
Clear, convenient IBM monitoring
with PRTG

Monitor all your IBM devices
and servers with PRTG
Quick error detection
for better system health
You get alerted about problems
at an early stage
Works securely and reliably with IBM hard disks and servers
Company operations are highly dependent on a functional IT. When IBM hard disks and servers crash, work inevitably comes to a halt. With our IBM Monitoring, you can monitor several IBM devices and servers centrally and thereby minimize crashes and disturbances.
Four IBM sensors check the status of all logical and virtual disks as well as memory modules in IBM servers. You can also monitor the system health of IBM devices: fan performance, ambient and CPU temperature, humidity, voltage, and power supply status. By doing so, you'll ensure your IBM devices continue to deliver the performance your company needs.
Thanks to PRTG, the entire staff can work with peace of mind.
3 good reasons to choose PRTG as your IBM monitoring tool
![]()
Clarity
Get all IBM hard disks and servers at a glance and automatic alerts when threshold values are exceeded.
![]()
Security
Hard disks and memory are quick to report errors, whereby system health disturbances can be rapidly identified and remedied.
![]()
Performance
By spotting errors quickly, work process are interrupted less frequently and productivity soars.
Here's what Network Monitoring looks like in PRTG

The PRTG Sunburst View
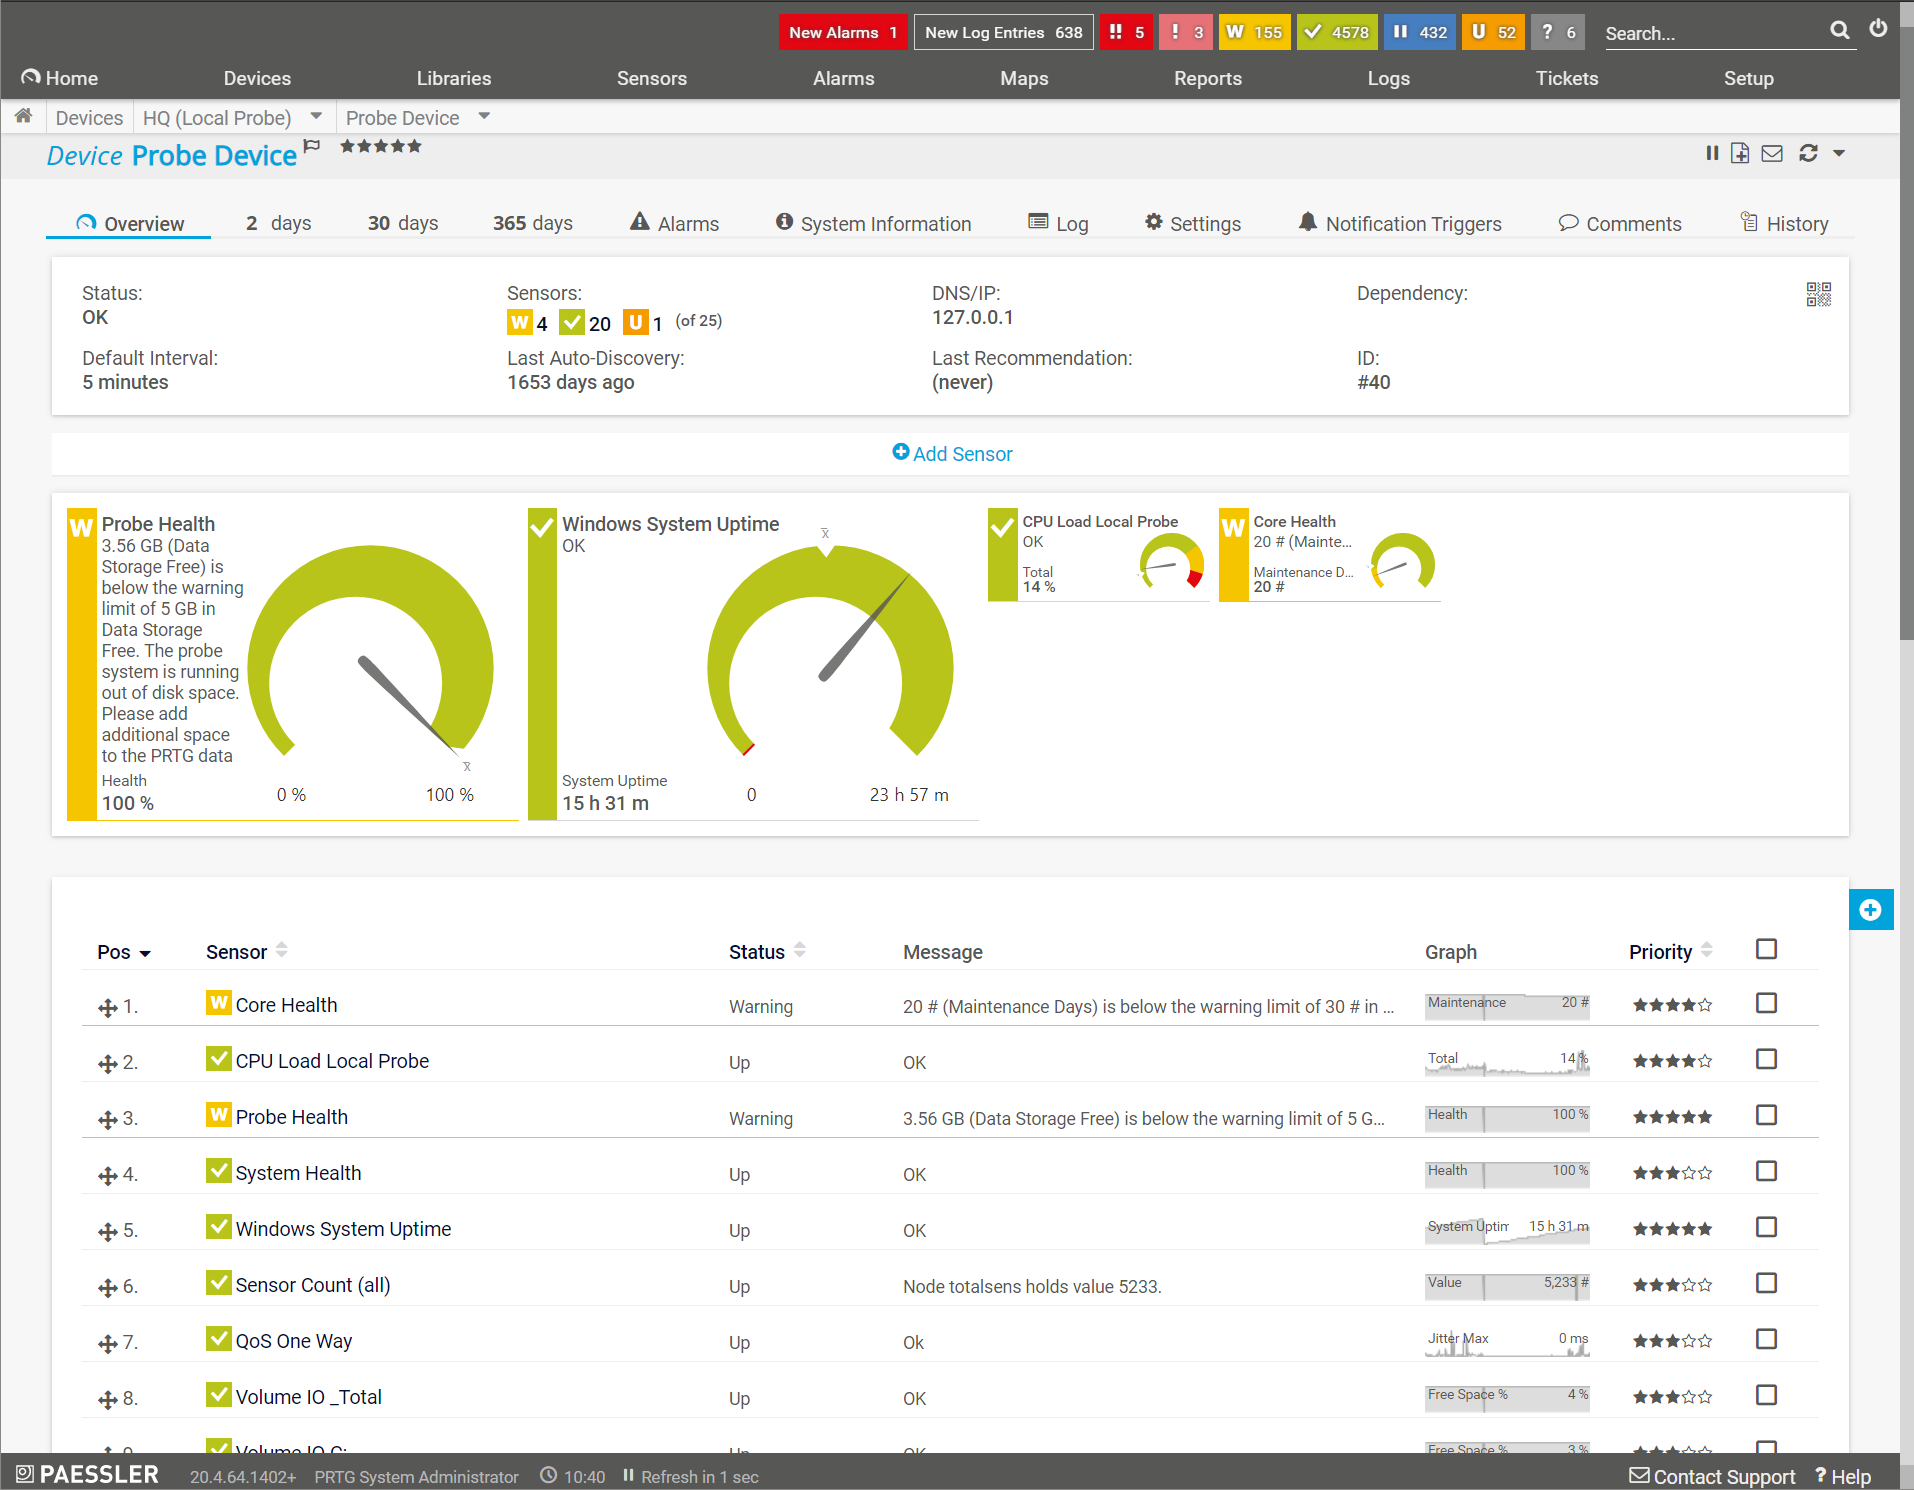
Your network and devices at a glance
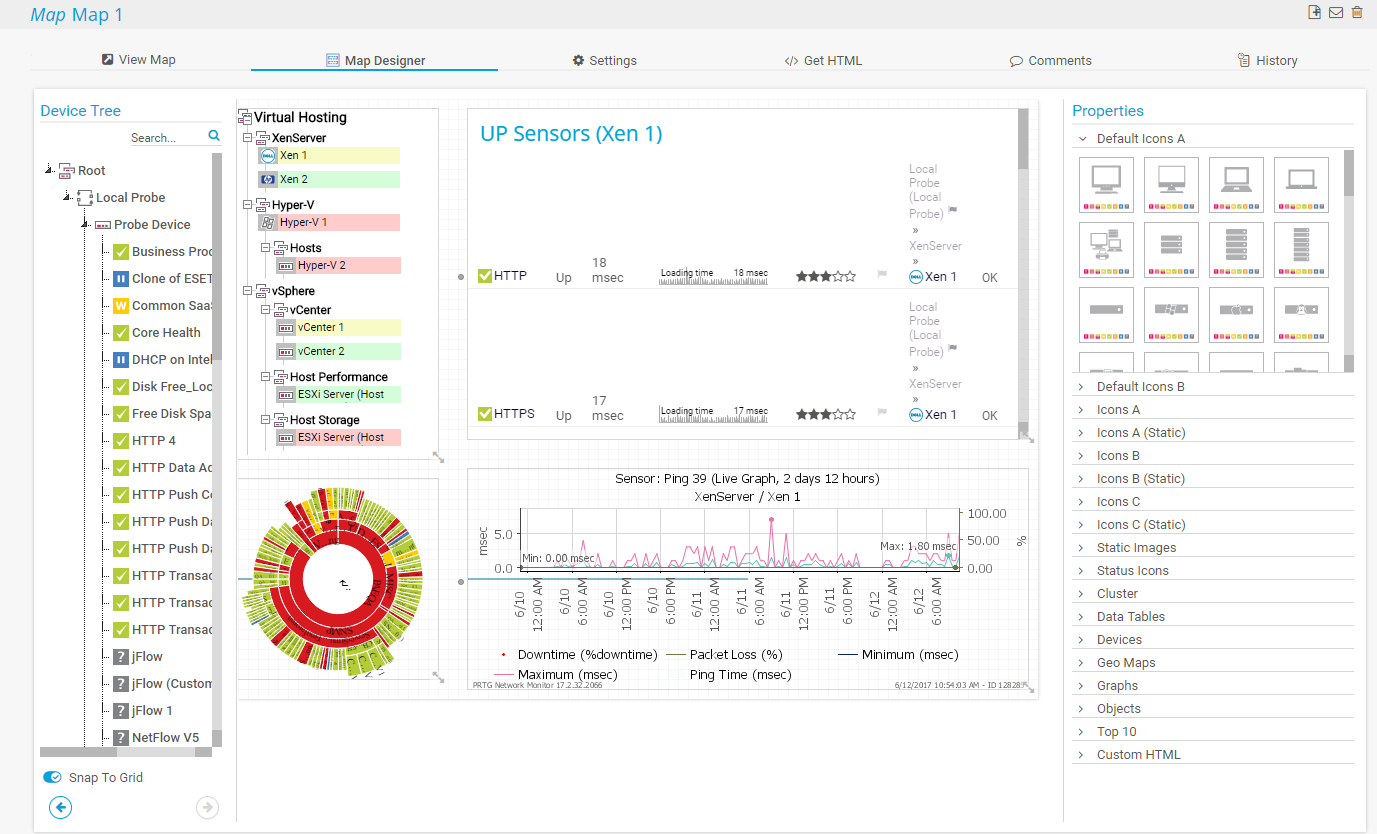
Create individual graphical maps
This is how Network and IBM Monitoring with PRTG works
IBM monitoring is based on the Simple Network Management Protocol (SNMP). The four IBM sensors use lookups to determine
the status values of one or more sensor channels. The possible status values are defined in a lookup file.
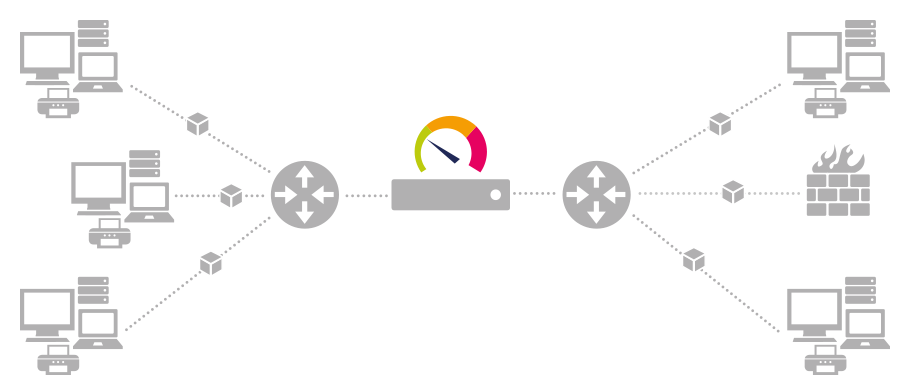
Network Monitoring via SNMP
PRTG makes your job easier
Our monitoring software frees you to focus on other tasks by promptly notifying you of potential issues.
![]()
Save effort
PRTG gives you one central monitoring tool for your servers and entire network. Enjoy a quick overview of your whole infrastructure via our dashboard and app.
![]()
Save time
Getting started with PRTG is a breeze. Setting up or switching from another network monitoring tool is easy thanks to the auto-discovery and pre-configured device templates.
![]()
Save money
80% of our customers report substantial cost savings with network monitoring. Your costs of licenses will likely pay for themselves within weeks.
Your IBM devices at a glance – even on the go
Set up PRTG in minutes and use it on almost any mobile device.


Markus Puke, Network Administrator, Schüchtermann Klinik, Germany![]()
“We can all work with greater peace of mind knowing
that our systems are constantly being monitored.”
Trusted by 500,000 users and recognized
by industry analysts as a leader

“Fantastic network and infrastructure monitoring solution that is easy to deploy and easier still to use. Simply the best available.”

“Software is absolutely perfect, Support is superior. Meets all needs and requirements, this is a must have solution if you are needing any form of monitoring.”

“The tool excels at its primary focus of being a unified infrastructure management and network monitoring service.”
What kind of data is gathered?
![]() How PRTG defines sensors
How PRTG defines sensors
In PRTG, “sensors” are the basic monitoring elements. One sensor usually monitors one measured value in your network, e.g. the traffic of a switch port, the CPU load of a server, the free space of a disk drive. On average you need about 5-10 sensors per device or one sensor per switch port.
Your IBM data is gathered by sensors in PRTG.
PRTG comes with more than 250 predefined sensors, which you can use immediately and without limitation. All of the IBM sensors you need to monitor your various IBM hardware are included.
These four IBM-specific sensors are already incorporated into PRTG:
- SNMP IBM System X Logical Disk Sensor
- SNMP IBM System X Physical Disk Sensor
- SNMP IBM System X Physical Memory Sensor
- SNMP IBM System X System Health Sensor
Of course, thanks to its powerful API, PRTG also provides you with every possibility to create your own personalized sensors so you can monitor absolutely anything you please.
Create innovative solutions with Paessler’s partners
Partnering with innovative vendors, Paessler unleashes synergies to create
new and additional benefits for joined customers.

With the combination of PRTG and Insys, the monitoring specialist Paessler and the industrial gateway manufacturer INSYS icom offer a practical possibility to merge IT and OT.
INSYS icom


Learn more about PRTG
Computer Monitoring: PRTG automatically collects all relevant data of your computers like CPU utilization, operating temperature, or memory usage. Be in control of your network computers and prevent costly outages.
Network Activity Monitoring: Keep an eye on your network usage and monitor your data centers, devices like printers or routers, your server availability, and your websites.
Fortinet Monitoring: Check the status of your Fortinet products and get alerts as soon as your Fortinet solution
identifies a security risk.
“Easy to implement and configure with good technical support.”
R. v. S., ICT Manager at Heinen & Hopman Eng BV

PRTG: The multi-tool for sysadmins
Adapt PRTG individually and dynamically to your needs and rely on a strong API:- HTTP API: Access monitoring data and manipulate monitoring objects via HTTP requests
- Custom sensors: Create your own PRTG sensors for customized monitoring
- Custom notifications: Create your own notifications and send action triggers to external systems
- REST Custom sensor: Monitor almost everything that provides data in XML or JSON format
Still not convinced?
![]()
More than 500,000 sysadmins love PRTG
Paessler PRTG is used by companies of all sizes. Sysadmins love PRTG because it makes their job a whole lot easier.
Still not convinced?
![]()
Monitor your entire IT infrastructure
Bandwidth, servers, virtual environments, websites, VoIP services – PRTG keeps an eye on your entire network.
![]()
Try Paessler PRTG for free
Everyone has different monitoring needs. That’s why we let you try PRTG for free. Start now with your trial.
|
PRTG |
Network Monitoring Software - Version 24.2.94.1400 (April 10th, 2024) |
|
Hosting |
Download for Windows and cloud-based version PRTG Hosted Monitor available |
Languages |
English, German, Spanish, French, Portuguese, Dutch, Russian, Japanese, and Simplified Chinese |
Pricing |
Up to 100 sensors for free (Price List) |
Unified Monitoring |
Network devices, bandwidth, servers, applications, virtual environments, remote systems, IoT, and more |
Supported Vendors & Applications |
|