![]()
From log file to file server monitoring:
PRTG keeps you in the know!

PRTG monitors
individual files
PRTG notifies you in the
event of changes to files
PRTG helps you
analyze file integrity
PRTG is a file monitoring tool for log file, syslog,
and event log monitoring
File monitoring with PRTG
Jump to the topic of your choice
- Log file monitoring: Good news for you – and your network
- Useful PRTG sensors
- With PRTG, your network is in good hands
- Start your free trial version of PRTG to get a quick feel for file monitoring
- File server monitoring ensures your file server runs like a dream
- Running out of disk space? This short video explains folder monitoring
- Windows file monitoring
- How to read and analyze MIB files with PRTG
Log file monitoring: Good news for you – and your network
![]()
The search is on
When an application fails or is faulty, error information is added to a log file. As a sysadmin, you’re bound to have asked yourself the following questions. How can I monitor changes to log files? Can I read their contents? Which files can I keep an eye on? For answers to these questions, look no further than PRTG. Learn all you need to know about file server monitoring here.
![]()
Get more done with PRTG
Our network monitoring software provides you with a round-the-clock overview. A dashboard displays all the goings-on of your network in real time. And in the event of downtime or malfunctions, PRTG notifies you at once. Example: An application returns errors and records these errors in a log file. PRTG will notify you as soon as a modification to this file takes place.
![]()
Add to your arsenal
For more in-depth file analyses – e.g. verifying file integrity and modifications to files in detail – you’re going to need some specialized security software. The same goes for file access checks. Sysadmins use a combination of PRTG and other software for these situations, including a special FIM (file integrity monitoring) tool. Check out this article from our knowledge base to learn more.
Useful PRTG sensors
![]() How PRTG defines sensors
How PRTG defines sensors
In PRTG, “sensors” are the basic monitoring elements. One sensor usually monitors one measured value in your network, e.g. the traffic of a switch port, the CPU load of a server, the free space of a disk drive. On average you need about 5-10 sensors per device or one sensor per switch port.
Every application creates different log files. But thanks to the following sensors, you can keep an eye on them all:
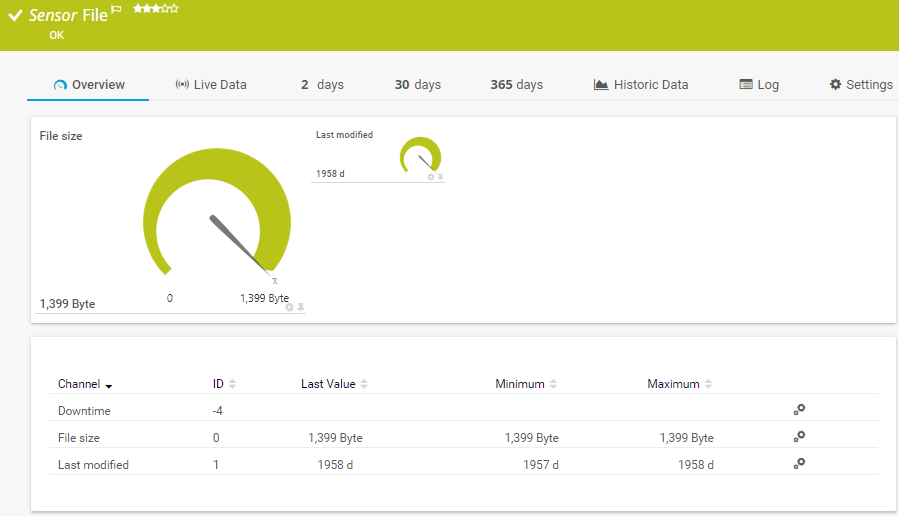
File Sensor
The File Sensor lets you see if a certain file is available, as well as the last time it was modified. It shows you when the file was accessed, its size, and if its contents have been modified.
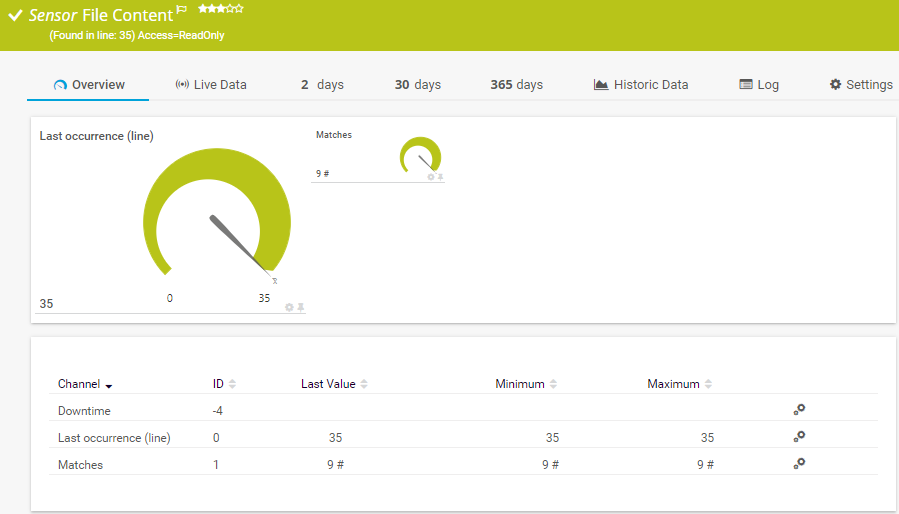
File Content Sensor
With the File Content Sensor, you can monitor whether certain words (such as “error” or “failed”) have been written to a file.
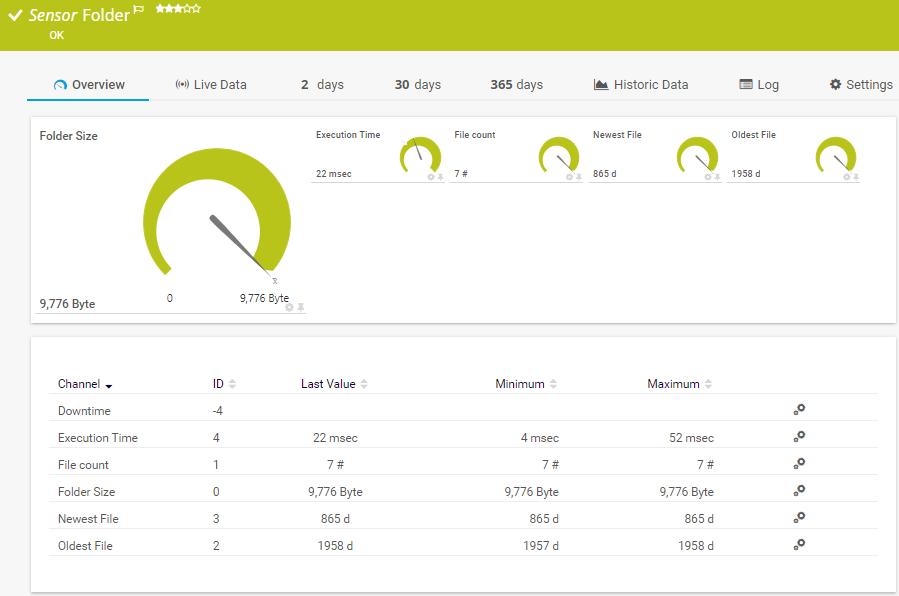
Folder Sensor
Among other things, the Folder Sensor monitors the number of files on a computer and whether new files have been added, and displays the amount of time since the last file changes took place.
More PRTG sensors
PRTG comes with over 250 preconfigured sensors, including several file sensors. It even lets you create your own custom sensors for a truly personalized monitoring experience.
With PRTG, your network is in good hands
![]()
Worry less
All sysadmins worry about their hardware or software malfunctioning – or completely crashing their networks. Thanks to PRTG, you can put these worries to rest. In the event of the slightest problem, the PRTG alarm feature will immediately send you an alert. No alert = everything is fine.
![]()
Simplify your work
Still trying to make do with several bush-league monitoring tools? It’s time to throw them out with that rusty old server rack! PRTG is a centralized monitoring tool for your entire network. PRTG monitoring makes your day-to-day work all the easier.
![]()
Quick turnaround times
PRTG comes with the technical expertise of a dedicated international team. All support inquiries are answered within 24 hours on weekdays. You can also find the answers to thousands of previously asked questions in the PRTG knowledge base. You’ll therefore spend less time monitoring and more time working.
Start your free trial version of PRTG to get a quick feel for file monitoring
With 100 sensors, you can monitor around 10 devices. You get free access to all PRTG sensors and functions – for as long as you like. Try our network and file monitoring tool risk-free before deciding which license best suits your needs.

Practical tip: Hey Stephan, how can I monitor files whose names change?
Log files like to add their creation date or time stamp to their file names. The standard version of PRTG can only monitor files with fixed names and does not support placeholders. We therefore recommend using a PowerShell script with a user-defined sensor to monitor files whose names change. Have a look at the following knowledge base article to find out how. This article also contains a script that is available for immediate use with the EXE/Script Advanced Sensor, and which allows for placeholders for the name of the destination file.
Stephan Linke works in the Paessler AG Technical Support Department
File server monitoring ensures your file server runs like a dream
![]()
File server
File servers are present in any company with a professional IT infrastructure. These servers contain the file system and all relevant files. A central storage device allows employees to access files from any device. Teams can work on files simultaneously. If the file server malfunctions, support tickets start to pile up at once.
![]()
PRTG to the rescue
With PRTG, you never lose control of your file server. Among other things, PRTG lets you monitor your CPU, RAM, and hard drive. It provides you with a constant overview of the capacity of your file server. PRTG allows you to take quick action before the server has a chance to overload. It also shows you if spikes occur at certain times of the day, enabling you to promptly take appropriate preventive measures.
![]()
Keep an eye on your server
The forte of PRTG is server monitoring. As we see it, behind every stable IT infrastructure lies smooth-running hardware. Learn more about topics such as server performance monitoring, web server monitoring, FTP monitoring, and NAS monitoring. Thanks to the PRTG dashboard, you can keep a constant eye on all your servers.
Trusted by 500,000 users and recognized
by industry analysts as a leader

“Fantastic network and infrastructure monitoring solution that is easy to deploy and easier still to use. Simply the best available.”

“Software is absolutely perfect, Support is superior. Meets all needs and requirements, this is a must have solution if you are needing any form of monitoring.”

“The tool excels at its primary focus of being a unified infrastructure management and network monitoring service.”
Windows file monitoring
![]()
Windows monitoring
PRTG is a Windows-based monitoring tool. The software incorporates Windows technologies such as WMI by way of various preconfigured sensors, such as the WMI File Sensor. PRTG also offers access to Windows performance counters, as well as SNMP, which puts significantly less strain on your system.
![]()
Event log monitoring
The PRTG Event Log (Windows API) sensor analyzes default event log data such as system and application protocols. Find out more about setting up effective log monitoring with PRTG.
How to read and analyze MIB files with PRTG
![]()
MIB files contain information that allows you to manage and monitor network devices. PRTG lets you read and analyze MIB files and incorporate their data into your monitoring. The SNMP Library Sensor is used for this purpose. Find out more about our free MIB Importer and MIB Browser.
Keep a constant eye on your network – even while on the go
Set up PRTG in minutes and use it on almost any mobile device.


Other topics of interest
Website monitoring – for a site that runs like clockwork
PRTG monitors the availability, accessibility, load times, and processes of your website. Tip: The HTTP Content Sensor is useful for testing logins and measuring traffic. Find out why PRTG is the website monitoring tool for you.
Quality of service – say goodbye to choppy connections
Many companies use VoIP and video conferencing. But these services are continually subject to transmission failures. PRTG lets you monitor QoS and the quality of your VoIP. PRTG quickly notifies you before video transmission issues arise – even if your coworkers work remotely.
Ping monitoring
PRTG ping monitoring lets you check the availability of all your devices. The dashboard updates the status of your network in real time. During installation, PRTG pings your IP address range and automatically sets up initial monitoring for all available devices. Now that's convenience!
PRTG is a vital tool for getting your IT into tip-top shape!
The costs for a one-year PRTG license pay for themselves in an average of only a few of weeks.
License costs vary according to the size of your network.
PRTG makes your network more reliable
PRTG saves network management costs
PRTG saves time spent on network management
“Easy to implement and configure with good technical support.”
R. v. S., ICT Manager at Heinen & Hopman Eng BV
Create innovative solutions with Paessler’s partners
Partnering with innovative vendors, Paessler unleashes synergies to create
new and additional benefits for joined customers.

Combining their tools to a powerful solution for advanced analysis and automation, KnowledgeRiver and Paessler enable IT teams to ensure best performance for their infrastructure and networks.
KnowledgeRiver
With ScriptRunner, Paessler integrates a powerful event automation platform into PRTG Network Monitor.
ScriptRunner
We asked: would you recommend PRTG?
Over 95% of our customers say yes!
Paessler AG conducted trials in over 600 IT departments worldwide to tune its network monitoring software closer to the needs of sysadmins.
The result of the survey: over 95% of the participants would recommend PRTG – or already have.


PRTG: The multi-tool for sysadmins
Adapt PRTG individually and dynamically to your needs and rely on a strong API:- HTTP API: Access monitoring data and manipulate monitoring objects via HTTP requests
- Custom sensors: Create your own PRTG sensors for customized monitoring
- Custom notifications: Create your own notifications and send action triggers to external systems
- REST Custom sensor: Monitor almost everything that provides data in XML or JSON format
Still not convinced?
![]()
More than 500,000 sysadmins love PRTG
Paessler PRTG is used by companies of all sizes. Sysadmins love PRTG because it makes their job a whole lot easier.
Still not convinced?
![]()
Monitor your entire IT infrastructure
Bandwidth, servers, virtual environments, websites, VoIP services – PRTG keeps an eye on your entire network.
![]()
Try Paessler PRTG for free
Everyone has different monitoring needs. That’s why we let you try PRTG for free. Start now with your trial.
|
PRTG |
Network Monitoring Software - Version 24.2.94.1400 (April 10th, 2024) |
|
Hosting |
Download for Windows and cloud-based version PRTG Hosted Monitor available |
Languages |
English, German, Spanish, French, Portuguese, Dutch, Russian, Japanese, and Simplified Chinese |
Pricing |
Up to 100 sensors for free (Price List) |
Unified Monitoring |
Network devices, bandwidth, servers, applications, virtual environments, remote systems, IoT, and more |
Supported Vendors & Applications |
|
Combining the broad monitoring feature set of PRTG with IP Fabric’s automated network assurance creates a new level of network visibility and reliability.