![]()
Control network traffic monitoring
What is it, and how can it help?

PRTG is scalable software that adapts to your network
PRTG meets the individual needs of your company
PRTG is user-friendly and installed in no time
PRTG provides a comprehensive overview of your network
PRTG makes network traffic monitoring easy
Control network traffic monitoring
In order for a company to be successful, data traffic must flow smoothly through its network and its IT must run error-free. For IT teams, the task is clear: they need to keep a constant eye on their entire network and all the devices therein, immediately assessing values such as data usage and load peaks.
With the right monitoring software, sysadmins can promptly identify bandwidth hogs and effectively measure and monitor the traffic in their network.
What is network traffic, and how does network monitoring work?
The term “network traffic” refers to all the data traffic that is routed through a network. Since the amount of data at companies grows exponentially, IT teams are often faced with significant challenges when it comes to monitoring network traffic.
In addition, IT infrastructures and networks are becoming more and more complex. This makes it extremely difficult to keep track of all the components in the network, such as:
To meet these challenges, many companies rely on network monitoring tools.
The main goals of monitoring solutions:
- Keep networks operational
- Reduce downtime
- Optimize availability
- Improve quality of service
- Safeguard companies from security threats
Monitoring tools measure and monitor network traffic. By analyzing data traffic, they make it possible to identify overloads. Monitoring tools generate precise diagnoses that allow IT teams to get to the root of performance problems and maintain productivity.
What are the benefits of network monitoring?
![]()
Comprehensive overview
Which devices are using the most data? Sysadmins need a detailed overview of network activity to answer this question.
![]()
Round-the-clock availability
A network monitoring tool promptly sounds the alarm when something goes wrong in the network (e.g., an overloaded device), allowing sysadmins to take action at once. This improves the availability of the network and optimizes reliability.
![]()
Protection against security threats
Monitoring tools don’t just measure performance. They also notify IT teams of suspicious activity that can put their company at risk. For example, if data traffic is unusually high, this could be due to a DDoS attack or a hacked device. The resulting spike in service requests can cause the server or network to crash. A monitoring tool can therefore help you safeguard data and prevent financial losses.
![]()
Network and data usage optimization
Overloaded bandwidth leads to backed-up traffic, forcing data packets to wait in a queue. As a result, delays occur in the network – often bringing communication to a standstill.
But when IT teams continuously measure traffic, they're able to control and manage the bandwidth consumption of connections and applications. In other words, they optimize the usage of data. This increases both employee and customer productivity. It also helps keep costs to a minimum.
A sneak peek at network monitoring in PRTG
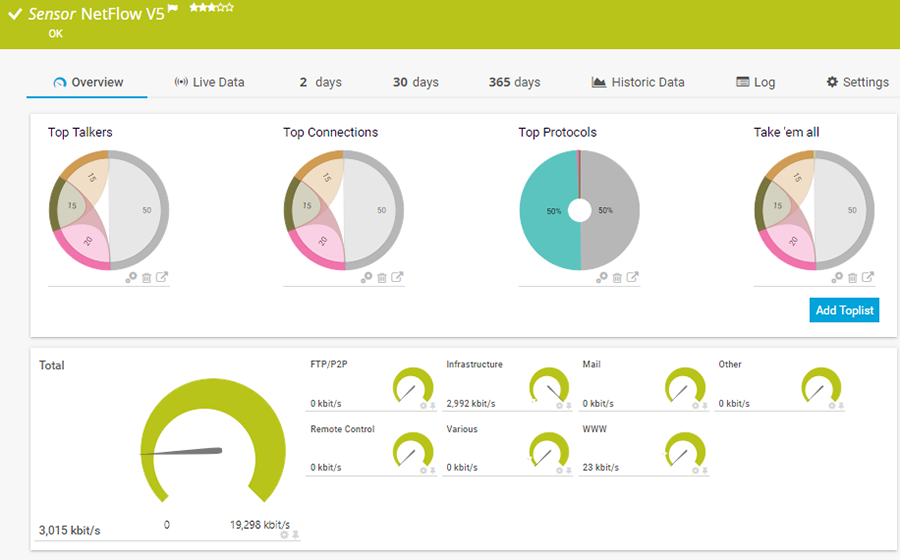
Overview of NetFlow traffic
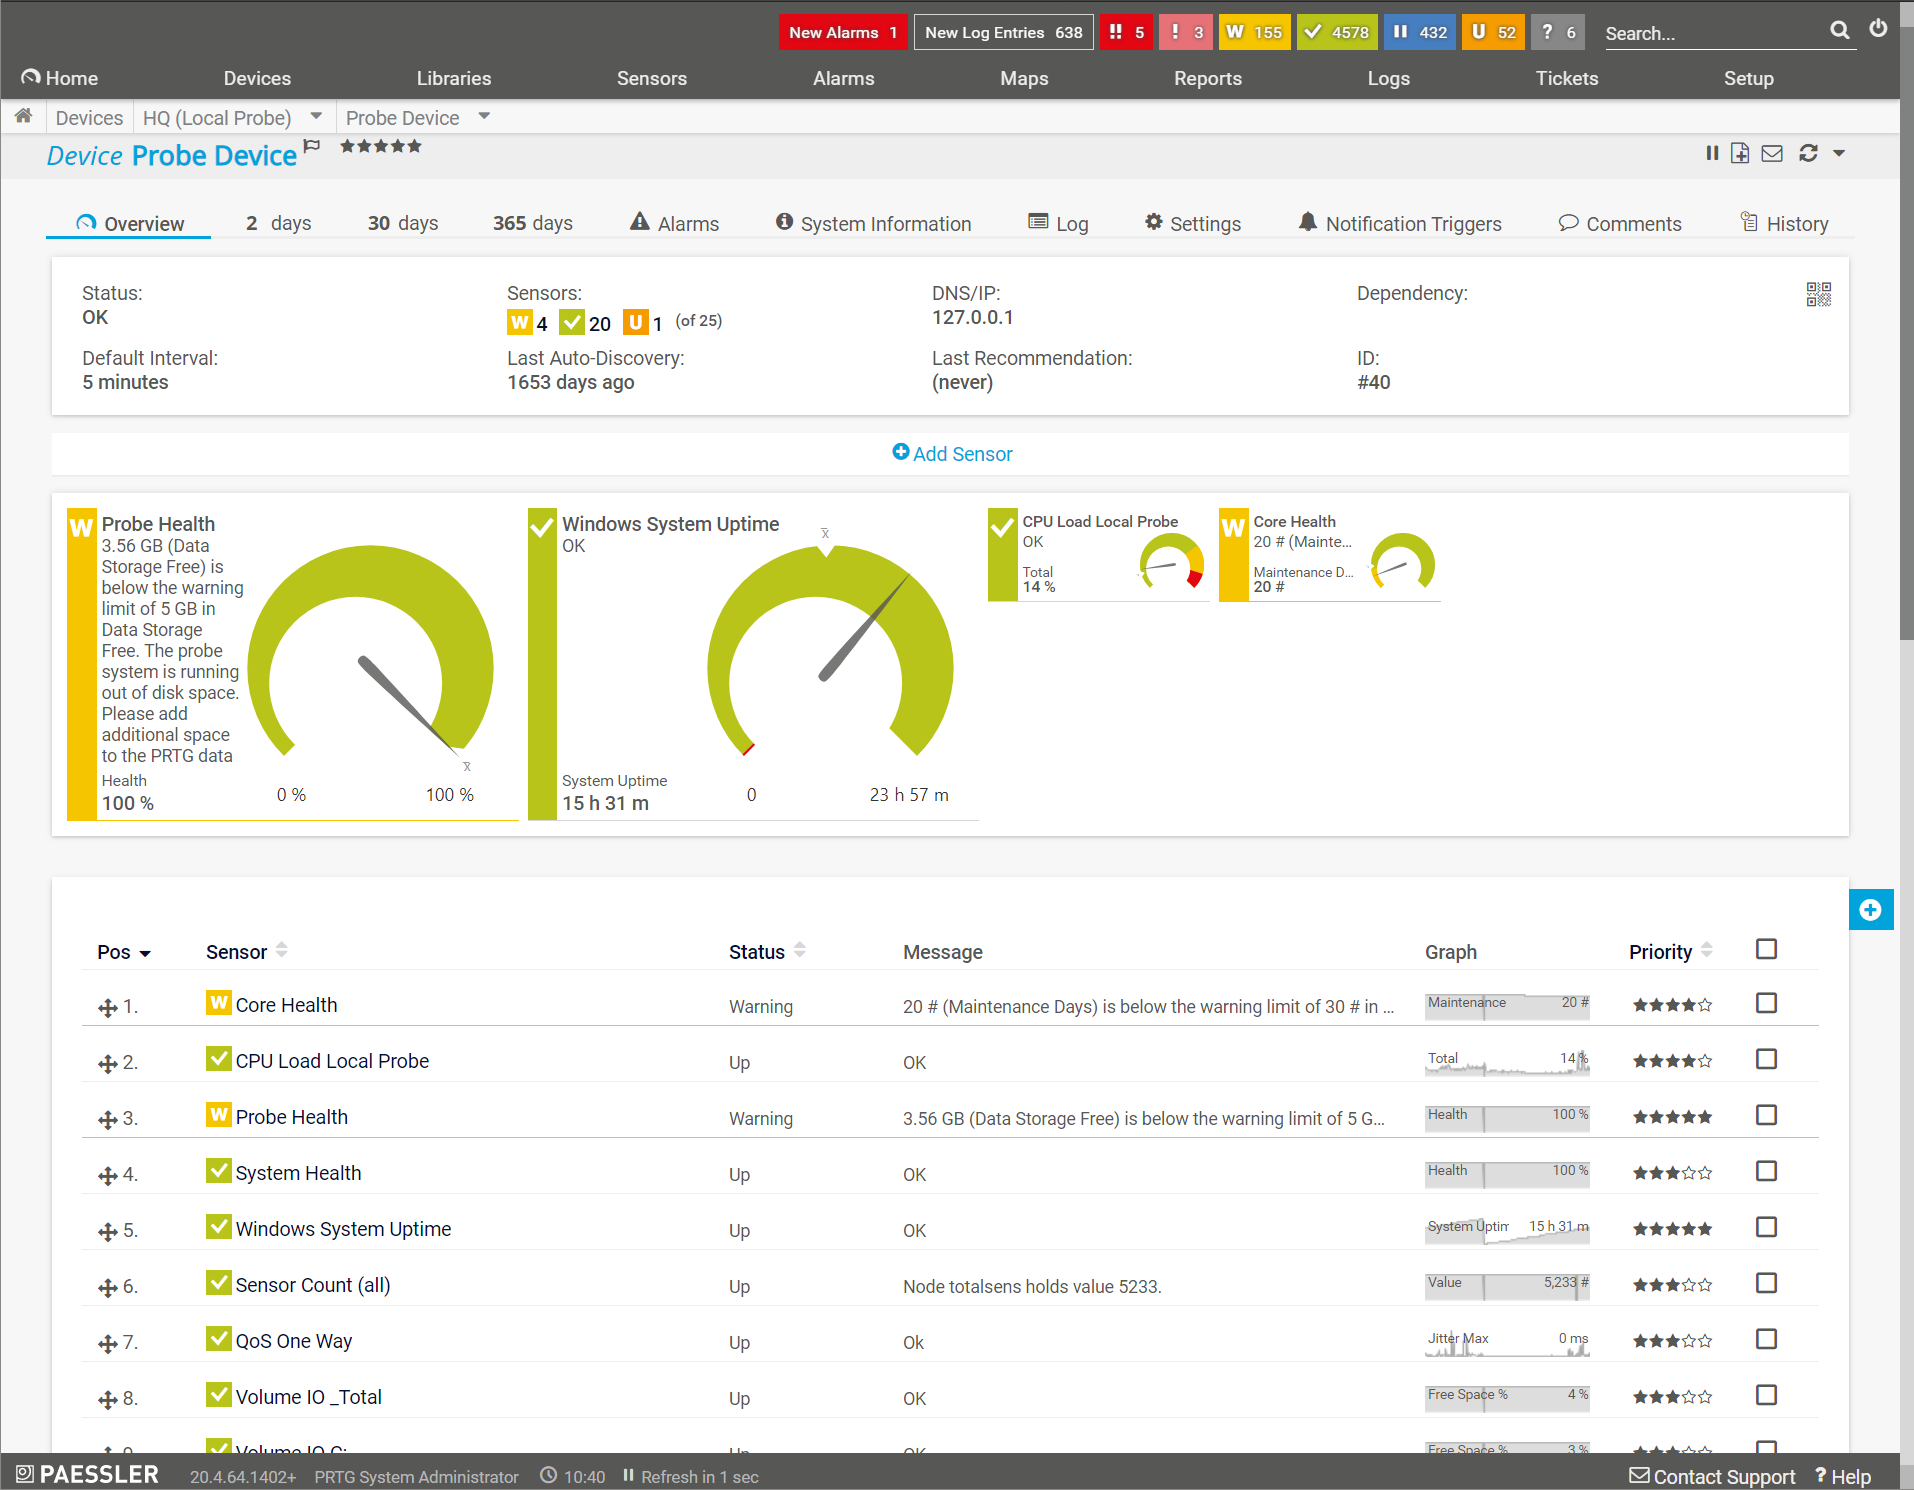
Overview of SNMP traffic
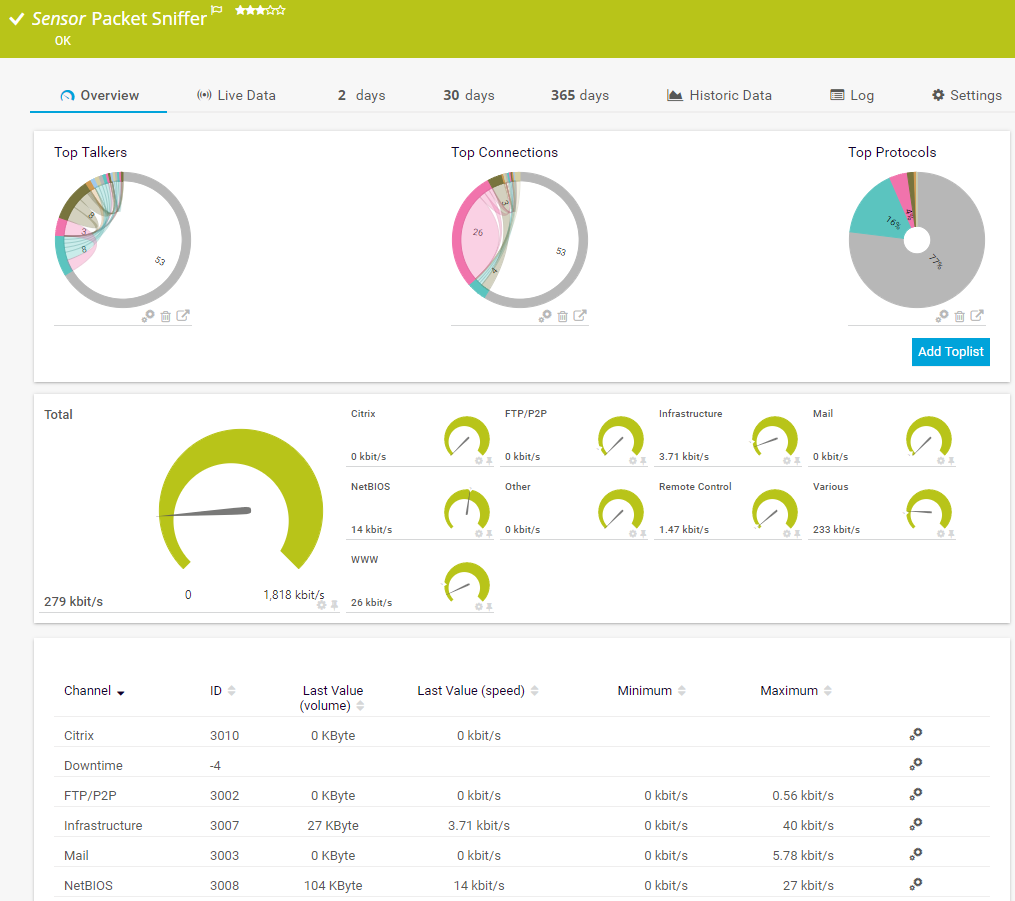
Packet Sniffer Sensor
Which functions and features should I look for in a network analysis and monitoring tool?
![]() Bandwidth is measured as the amount of data that can be transferred from one point to another within a network in a specific amount of time. Typically, bandwidth is expressed as a bitrate and measured in bits per second (bps). It refers to the transmission capacity of a connection and is an important factor when determining the quality and speed of a network.
Bandwidth is measured as the amount of data that can be transferred from one point to another within a network in a specific amount of time. Typically, bandwidth is expressed as a bitrate and measured in bits per second (bps). It refers to the transmission capacity of a connection and is an important factor when determining the quality and speed of a network.
Read more
When shopping for a network monitoring tool, we recommend paying close attention to the following considerations:
Is it scalable?
The tool should provide for comprehensive monitoring – regardless of the size, structure, and configuration of the network. Ideally, the tool will be able to monitor multiple standalone networks or networks in different locations. As a result, make sure you choose a tool that can be scaled both horizontally and vertically.
Is it customizable?
Thresholds should be configured individually and meet the specific needs of your company. Fixed thresholds lead to too many false alarms. If your IT team can customize the thresholds for each individual device, they’ll be able to categorize and prioritize the notifications they receive.
Is it intuitive?
The tool should be extremely easy to set up and use. A user-friendly tool will allow your IT team to immediately get the hang of the interface. This saves precious time and keeps stress to a minimum. Tip: high-quality technical support can tip the scale when choosing between two tools.
Can the tool be used to test bandwidth?
A good monitoring tool not only monitors and measures bandwidth, but can also test for maximum bandwidth without crashing the network. Such tests are an important part of bandwidth management. In particular, they can help you sniff out the devices and applications that consume the most bandwidth.
Your network monitoring at a glance
Set up PRTG in minutes and use it on almost any mobile device.


How do I monitor network traffic with PRTG?
PRTG Network Monitor monitors countless different network components, including hardware, operating systems, applications, virtual environments, mail servers, databases, and websites.
Monitoring network traffic with PRTG is quick and easy:
Step 1
The sysadmin installs PRTG Network Monitor. The process is intuitive and takes around 10 minutes.
Step 2
During the initial setup, PRTG scans the network for devices. It automatically incorporates these devices into the monitoring environment, and creates sensors to monitor them (if desired). A sensor is a component that monitors one or more fixed values.
Step 3
If necessary, the sysadmin adds more sensors. For example, a sensor for monitoring bandwidth consumption at a specific interface (e.g., a network card) via WMI.
Step 4
The sysadmin defines the conditions for the network traffic monitoring. These can involve the targeted monitoring of incidents such as malfunctioning devices, congested ports, or disks nearing saturation.
Step 5
If a sensor determines that a threshold value has been exceeded, the sysadmin automatically receives a notification. This alert can be sent in various different ways, including:
- Email, SMS, or push notification to an Android or iOS phone
- Jingle (alarm)
- syslog message or entry in the Windows Event Log
![]() How PRTG defines sensors
How PRTG defines sensors
In PRTG, “sensors” are the basic monitoring elements. One sensor usually monitors one measured value in your network, e.g. the traffic of a switch port, the CPU load of a server, the free space of a disk drive. On average you need about 5-10 sensors per device or one sensor per switch port.
Finally, PRTG is extremely intuitive thanks to a centralized dashboard that displays the status of the network and all current alarms, thereby giving sysadmins complete control over their network traffic.
Network failures are nothing to scoff at: they can disrupt everyday business operations, lead to financial losses, and even damage a company’s reputation. Proactive troubleshooting and quick error removal are therefore crucial. A network monitoring tool like PRTG can help you stay on top of the game.

“The greatest advantage of PRTG? You get to rest easy.“
Steffen Ille, Bauhaus-University of Weimar, Germany
Trusted by 500,000 users and recognized
by industry analysts as a leader

“Fantastic network and infrastructure monitoring solution that is easy to deploy and easier still to use. Simply the best available.”

“Software is absolutely perfect, Support is superior. Meets all needs and requirements, this is a must have solution if you are needing any form of monitoring.”

“The tool excels at its primary focus of being a unified infrastructure management and network monitoring service.”
PRTG makes your job easier
Our monitoring software frees you to focus on other tasks by promptly notifying you of potential issues.
![]()
Save effort
PRTG gives you one central monitoring tool for your servers and entire network. Enjoy a quick overview of your whole infrastructure via our dashboard and app.
![]()
Save time
Getting started with PRTG is a breeze. Setting up or switching from another network monitoring tool is easy thanks to the auto-discovery and pre-configured device templates.
![]()
Save money
80% of our customers report substantial cost savings with network monitoring. Your costs of licenses will likely pay for themselves within weeks.

PRTG: The multi-tool for sysadmins
Adapt PRTG individually and dynamically to your needs and rely on a strong API:- HTTP API: Access monitoring data and manipulate monitoring objects via HTTP requests
- Custom sensors: Create your own PRTG sensors for customized monitoring
- Custom notifications: Create your own notifications and send action triggers to external systems
- REST Custom sensor: Monitor almost everything that provides data in XML or JSON format
Still not convinced?
![]()
More than 500,000 sysadmins love PRTG
Paessler PRTG is used by companies of all sizes. Sysadmins love PRTG because it makes their job a whole lot easier.
Still not convinced?
![]()
Monitor your entire IT infrastructure
Bandwidth, servers, virtual environments, websites, VoIP services – PRTG keeps an eye on your entire network.
![]()
Try Paessler PRTG for free
Everyone has different monitoring needs. That’s why we let you try PRTG for free. Start now with your trial.
|
PRTG |
Network Monitoring Software - Version 24.2.94.1400 (April 10th, 2024) |
|
Hosting |
Download for Windows and cloud-based version PRTG Hosted Monitor available |
Languages |
English, German, Spanish, French, Portuguese, Dutch, Russian, Japanese, and Simplified Chinese |
Pricing |
Up to 100 sensors for free (Price List) |
Unified Monitoring |
Network devices, bandwidth, servers, applications, virtual environments, remote systems, IoT, and more |
Supported Vendors & Applications |
|