![]()
REST API monitoring with PRTG
Read up to 50 values per sensor

PRTG monitors the availability of RESTful APIs
PRTG displays values from XML and JSON files
PRTG displays up to 50 parameters per sensor
HTTP requests: choose between GET and POST
An important building block for IoT monitoring
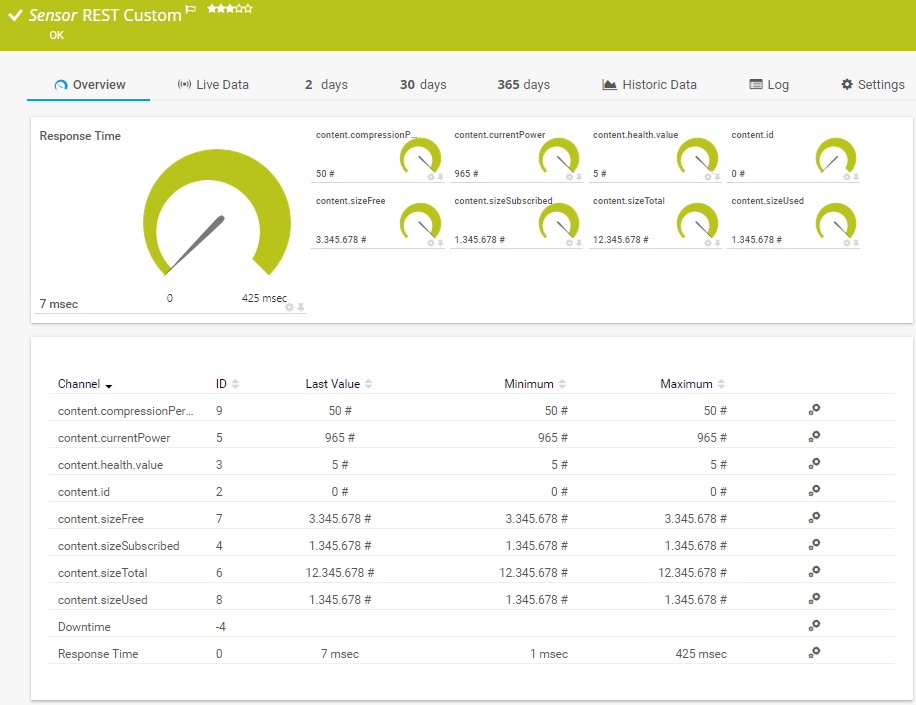
REST API monitoring: One PRTG sensor to help you get started
The REST Custom sensor...
- Monitors REST API availability
- Recognizes the content of XML and JSON files automatically
- Analyzes up to 50 parameters per sensor
- Creates suitable channels for values automatically
- Creates individual REST configuration templates
- Custom JSON and XML mapping
![]() How PRTG defines sensors
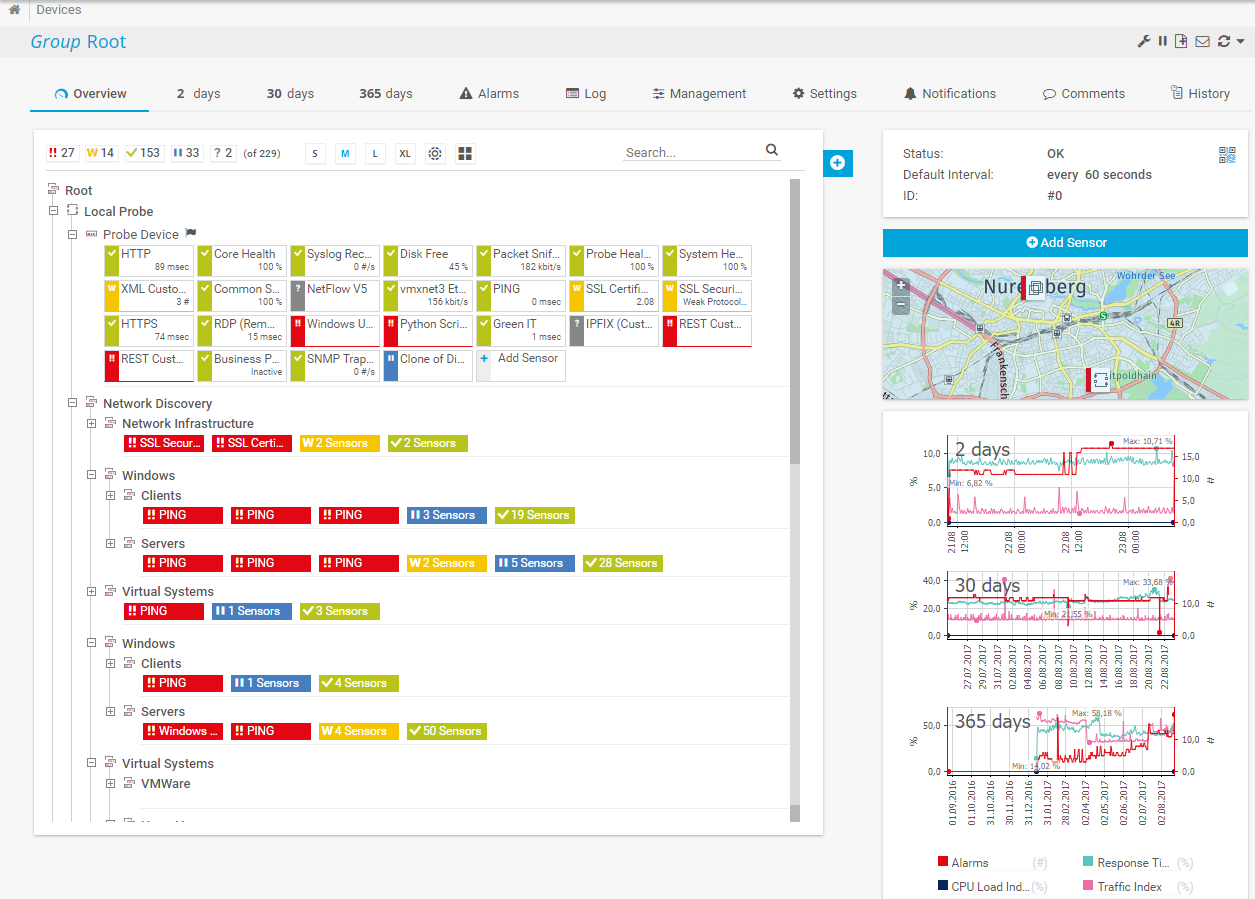
How PRTG defines sensors
In PRTG, “sensors” are the basic monitoring elements. One sensor usually monitors one measured value in your network, e.g. the traffic of a switch port, the CPU load of a server, the free space of a disk drive. On average you need about 5-10 sensors per device or one sensor per switch port.
Three steps for setting up the sensor
![]()
Install PRTG
(the first 100 sensors are free)
![]()
Add the
REST Custom Sensor
![]()
Search for values automatically or select a custom REST configuration
template
![]()
Launch REST Custom Sensor

You’ve already got PRTG, but are missing the REST Custom Sensor?
The REST Custom sensor is available in PRTG versions 17.3.33 and higher. If you are not using the current version of PRTG, then you may not have access to this sensor. In this case, perform a PRTG update. During the maintenance period, you can download all updates for free.
![]() REST is an architecture style definition applied to networked applications. It exists as a series of constraints applied to the implementation of network components, enabling uniform interface semantics, rather than application-specific implementations and syntax.
REST is an architecture style definition applied to networked applications. It exists as a series of constraints applied to the implementation of network components, enabling uniform interface semantics, rather than application-specific implementations and syntax.
Read more
Trusted by 500,000 users and recognized
by industry analysts as a leader
“Fantastic network and infrastructure monitoring solution that is easy to deploy and easier still to use. Simply the best available.” “Software is absolutely perfect, Support is superior. Meets all needs and requirements, this is a must have solution if you are needing any form of monitoring.” “The tool excels at its primary focus of being a unified infrastructure management and network monitoring service.”


Keep a constant eye on your network – even while on the go
Set up PRTG in minutes and use it on almost any mobile device.


Practical tip: Hey Christian, do you see any potential in REST API monitoring?
“The Internet of Things will completely change the way we monitor our networks. Systems, machines, devices – if everything is connected, then the functionality of these demanding network architectures will have to be monitored professionally. A REST API monitoring software will play an important role in this process.”
Christian Zeh, Senior Technology Manager at Paessler AG.
REST API monitoring: Why PRTG is the right tool for you
![]()
A quick overview
The PRTG dashboard displays the values that are obtained from your REST API monitoring, while XML and JSON file parameters are analyzed and displayed in the sensor. You therefore get a quick overview – whether it be on a desktop, smartphone, or tablet.
![]()
Sustainable
Many manufacturers configure their devices with RESTful APIs. These APIs can serve as a substitute for SNMP. They are mainly used by web applications to supply data. If you’re a system administrator, then you’ll need a network monitoring tool with a variety of different technologies. Many manufacturers offer REST APIs in the fast-growing area of the “Internet of Things” to make monitoring data (i.e. from machines) accessible.
![]() SNMP stands for Simple Network Management Protocol. Its usefulness in network administration comes from the fact that it allows information to be collected about network-connected devices in a standardized way across a large variety of hardware and software types. SNMP is a protocol for management information transfer in networks, for use in LANs especially, depending on the chosen version.
SNMP stands for Simple Network Management Protocol. Its usefulness in network administration comes from the fact that it allows information to be collected about network-connected devices in a standardized way across a large variety of hardware and software types. SNMP is a protocol for management information transfer in networks, for use in LANs especially, depending on the chosen version.
Read more
![]()
Built-in alarm
PRTG comes with an alarm system that will alert you of downtime and malfunctions. This alarm is customizable and free of charge. In the event of downtime or errors in the values stemming from your REST API, you’ll be notified immediately.
![]()
All-round solution
PRTG is the perfect tool for monitoring your entire network. With PRTG, you get a centralized software package that monitors all your hardware, software, traffic, and applications. And you can finally say goodbye to stand-alone solutions which are both cumbersome and prone to error.
![]()
Custom licenses
Get started with the free trial version of PRTG. It comes with 100 sensors and the full range of PRTG features. This version never expires. Should you need more sensors, you can upgrade by choosing the license that works best for you. Our licenses and prices.
The monitoring of the future: PRTG lets you monitor complex IT infrastructures
Industry 4.0: Bosch-Rexroth
Bosch Rexroth AG converted its Lohr am Main and Erbach sites to Industry 4.0, thereby increasing efficiency considerably. During the conversion, the company’s ordering and ERP systems were linked to its production control system and manufacturing. To ensure the smooth operation of its new, complex IT infrastructure, the company used PRTG Network Monitor software.
To the case study (German)
![]()
Distributed networks: BAUER
The BAUER Group is a supplier of services, machines, and products for soil and groundwater, with a worldwide network of over 110 subsidiaries. Each BAUER branch has a variety of IT systems and devices. “Upon taking a closer look, it was clear that only one tool could meet our stringent selection criteria: the PRTG Network Monitor developed by Paessler AG from Nuremberg,” declares Tobias Gebauer, System Administrator at the BAUER Group.
To the case study (German)

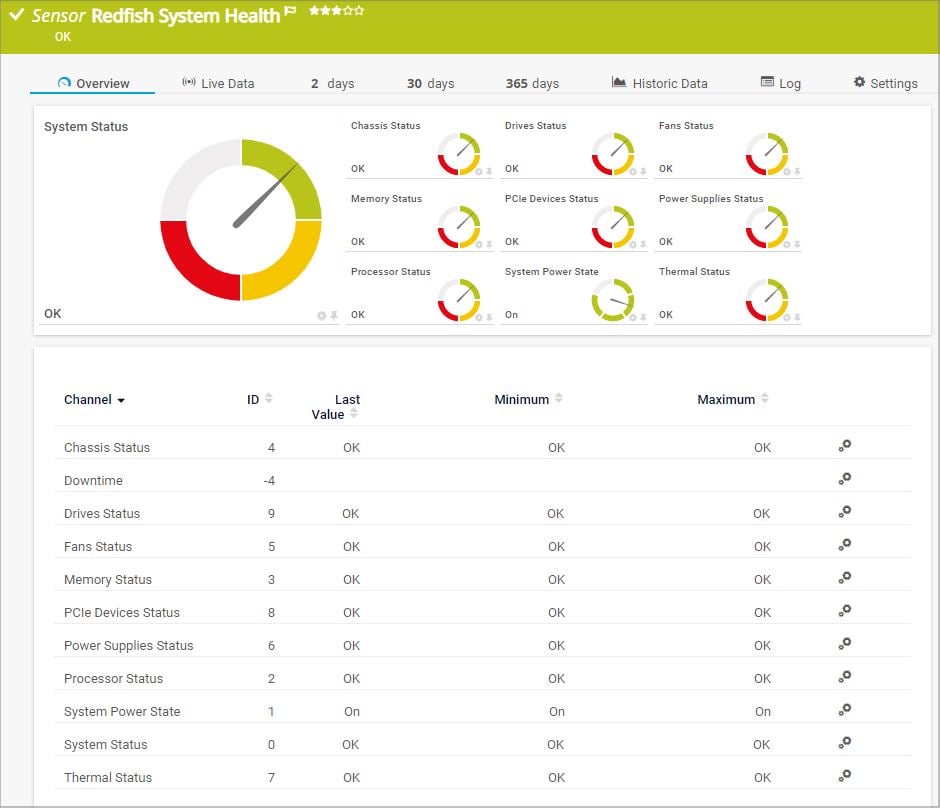
The new Redfish System Health sensor
Also interesting:
With PRTG 21.3.70, we will release our first Redfish sensor.
Redfish System Health sensor
With Redfish sensors, you can monitor server hardware in the datacenter using the Redfish protocol from the servers' management controllers like Lenovo XClarity, HPE iLO, or Dell iDrac. Redfish is the successor of IPMI and provides better security.
The Redfish System Health sensor monitors the overall system status and the status of various components such as power supplies or PCIe devices, if available.
“Easy to implement and configure with good technical support.”
R. v. S., ICT Manager at Heinen & Hopman Eng BV
Definitions: REST, API, RESTful API
You can find detailed definitions of REST and RESTful API on websites such as Wikipedia. We’ve provided summaries of these definitions below:
API
API stands for “application programming interface.” It is an interface that can be used to access the information of a program, operating system, or framework, and then exchange this information in a standardized manner. Communication takes place via the defined interface. PRTG also has its own API. System administrators can use this API to modularize PRTG and customize the software to meet their own specific needs.
REST
REST stands for “representational state transfer.” It is a programming paradigm that is mostly used online. REST is an alternative to SOAP (Simple Object Access Protocol). Its architecture is significantly more modern and generates lighter loads. Another advantage of REST: a large part of the infrastructure, including web servers, HTML-compatible clients, and XML parsers, is already available on the World Wide Web.
REST and HTTP
To communicate with RESTful APIs, an HTTP or HTTPS request is sent to a certain target, e.g. a web address. This communication occurs by way of GET and POST. GET has read-access to resources. With POST, data can be sent along with the request.
RESTful API
Many web environments, websites, and web services use RESTful APIs. These programming interfaces are based on REST. HTTP requests placed via a REST or RESTful API return XML and JSON files, which can then be selected to monitor desired values, for example.
REST and RESTful
REST stands for the architectural style or programming paradigm. Web services or websites are “RESTful” when they use or implement REST.
Redfish
Redfish was developed in 2014 as a replacement for IPMI. It is a network standard and application programming interface (API) for the management of servers, networks, storage devices, facilities equipment, and other converged infrastructure (CI) components in software-defined hybrid IT environments like web-scale data centers and cloud infrastructure. Read more about Redfish here.
![]()
“We can all work with greater peace of mind knowing
that our systems are constantly being monitored.”
Markus Puke, Network Administrator, Schüchtermann Klinik, Germany
Create innovative solutions with Paessler’s partners
Partnering with innovative vendors, Paessler unleashes synergies to create
new and additional benefits for joined customers.


With ScriptRunner, Paessler integrates a powerful event automation platform into PRTG Network Monitor.
ScriptRunner
We asked: would you recommend PRTG?
Over 95% of our customers say yes!
Paessler AG conducted trials in over 600 IT departments worldwide to tune its network monitoring software closer to the needs of sysadmins.
The result of the survey: over 95% of the participants would recommend PRTG – or already have.

Learn more about us here
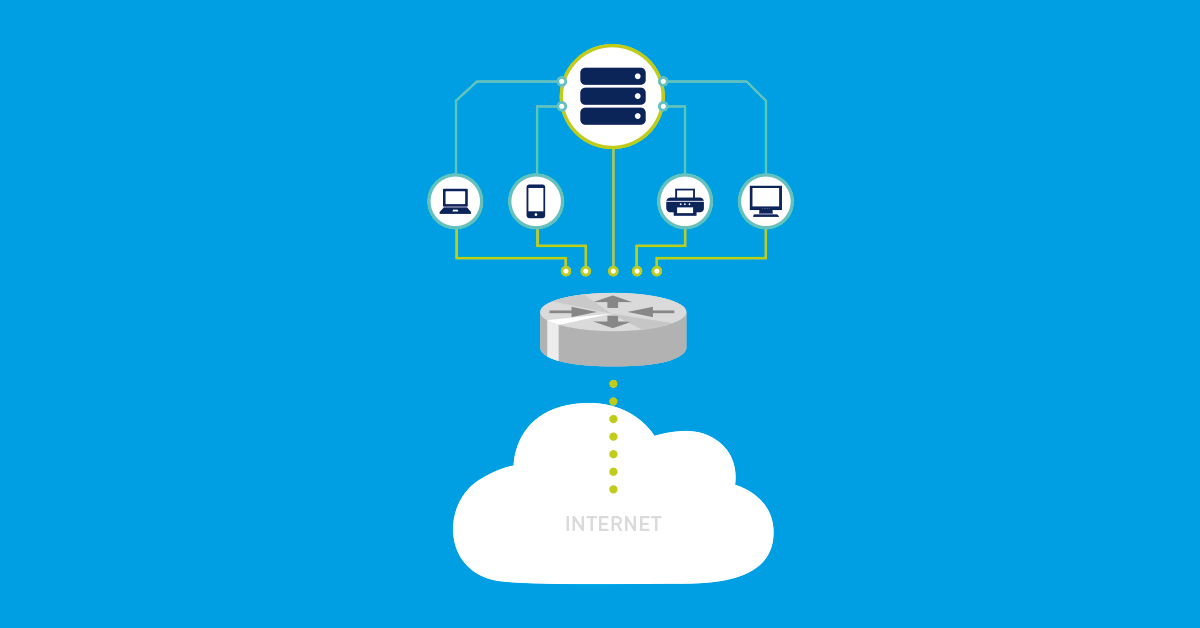
SNMP monitoring
Find out which hardware and software is putting a strain on your network’s bandwidth. Thanks to SNMP monitoring with PRTG, you'll maintain a constant overview of your network. PRTG comes with several preconfigured SNMP sensors. As a result, your network monitoring is ready to go in no time.
Server monitoring
Whether you’re dealing with a mail, database, or web server like IIS: PRTG server monitoring lets you keep an eye on all the key values concerning the availability and performance of your servers in real time. With PRTG, you will increase the stability of your IT infrastructure.

Website monitoring
PRTG monitors the availability, load times, and processes of your website. Its built-in alarm function promptly notifies you in the event of downtime or malfunctions. Thanks to website monitoring, you will ensure your online presence is as secure as ever.
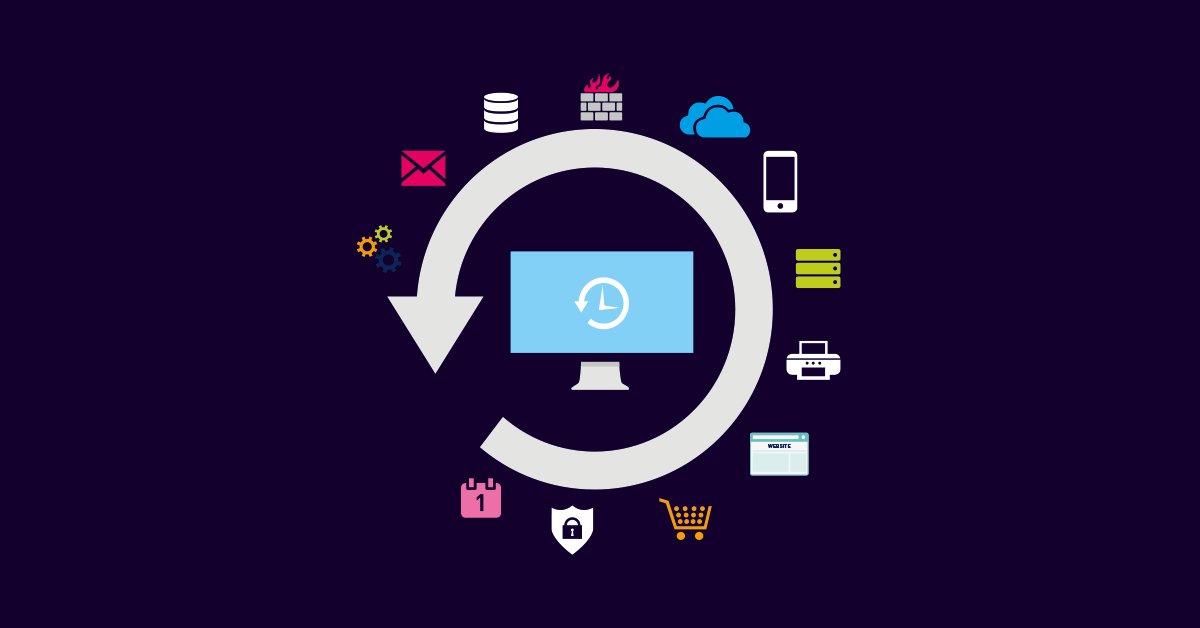
Backup monitoring
PRTG secures cloud and online backups, operating system backups and virtual machines like VMware oder Hyper-V. In case of incorrect backups, you get automatically notified.

PRTG: The multi-tool for sysadmins
Adapt PRTG individually and dynamically to your needs and rely on a strong API:- HTTP API: Access monitoring data and manipulate monitoring objects via HTTP requests
- Custom sensors: Create your own PRTG sensors for customized monitoring
- Custom notifications: Create your own notifications and send action triggers to external systems
- REST Custom sensor: Monitor almost everything that provides data in XML or JSON format
PRTG makes your job easier
Our monitoring software frees you to focus on other tasks by promptly notifying you of potential issues.
![]()
Save effort
PRTG gives you one central monitoring tool for your servers and entire network. Enjoy a quick overview of your whole infrastructure via our dashboard and app.
![]()
Save time
Getting started with PRTG is a breeze. Setting up or switching from another network monitoring tool is easy thanks to the auto-discovery and pre-configured device templates.
![]()
Save money
80% of our customers report substantial cost savings with network monitoring. Your costs of licenses will likely pay for themselves within weeks.
Still not convinced?
![]()
More than 500,000 sysadmins love PRTG
Paessler PRTG is used by companies of all sizes. Sysadmins love PRTG because it makes their job a whole lot easier.
Still not convinced?
![]()
Monitor your entire IT infrastructure
Bandwidth, servers, virtual environments, websites, VoIP services – PRTG keeps an eye on your entire network.
![]()
Try Paessler PRTG for free
Everyone has different monitoring needs. That’s why we let you try PRTG for free. Start now with your trial.
|
PRTG |
Network Monitoring Software - Version 24.2.94.1400 (April 10th, 2024) |
|
Hosting |
Download for Windows and cloud-based version PRTG Hosted Monitor available |
Languages |
English, German, Spanish, French, Portuguese, Dutch, Russian, Japanese, and Simplified Chinese |
Pricing |
Up to 100 sensors for free (Price List) |
Unified Monitoring |
Network devices, bandwidth, servers, applications, virtual environments, remote systems, IoT, and more |
Supported Vendors & Applications |
|

Combining the broad monitoring feature set of PRTG with IP Fabric’s automated network assurance creates a new level of network visibility and reliability.