I would like to have detailed instructions on how to use Cisco's recently implemented NetFlow 9 in ASA 5500 security and firewall appliances.
How do I monitor Cisco ASA firewalls using NetFlow 9 and PRTG?
Votes:
1
1 Reply
Votes:
2
This article applies as of PRTG 22
Monitoring Cisco ASA firewalls with PRTG using NetFlow v9
Some time ago, Cisco implemented NetFlow v9 for its popular ASA 5500 security and firewall appliances. This implementation of NetFlow is quite different from what other Cisco devices provide. It is called Netflow Security Event Logging (NSEL) and was originally introduced on the Cisco ASA 5580. Now, with the latest firmware (ASA 8.2.x or later), it has also been extended to other Cisco ASA models.
In fact, ASA NetFlow was never intended to be used for real-time or live traffic analysis. On the Cisco forums web page, the official statement is:
"[...] NetFlow on the ASA does not provide the ability to see this data in realtime. The data can be collected after the flow has been terminated and analyzed but we do not support real time viewing of the NetFlow records. [...] The total bytes transferred can only be seen after the flow is torn down. [...] Lastly, all flows on the ASA are bidirectional. All counters for a flow will increase for traffic flowing from A->B or B->A. [...] NetFlow has a significant performance impact."
Nevertheless, the in-depth traffic information PRTG gets from the ASA using this technology is very useful.
Bandwidth monitoring using ASA NetFlow export and PRTG
You can analyze NetFlow v9 data from ASA since PRTG 7.2. Follow these steps:
Step 1: Configure the ASA
The data to be exported is defined by a service policy that brings flow data to the analyzer server. The following code works fine if your ASA still uses the default global policy (replace x.x.x.x with the IP address of your PRTG installation and yy with the desired UDP port number):
policy-map global_policy
class class-default
flow-export event-type all destination x.x.x.x yy
If you are using the ASDM GUI, go to Configuration-Firewall | Service Policy Rules and click Add | Use class-default as the traffic class | Next | Netflow (tab) | Add (check the collectors you want to use) | Finish | Apply.
For NSEL, see the Networks Training article Cisco ASA NetFlow Support – NetFlow Security Event Logging – NSEL.
Step 2: Set up a NetFlow v9 sensor in PRTG
- In PRTG, navigate to the probe that will receive the NetFlow data packets (this is usually the local probe), click Add Sensor, and select NetFlow v9 from the list of available sensor types.
- Click Next.
- In section NetFlow v9 Specific Settings, enter the UDP port (yy from the code above) and select the IP address (x.x.x.x from the code above). Set Active Flow Timeout to zero (0).
Step 3: NetFlow monitoring of the ASA is online
That is all. Note that it may take a few minutes before you can see results in the graphs.
What you should know about ASA monitoring using NetFlow v9
Keep the following in mind:
- You will not see the data 100% live: NSEL monitoring only sends a NetFlow data packet after a connection no longer exists. If a connection has been active for minutes or hours, the ASA sends one NetFlow packet with the total of the connection. This causes peaks in the graphs in PRTG.
- Flows on the ASA are bidirectional (all counters for a flow will increase for traffic flowing in and out)
- If you only need traffic in and traffic out, use SNMP Traffic sensors on your ASA.
- NetFlow v9 monitoring on the ASA comes at a price: CPU load. For most ASAs with low to medium traffic, this will not be an issue. But if your ASA is already showing considerable CPU load, think twice before using NetFlow.
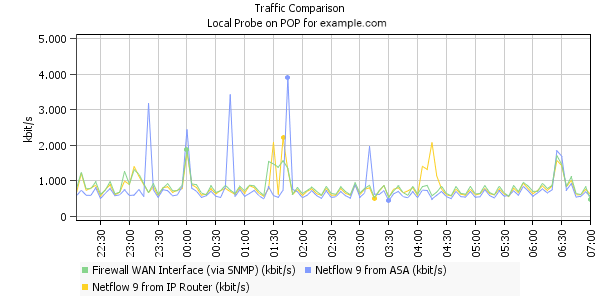
Look at the sample graph above. It shows the traffic through an ASA device that is measured using three different techniques:
- Via SNMP: Measuring the traffic on the "WAN" port of the ASA
- Via NetFlow v9: Analyzing NetFlow v9 packets of the next Cisco router upstream
- Via NetFlow v9: Analyzing NetFlow v9 from the ASA itself
You can see that curves for "true" NetFlow v9 from the router (yellow) and for SNMP (green) are quite close to each other. The blue line for the ASA NetFlow tends to stay below the others and every now and then it shows huge peaks. This always happens when a long-running connection no longer exists and its complete bandwidth usage is shown in one peak. When you take the total (the "integral" of all three lines), the differences are marginal.
More
- Paessler Blog: Monitoring Cisco ASA Firewalls using Netflow v9 and PRTG
Created on Feb 26, 2010 11:51:16 AM by
Daniel Zobel [Product Manager]
Last change on Jun 19, 2023 2:30:55 PM by
Fruzsina Ébelle [Paessler Support]

Add comment