Maps & Dashboards
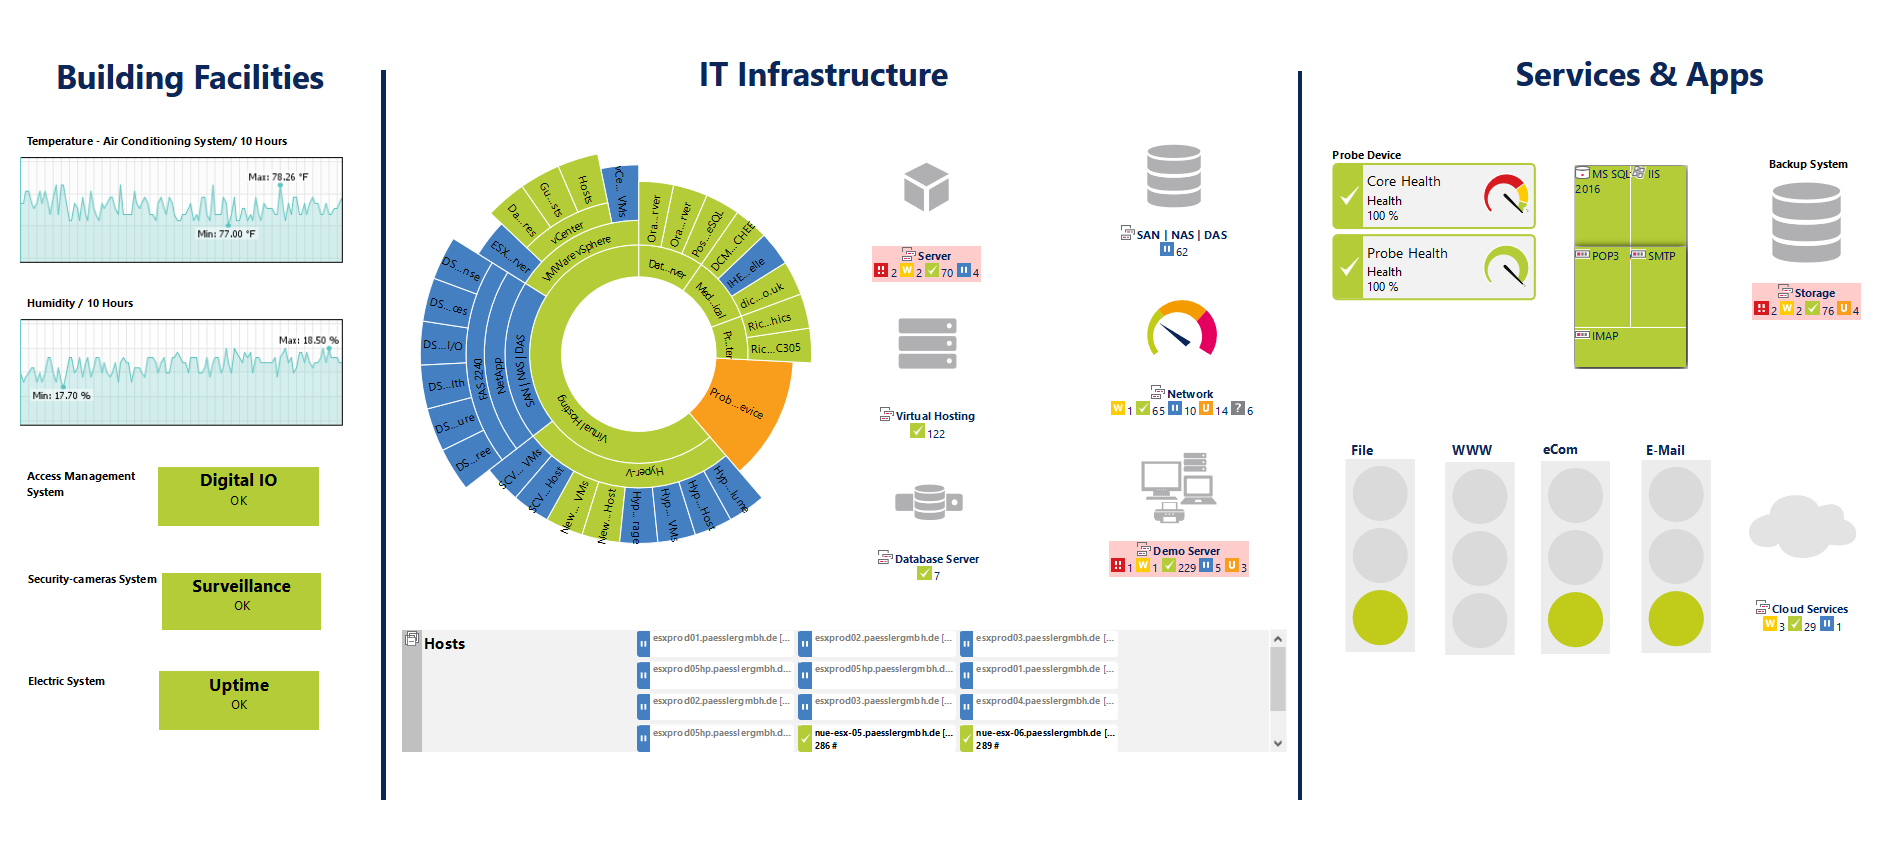
Real-time overview with live status information
Easy to create
Build maps with the integrated drag & drop editor
Customizable
Use custom HTML to create your own map objects
Easy to share
Publish maps for private or public access
Visualize your entire IT infrastructure
in one customizable dashboard
![]()
Stay informed
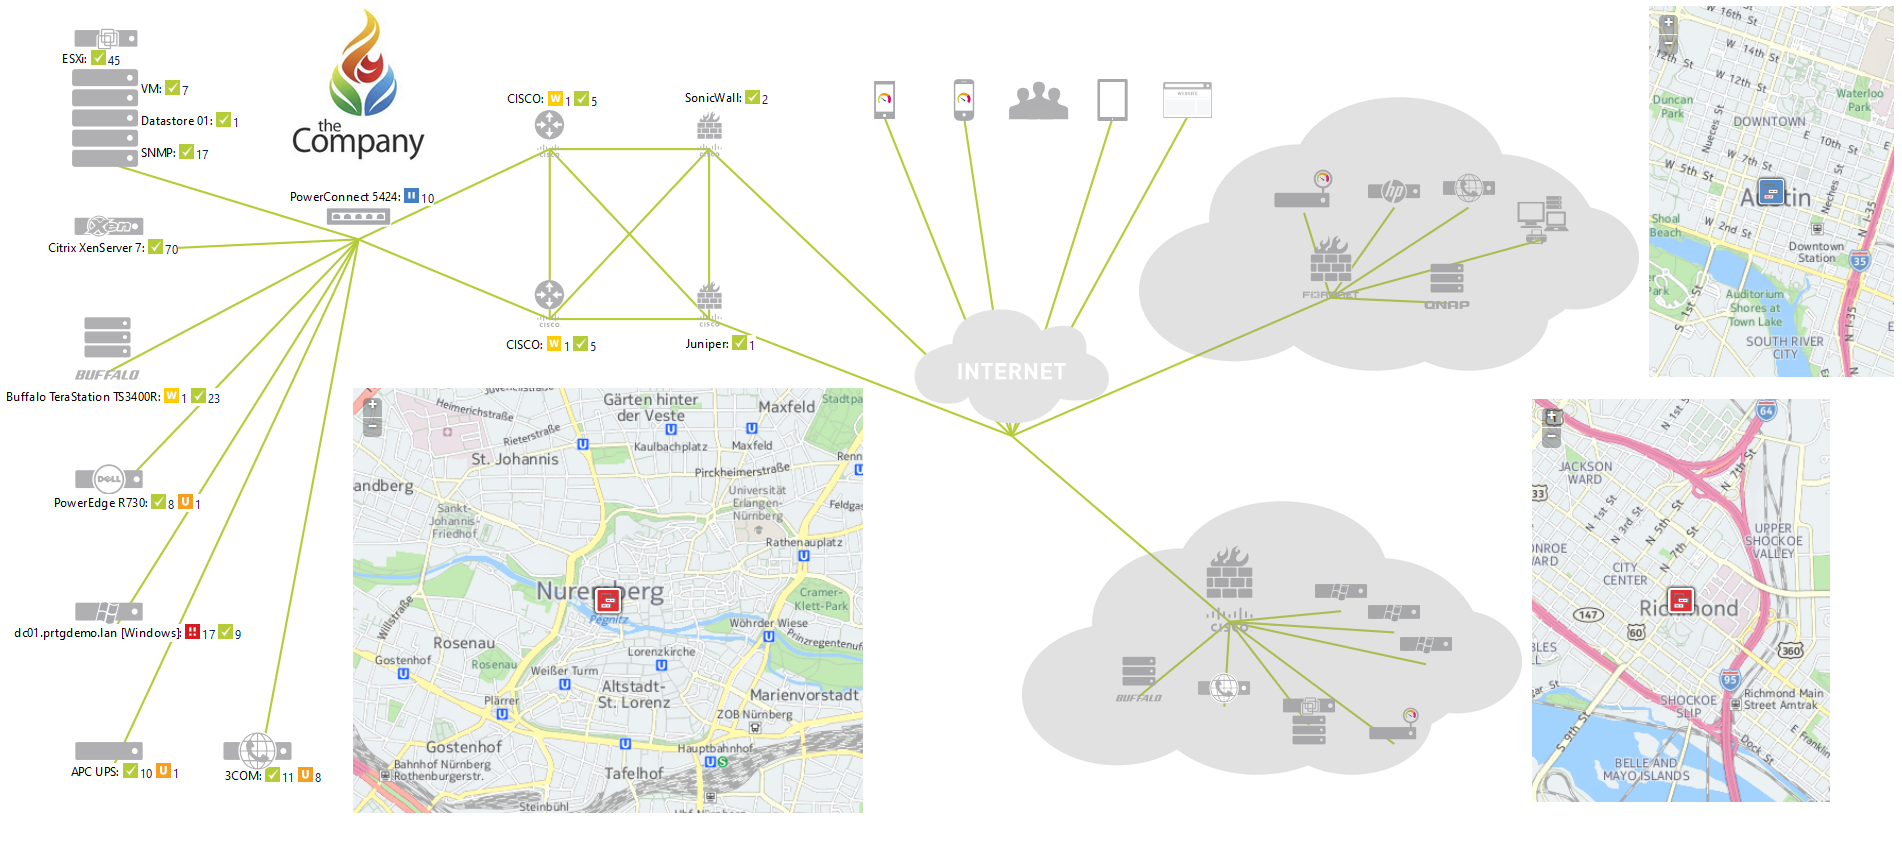
Maps in PRTG show not only devices and connections, but also deliver information on their status. Detect problems in one glance and troubleshoot effectively, using maps as a primary source of information.
To stay on track with the global status of your network, include Geo Maps to receive information live from anywhere around the world. Have your different maps rotate on one page and keep your eye on everything.
![]()
The Map editor
Using the simple 'drag & drop' built-in map editor, all components monitored by PRTG can be integrated quickly and easily into clear network maps. By using custom HTML, multi-layer maps can be generated making it possible to drill-down through multiple layers.
Even adding external images or applets to your maps is no problem. This way, you can customize your maps just the way you want. You can even include weather or traffic information.
![]()
How to share
Each map has a unique URL which you can use to link to the map.
Users who want to access the map will need an account in your PRTG installation. Alternatively they can access a public URL of the map if you allow the Public Access feature. Public maps contain a unique Map ID access key in the URL to block unwanted visitors.
Another great and easy way to show your maps directly inside other web pages is via IFRAME.
Basic Maps Tutorial
Watch this tutorial and learn how to set up a map within PRTG. To start with your map, use the icons that represent the different devices, groups and sensors in your network and its connections. Soon you'll have a perfect overview of each components' status within your network - all on one slide!
Screenshots
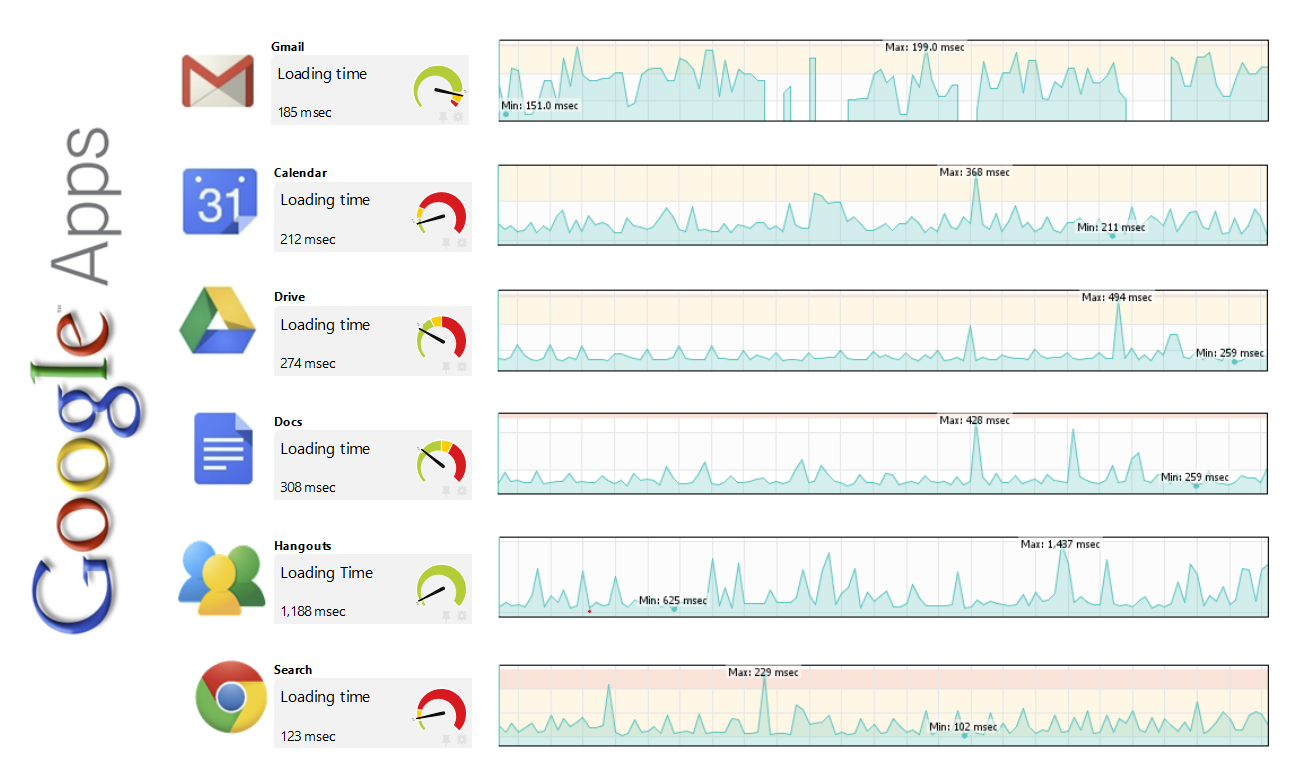
These are just some examples
of what your maps will look like
Where can I get more information?
![]()
Video Tutorials
Learn how to use maps and other PRTG features in our video tutorials.
![]()
PRTG Manual
Read a step by step explanation on how to use the maps feature within PRTG in our manual.
![]()
Knowledge Base
If you have specific questions, just ask the community in our knowledge base or search for questions other users had.
|
PRTG |
Network Monitoring Software - Version 24.2.94.1400 (April 10th, 2024) |
|
Hosting |
Download for Windows and cloud-based version PRTG Hosted Monitor available |
Languages |
English, German, Spanish, French, Portuguese, Dutch, Russian, Japanese, and Simplified Chinese |
Pricing |
Up to 100 sensors for free (Price List) |
Unified Monitoring |
Network devices, bandwidth, servers, applications, virtual environments, remote systems, IoT, and more |
Supported Vendors & Applications |
|


