CPU monitoring with PRTG
Jump to the topic of your choice
- A view of CPU monitoring with PRTG
- Spotlight: 9 PRTG sensors for monitoring your CPU
- CPU monitoring: PRTG to the rescue
- Take charge of CPU utilization with PRTG; get to the root of problems
- Context: CPU, Servers, Monitoring
- Why CPU Monitoring matters
- With PRTG monitoring, you are all set
- CPU temperature: How to deal with overheating
- FAQ: CPU monitoring
Spotlight: 9 PRTG sensors for monitoring your CPU
The CPU Usage Monitor PRTG features more than 250 preconfigured sensors. During
installation, PRTG will scan your network and create appropriate sensors, saving you
lots of time during setup. Several sensors are also available for CPU load monitoring.
For more information, see our PRTG manual.
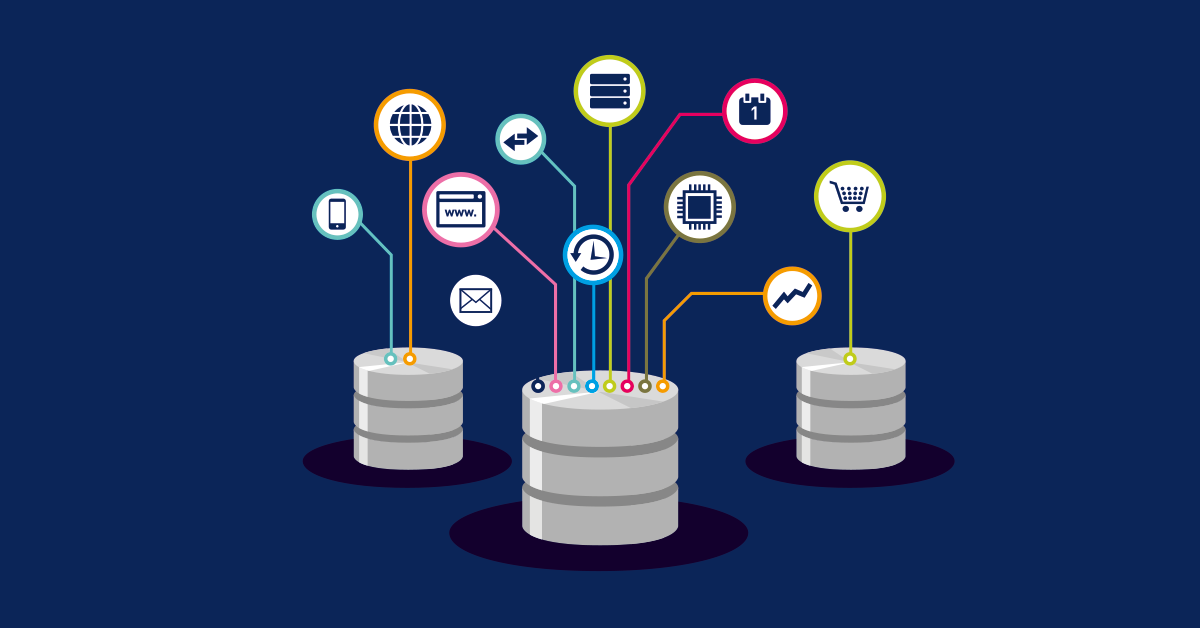
![]() How PRTG defines sensors
How PRTG defines sensors
In PRTG, “sensors” are the basic monitoring elements. One sensor usually monitors one measured value in your network, e.g. the traffic of a switch port, the CPU load of a server, the free space of a disk drive. On average you need about 5-10 sensors per device or one sensor per switch port.
Server compatible
![]()
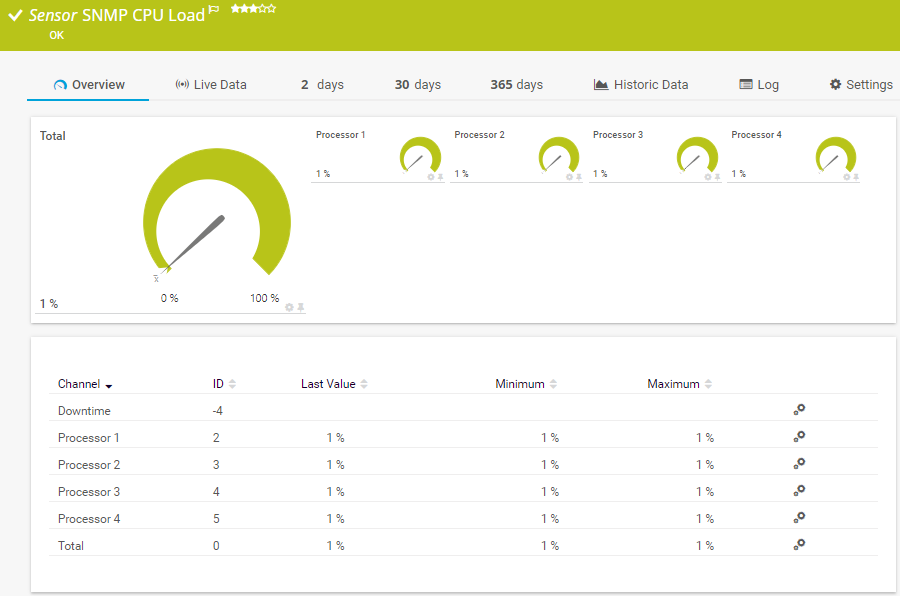
SNMP CPU Load Sensor
This sensor is one of the most commonly used sensors. SNMP requires very little bandwidth and CPU load. More information on the sensor here.
![]()
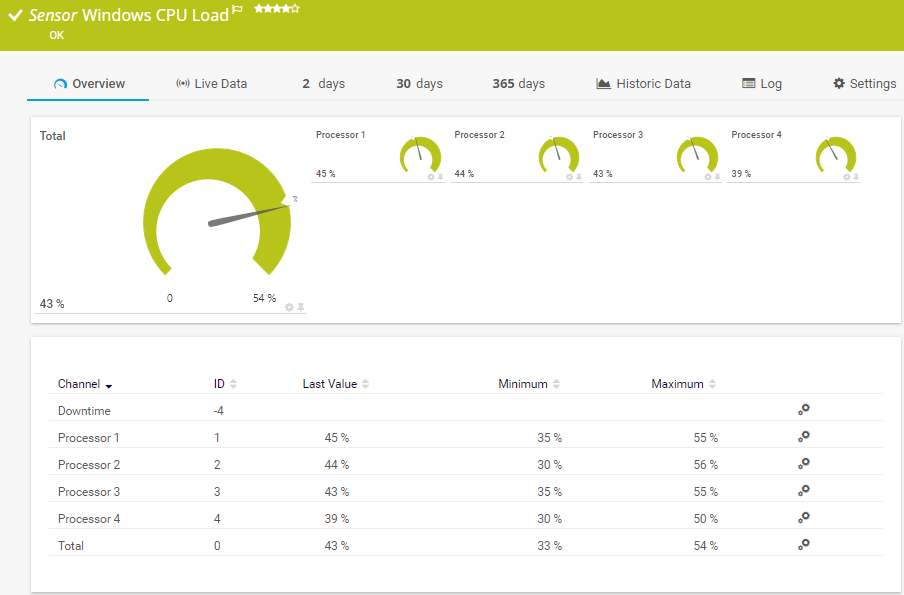
SNMP CPU Load Sensor
This sensor monitors the CPU load on Windows servers by using Windows performance counters and Windows Management Instrumentation (WMI). Check out the sensor here.
![]()
Windows Process Sensor
With this sensor, you can monitor individual processes or applications and therefore uncover the causes of a high CPU load. More information on the sensor here.
![]()
SNMP Linux Load Average Sensor
This preconfigured sensor is designed for monitoring Linux/Unix systems. Find out more about this sensor here.
![]()
SSH Load Average Sensor
You can also use this sensor to monitor Linux/Unix systems. Instead of SNMP, you will use Secure Shell (SSH). Find out more about this sensor here.
Manufacturer compatible
![]()
SNMP Cisco System Health Sensor
This sensor monitors the system health of Cisco devices, such as routers or servers. Alongside processor load, other health data is monitored, including CPU temperature. More information.
![]()
SNMP IBM System X System Health Sensor
Use this sensor to monitor IBM hardware with SNMP. Here too, a set of data (including CPU temperature) is queried and monitored. More information on the sensor.
![]()
SNMP IBM System X System Health Sensor
Use this sensor to monitor an HP ProLiant Server. Alongside CPU load, data such as temperature and ventilation will be gathered. More information.
![]()
SNMP NetApp System Health Sensor
This sensor monitors the status of a NetApp storage system. Find out more in our manual.

Practical tip: “Hey Stephan, what would you tell administrators looking to set up CPU monitoring with PRTG?”
“The SNMP CPU Load Sensor is a great way to get a handy overview of the load on all of a host’s CPU cores with just one sensor. Of course, this sensor also displays the total CPU load, which means you can always tell right away if one of your server’s processors is about to reach its load limit!”
Stephan Linke, technical support at Paessler AG
CPU monitoring: PRTG to the rescue
Example 1: Work processes are getting slower and slower
New accounting software causes a spike in CPU utilization on the application server. Employees notice their programs are running more slowly. But because the disruption is still minor, nobody notifies IT. Even IT is unable to detect the increased utilization. The result: Gradually all the company's work processes become slower. Only after a few months will the problem be identified and corrected.
PRTG to the rescue: PRTG CPU monitoring software allows administrators to quickly diagnose their server CPU utilization. You will see the effect new software has on CPUs as soon as it is installed. This means you can act promptly.
Example 2: The online store is down
A company launches a web campaign. Its website traffic increases dramatically. Consequently, CPU utilization on the web server soars. Within a few hours, the online store is running at a snail's speed. Few orders reach the final checkout stage. The positive effect of the campaign is squashed as customers become frustrated with the slow website, or find they can no longer use the service as their requests time out.
PRTG to the rescue: Here too, administrators are informed quickly about the increased CPU usage. PRTG comes with a built-in notification system that you can configure yourself. Choose to be notified by email, or in emergencies by SMS. Once notified, you can quickly get to work to find a solution.
Example 3: When viruses crash the party
IT networks are extremely susceptible to malware and viruses. Even sysadmins with the highest security standards are unable to protect their networks entirely. The same goes for medium-sized companies. Their computers get slower and slower, and it’s not long before the support desk receives its first complaints.
PRTG to the rescue: With our CPU monitoring tool, sysadmins can quickly tell if the CPU load is too high – even when few employees are actually working. They’ll also be able to recognize if data traffic is unusually high. As a result, they can immediately set out in search of malware, find it, and fix the damage.
Example 4: The router’s CPU goes down
Let’s take the example of an engineering firm. These companies grow extremely quickly and are therefore required to hire large numbers of staff in short periods of time. The inevitable result is that interruptions and downtime plague the network – despite the use of high-performance servers. Sysadmins must then determine where the problem lies.
PRTG to the rescue: IT managers can use our network monitoring software to recognize when:
- the CPU of an older router is reaching the brink;
- the router is acting as a bottleneck for large amounts of data;
- the CPUs of switches are about to overload.
Example 5: A fan stops working
Sooner or later, every network shows signs of wear and tear. One such example is a server’s fan: due to a technical problem, the fan gradually slows down until it stops working completely. Error message: CPU fan error. Result: The CPU heats up much more quickly and threatens to shut down.
PRTG to the rescue: PRTG System Health Sensors monitor the functionality of fans produced by a variety of manufacturers. Sysadmins are promptly notified in the event of a problem and can take action at once.
Take charge of CPU utilization with PRTG; get to the root of problems
![]()
Estimate load
CPU and server utilization is measured collectively and listed as a percentage. You get a constant overview of the current load and its long-term evolution. If the processor load begins to rise, you can respond quickly by upgrading your hardware.
![]()
Identify problems
Increased CPU usage can be caused by a number of factors. With PRTG, you can examine utilization for a specific period of time or an individual process. For example, you can determine if utilization is extremely high on certain weekdays or if a new application is responsible for greater processor utilization.
![]()
Create reports
PRTG lets you create customized reports. These reports feature charts and graphs that are easy to read. This means you can keep other departments informed of load problems or quickly and effortlessly explain to managers why additional hardware investments are required.
![]()
Get the full picture
PRTG is an all-in-one monitoring solution for your entire network. Along with CPUs, you can also monitor memory, network cards, hard disk space, and much more. You will therefore enjoy a complete overview of your entire network.
![]()
Customizable upgrades
Paessler offers a free PRTG trial version. With this trial version, you can try CPU monitoring with no strings attached. A variety of licenses are available, allowing you to upgrade your monitoring as best suits your needs, such as when your company grows or you would like to reinforce your monitoring.

PRTG makes your job easier
Our monitoring software frees you to focus on other tasks by promptly notifying you of potential issues.
![]()
Save effort
PRTG gives you one central monitoring tool for your servers and entire network. Enjoy a quick overview of your whole infrastructure via our dashboard and app.
![]()
Save time
Getting started with PRTG is a breeze. Setting up or switching from another network monitoring tool is easy thanks to the auto-discovery and pre-configured device templates.
![]()
Save money
80% of our customers report substantial cost savings with network monitoring. Your costs of licenses will likely pay for themselves within weeks.
Context: CPU, Servers, Monitoring
![]()
CPU
The processor or central processing unit (CPU) is a central part of the motherboard. It processes a computer program's incoming commands. A processor chip usually contains multiple "cores," or independent processing units. A quad-core processor, for example, has four CPU cores. Such a processor provides for greater stability and performance. However, because CPU utilization can spike (causing a variety of side effects), it makes sense to monitor the processor separately. The largest CPU manufacturers for computers are Intel and AMD.
![]()
Servers
Whether Windows, Linux, or Mac: PRTG monitoring works with a variety of operating systems. Monitoring takes place via SNMP or WMI (for Windows servers). For Linux and Mac systems, the monitoring may also occur via the SSH protocol. PRTG comes with preconfigured sensors for each of these systems so you can get started with your monitoring as quickly as possible.
![]()
Monitoring
There is a CPU in every piece of hardware. Hardware is a central pillar for the stability and performance of a device. It is therefore especially important to monitor the processors of these vital network components. In general, a CPU monitor should cover a company's servers, routers, and switches. But processor monitoring is valuable for other components as well. Proper monitoring depends on interfaces to hardware manufacturers such as Cisco, IBM, NetApp, Dell, or HP. As a processor monitor, PRTG also provides preconfigured sensors for these providers.
Why CPU monitoring matters
The CPU is an integral part of all your hardware devices and ensures their stability. If, for example, your server or network performance deteriorates, a possible reason could be a high processor load. With preconfigured sensors PRTG keeps you updated about the CPUs of all your computers, servers, routers, and switches.
PRTG CPU Monitor includes fully customizable alarms and sends you an instant notification if the usage of any processor rises and exceeds a defined threshold.
With PRTG monitoring, you are all set
PRTG lets you monitor your entire network. The following links contain more information on sensors, advantages, and the history of PRTG
Server monitoring
PRTG monitors a variety of different servers. Whether a mail, web, or database server or entire server rooms - PRTG lets you keep an eye on everything.

VMware monitoring
PAESSLER AG has been a certified VMware Technology Alliance Partner for many years now. This means you will enjoy a tailor-made monitoring solution.
Bandwidth monitoring
PRTG lets you promptly detect bandwidth overloads. You can also use PRTG to get down to root causes.
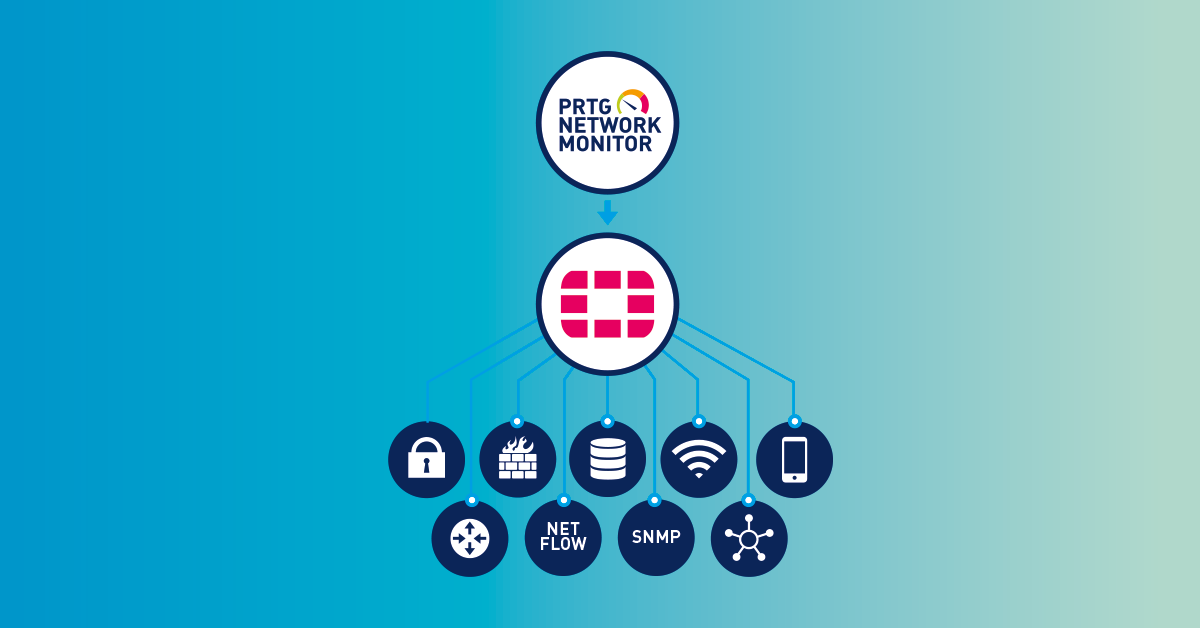
Fortinet monitoring
Check the status of your Fortinet products and get alerts as soon as your Fortinet solution identifies a security risk.
CPU temperature: How to deal with overheating
![]()
Processor temperature
When the load increases, the processor’s core gets hotter. Overheating can occur when certain loads are reached or when a fan malfunctions or goes down. Savvy sysadmins like to overclock the CPU to increase performance. But overclocking can lead to overloading and excessive heat. Most CPUs come with overheat protection. If they get too hot, they shut down automatically.
![]()
Checking the CPU temperature
The maximum recommended processor temperature is usually provided by the manufacturer. PRTG System Health Sensors check the temperature of CPUs from a variety of different manufacturers. Sysadmins can also use the SNMP Custom Sensor to check the temperature of devices (provided they are compatible with SNMP), and define the temperatures which, when exceeded, will trigger an alarm. In other words, they define threshold values for themselves. Thresholds are a good idea when it comes to monitoring critical infrastructures.
![]()
Stopping CPU failure in its tracks
If a critical value is reached, IT managers will immediately receive a notification. This lets them quickly take action before the CPU fails completely. CPU monitoring increases the stability of the entire network. The network crashes a lot less frequently – which saves the company considerable time and money.
FAQ: CPU monitoring
CPU temperature: At what temperature is the CPU too hot?
Rule of thumb: The temperature of the room is the best temperature for the CPU. Limits or thresholds depend on the manufacturer and model.
What happens if the CPU overheats?
Most CPUs shut themselves off automatically. This always leads to a crash. The CPU can also become permanently damaged. In such a case, you’ll need to replace its processor.
How can I check the CPU temperature?
When you install PRTG, sensors are created for all the devices found within the specified IP address range. These include the CPU and System Health Sensors, which are described above. PRTG automatically checks the CPU temperature in accordance with the manufacturer and target device.
Which CPU monitoring tools check CPU temperature?
Generally speaking, there are two types of tools: specialized tools for monitoring CPUs only, and all-round software for monitoring the entire network. Private users may find that smaller, free tools are often enough. Companies, on the other hand, will want to have a look at professional solutions such as PRTG.
We asked: would you recommend PRTG?
Over 95% of our customers say yes!
Paessler AG conducted trials in over 600 IT departments worldwide to tune its network monitoring software closer to the needs of sysadmins.
The result of the survey: over 95% of the participants would recommend PRTG – or already have.

Create innovative solutions with Paessler’s partners
Partnering with innovative vendors, Paessler unleashes synergies to create
new and additional benefits for joined customers.

With the combination of PRTG and Insys, the monitoring specialist Paessler and the industrial gateway manufacturer INSYS icom offer a practical possibility to merge IT and OT.
INSYS icom


PRTG: The multi-tool for sysadmins
Adapt PRTG individually and dynamically to your needs and rely on a strong API:- HTTP API: Access monitoring data and manipulate monitoring objects via HTTP requests
- Custom sensors: Create your own PRTG sensors for customized monitoring
- Custom notifications: Create your own notifications and send action triggers to external systems
- REST Custom sensor: Monitor almost everything that provides data in XML or JSON format
Still not convinced?
![]()
More than 500,000 sysadmins love PRTG
Paessler PRTG is used by companies of all sizes. Sysadmins love PRTG because it makes their job a whole lot easier.
Still not convinced?
![]()
Monitor your entire IT infrastructure
Bandwidth, servers, virtual environments, websites, VoIP services – PRTG keeps an eye on your entire network.
![]()
Try Paessler PRTG for free
Everyone has different monitoring needs. That’s why we let you try PRTG for free. Start now with your trial.
|
PRTG |
Network Monitoring Software - Version 24.2.94.1400 (April 10th, 2024) |
|
Hosting |
Download for Windows and cloud-based version PRTG Hosted Monitor available |
Languages |
English, German, Spanish, French, Portuguese, Dutch, Russian, Japanese, and Simplified Chinese |
Pricing |
Up to 100 sensors for free (Price List) |
Unified Monitoring |
Network devices, bandwidth, servers, applications, virtual environments, remote systems, IoT, and more |
Supported Vendors & Applications |
|