 Originally published on November 12, 2012 by Patrick Gebhardt
Last updated on January 23, 2024
•
28 minute read
Monitoring basic parameters throughout your entire network is good, while monitoring in more detail, is often better. As a versatile solution, Paessler PRTG Network Monitor adapts to your needs and supports you with monitoring your application servers and services as whole and not only separate single aspects of these. With pre-configured sensors for applications and services, PRTG makes it easy to monitor the following:
- Mail server monitoring
- SharePoint and IIS monitoring
- Backup monitoring
- Windows security and service monitoring
- Database monitoring
- Web application monitoring
- Monitoring of various other services
PRTG also supports users in building up a complete monitoring that goes far beyond simple uptime monitoring which includes performance statistics of these servers into your central monitoring:

Most companies rely on a high performing email system for daily business communication - both externally and internally. Any impairment on the mail delivery process can likely affect all employees within a company. Therefore, it is vital to monitor company mail servers. PRTG can monitor POP3, SMTP, and IMAP mail server types with special sensors; ensuring that they are reachable and ready to send or receive messages.
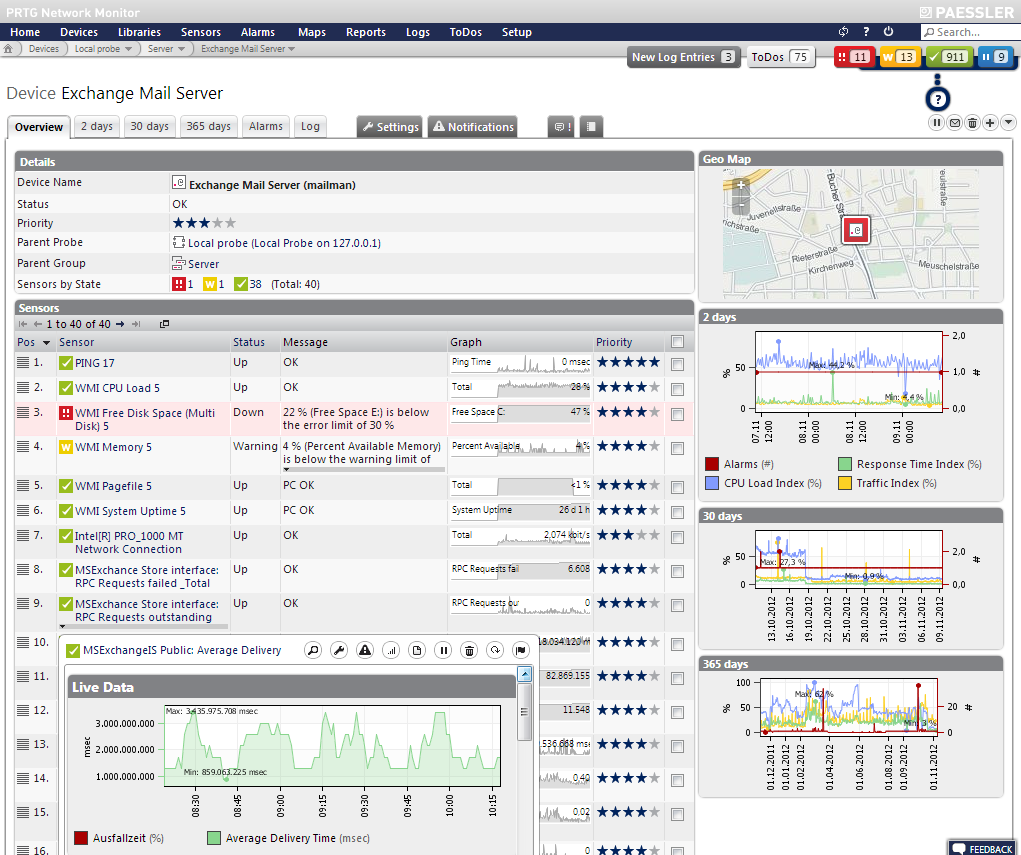
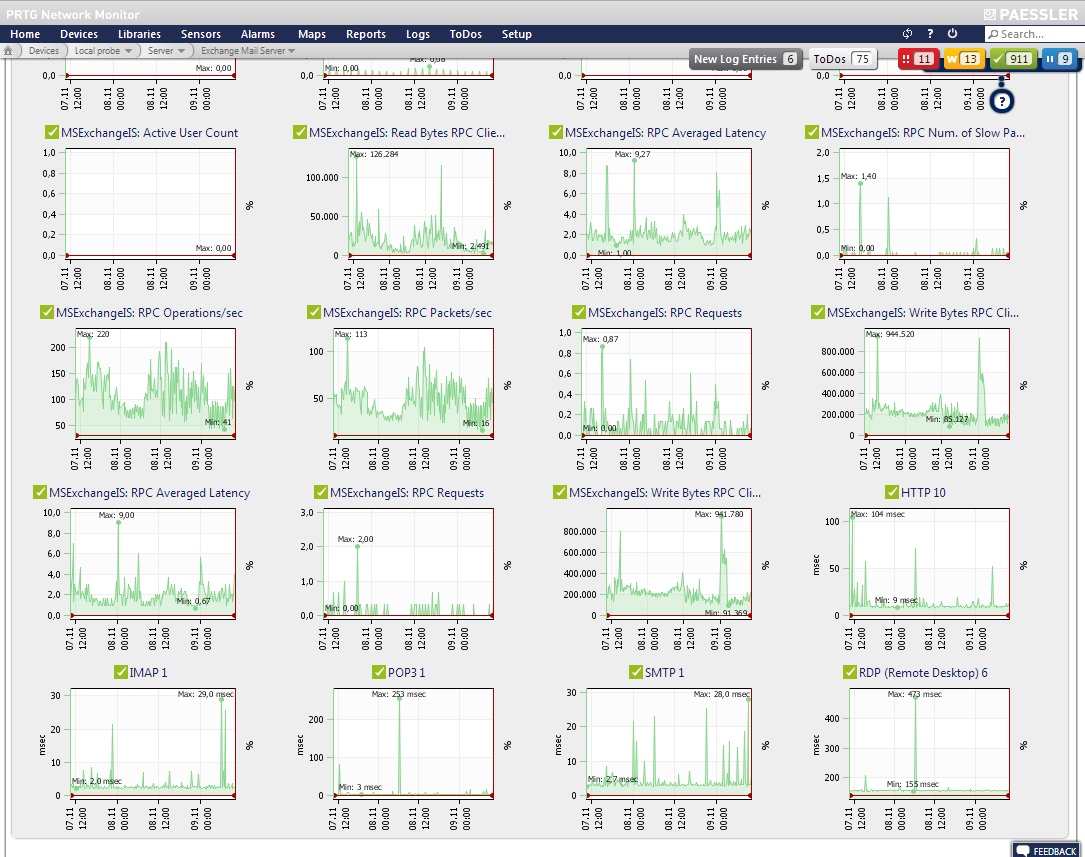
When running a Windows Exchange server, there are specific sensors available to monitor the size of the different mail queues, the delivery times, latency, users, etc. There is even a dedicated sensor that shows the length of transport queues on your Exchange server; it can show information for over 30 different queues.
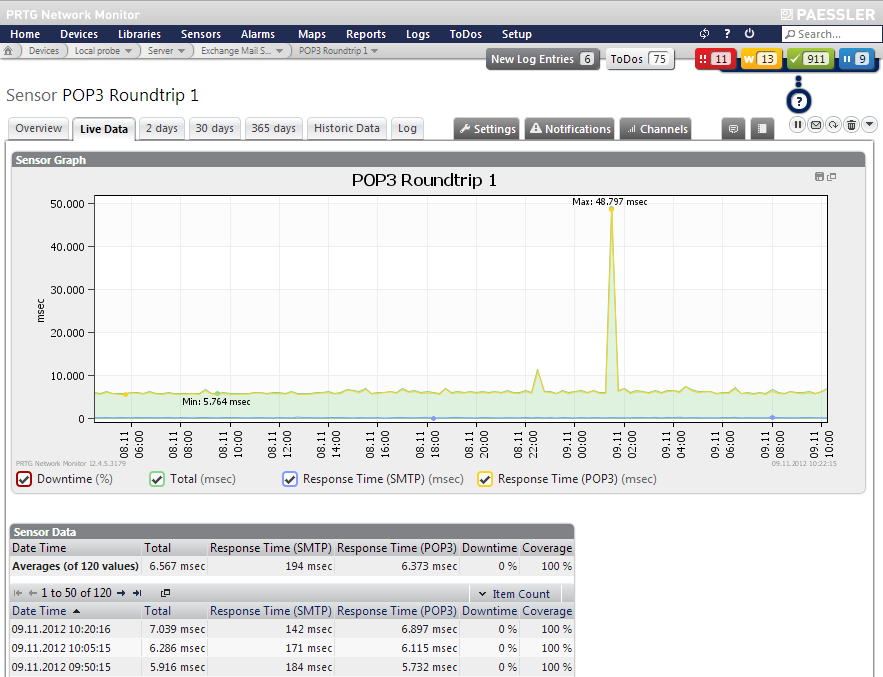
An additional two sensor types enable round trip monitoring which measures the time it takes to send out an email and receive it back again. To gain measurements, PRTG sends out an email via SMTP to an external email account (e.g., at Gmail, or wherever you like). This account must be configured to forward mails immediately to another email account on your mail server. After sending out the test email, PRTG constantly checks the target mailbox via IMAP or POP3. Once the message is received, PRTG writes the round trip time into its database. You can configure a maximum round trip time you are willing to accept. If this time is surpassed, the system alerts immediately, so you know the email process is slow or even disturbed.
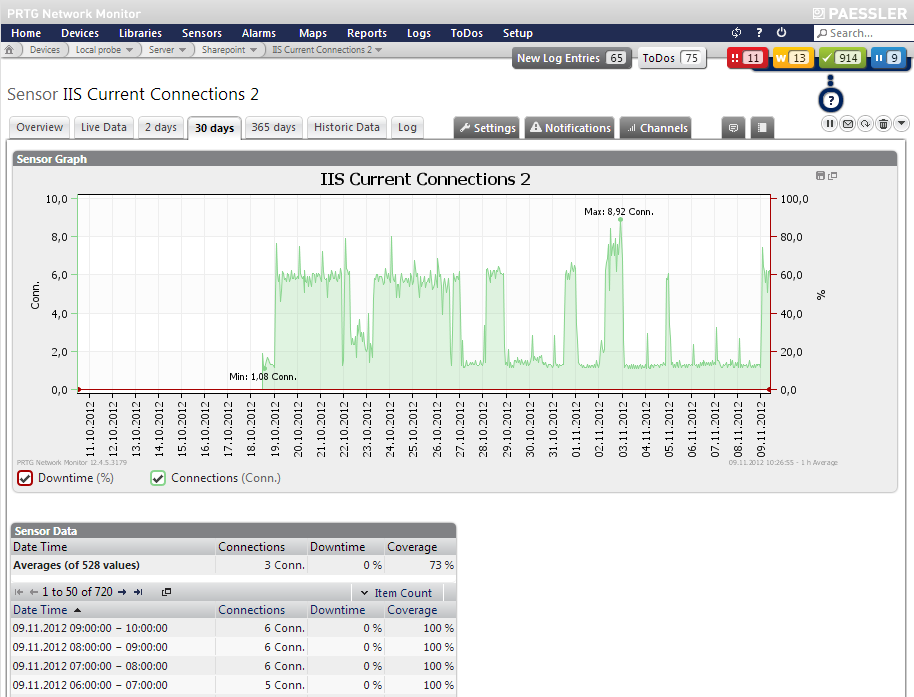
PRTG supports users with special sensor types if they run a SharePoint or Internet Information Services server to monitor the different processes. For SharePoint users get values for current page requests, active threads, CPU utilization, SQL queries currently executing, etc. For an IIS server, PRTG reports bytes sent and received, the speed of get and post requests, the number of users per second, and other values.
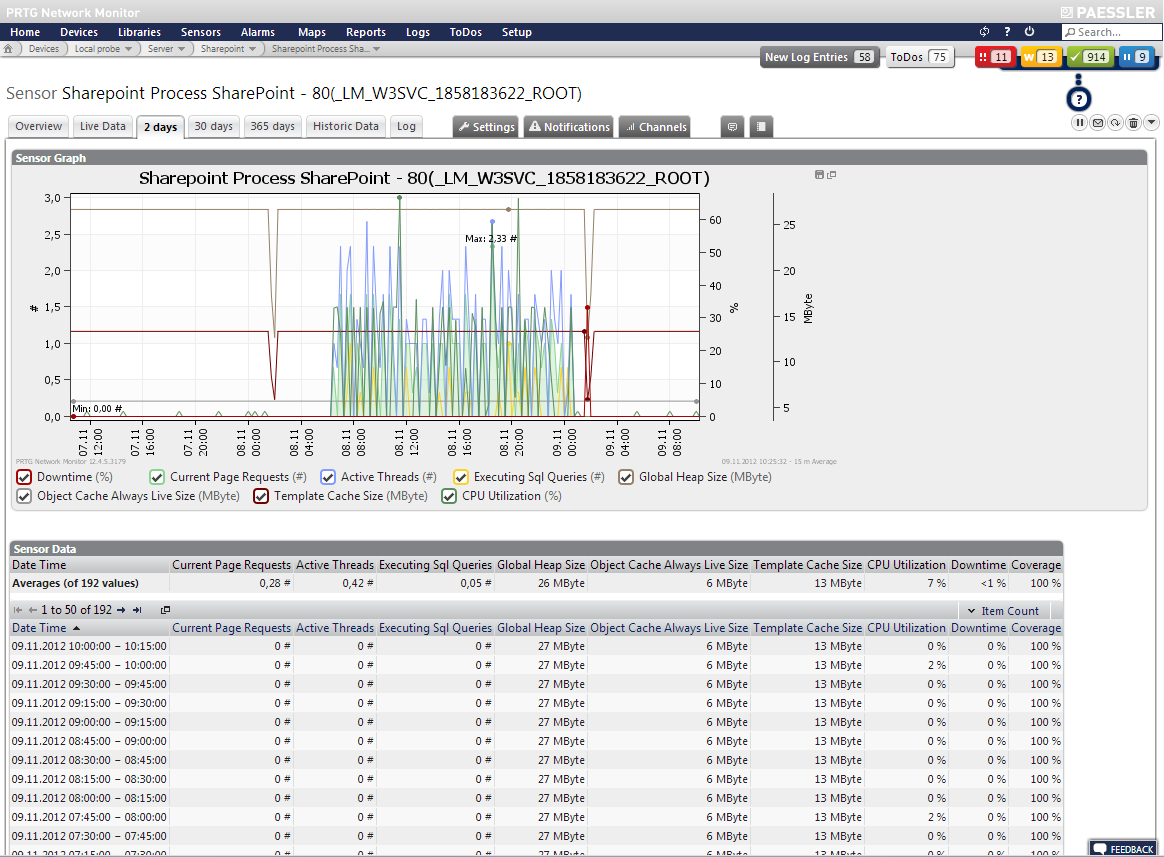
By using these sensors, you can make sure that these central and frequently used applications are available and working properly. These sensors only have to be added to the device in PRTG and will monitor vital parameters immediately.
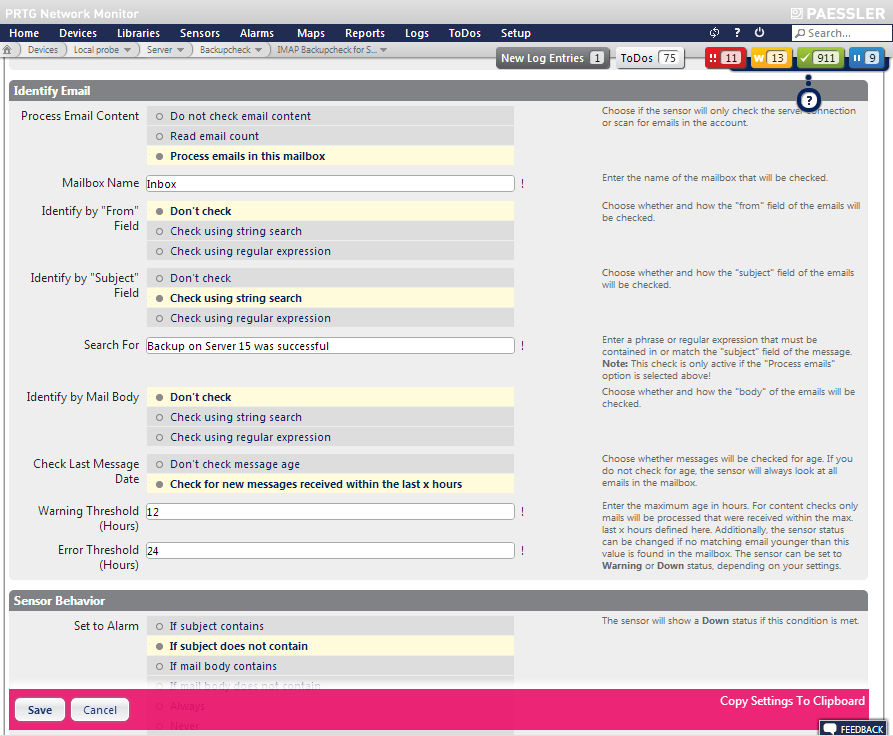
For monitoring your backups, we recommend PRTG's IMAP sensor with its recently added filter options. As most backup solutions are able to send emails indicating success or failure of a backup job, this is a universal solution for almost every backup. You won't need to check all the individual emails every morning sent to your personal inbox by your backups.
Simply configure your backup software to send emails to a dedicated mail account in future. Then, set up an IMAP sensor to check this account regularly. It can check for certain key words in the subject line and in the body of the messages, and it can also alert you if no email was received during a certain time span. This way, you are well prepared to let PRTG evaluate the backup emails automatically. You're alerted if something is wrong; and you know everything is working properly when your sensor stays green.
For more information about backup monitoring, please see our blog article Monitoring Backup Solutions via Email.
In addition to all these possibilities for application monitoring, there are several other sensor types that can be used to monitor servers or services. The WMI Service sensors checks if a Windows service is running on a target computer and it can even try to automatically restart a "hanging" service as soon as it is detected.
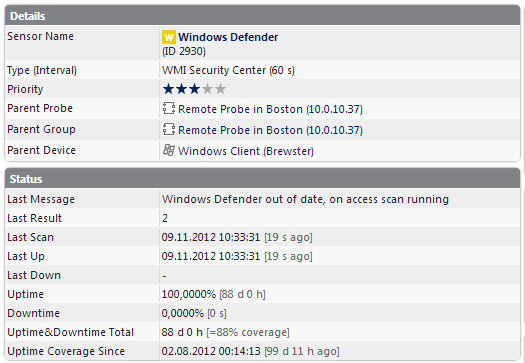
The Security Center sensor can query the Windows security center for its status. If it reports missing anti-malware software, or anti-virus signatures being out-of-date, you will be informed immediately. This is also ideal as an additional sensor on your mail server to make sure the anti-virus solution is running and up-to-date.
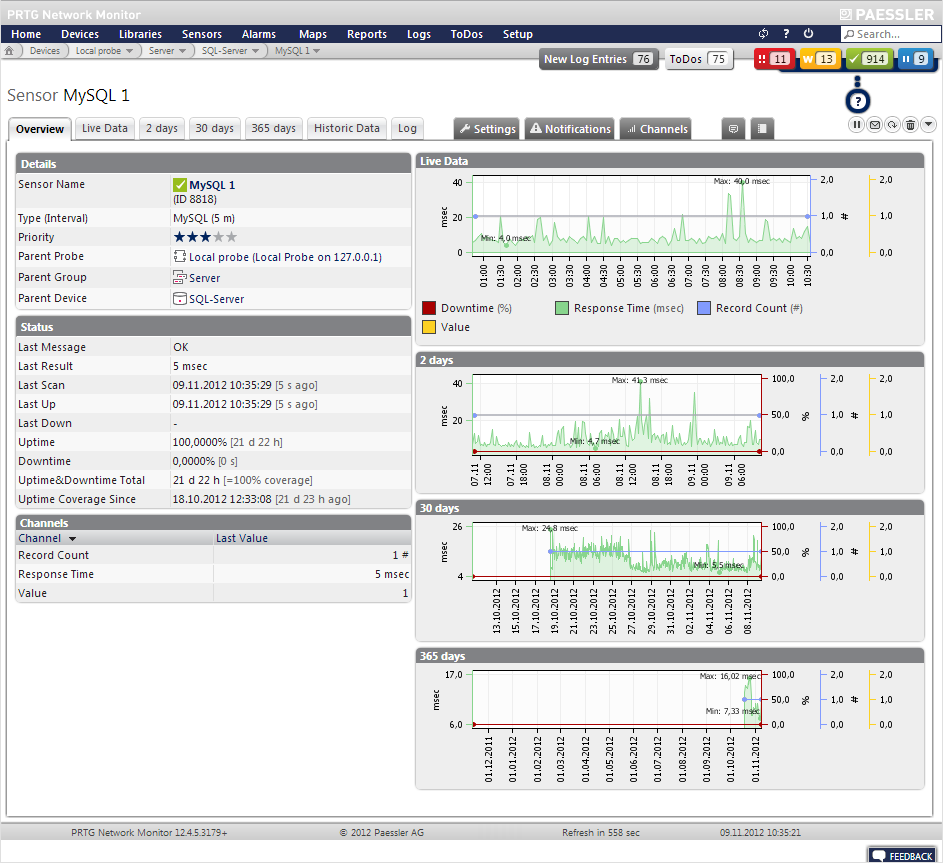
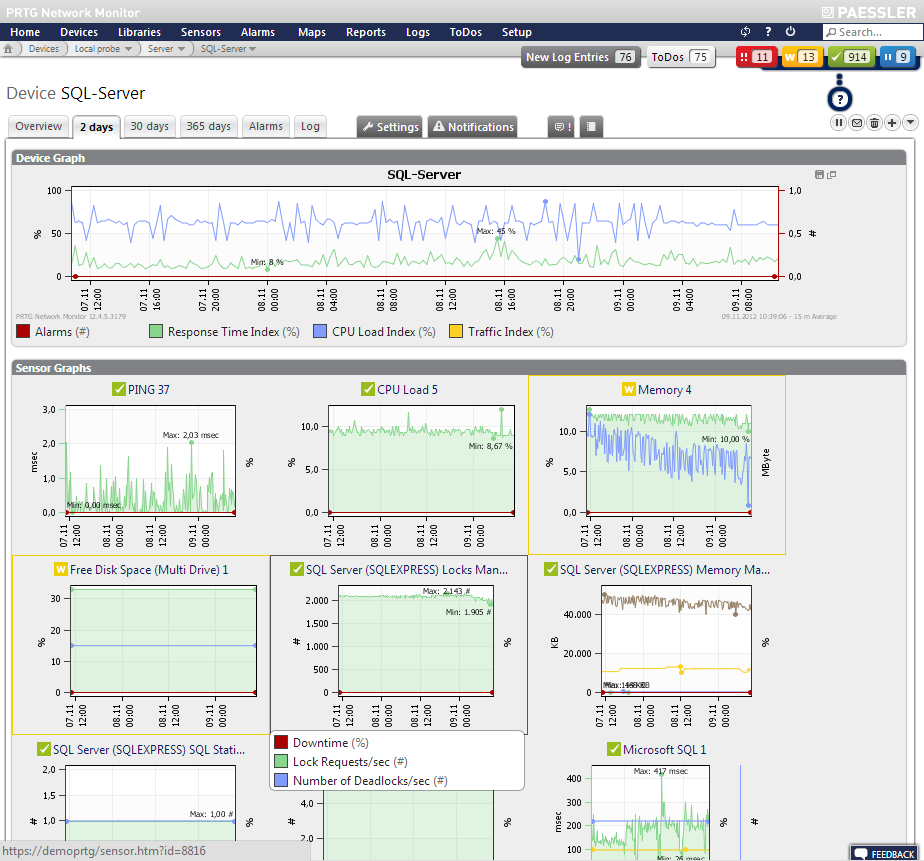
Your database servers can be monitored as well. PRTG can send a query and check the results for you (response time, record count). Out of the box, PRTG supports monitoring Oracle, MySQL, Microsoft SQL, and any other database supporting the ADO interface. For Microsoft SQL database servers, there is another sensor type which monitors user connections and logins/logouts.
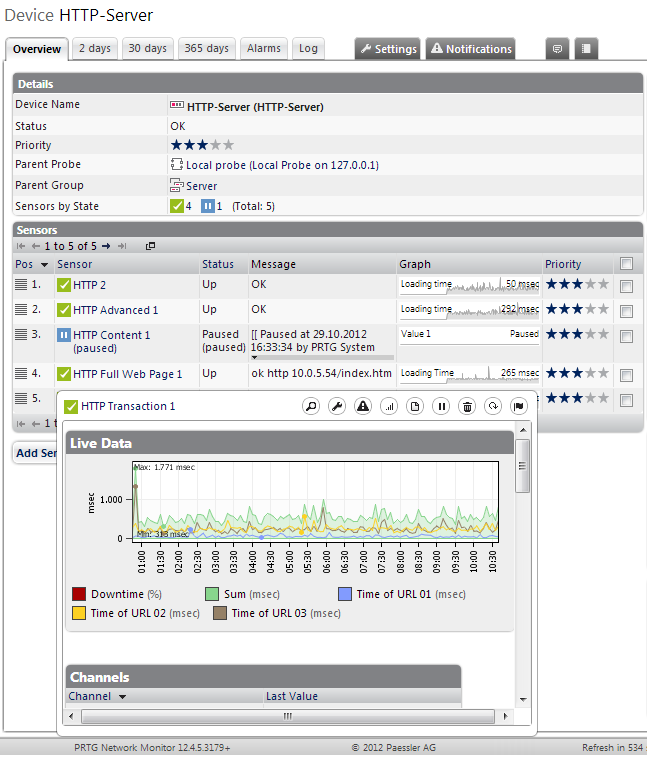
PRTG's various HTTP sensors let users monitor availability and loading times of their website. You can even render an image of the current appearance of a website in order to create a visual history, using the Full Web Page sensor. The transaction sensor is a great tool to check if a web shop is working as expected: with a series of requests, you, for example, can simulate the buying process. Only if all actions in a row can be completed successfully, the check returns an "OK" message. If anything goes wrong, you are immediately alerted and can react instantly to avoid loss of earnings for your company because of the web shop not being available or very slow.
There is a range of other sensor types that round up the service monitoring PRTG offers. These include, for example:
- Monitor the functionality of a DHCP service in your network
- Monitor time servers via SNTP
- Monitor FTP servers (incl. file count and TFTP)
- Monitor DNS services (incl. blacklist monitoring)
- Monitor LDAP
- Monitor RADIUS servers
- Monitor open/closed ports
- Monitor the number of trace route hops

There are different ways to visualize the data collected while monitoring. First, you can access all data directly in the PRTG device tree where you created your devices and sensors. It is also possible to create on-demand ad hoc reports of any time spans you would like, including raw data.
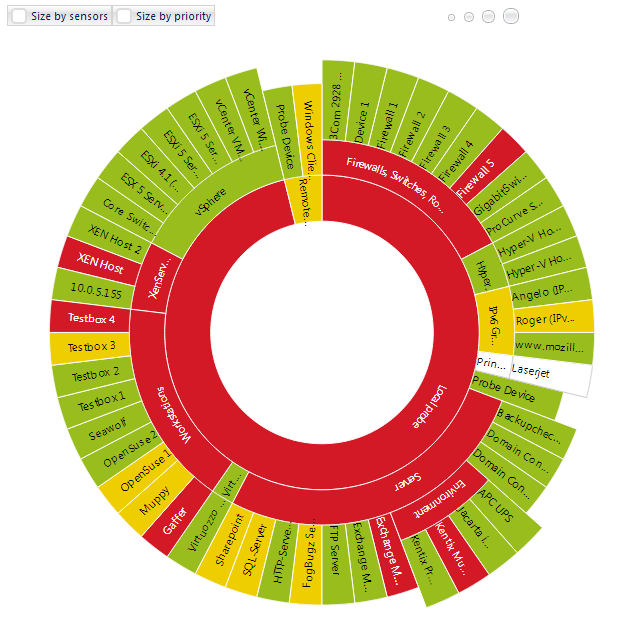
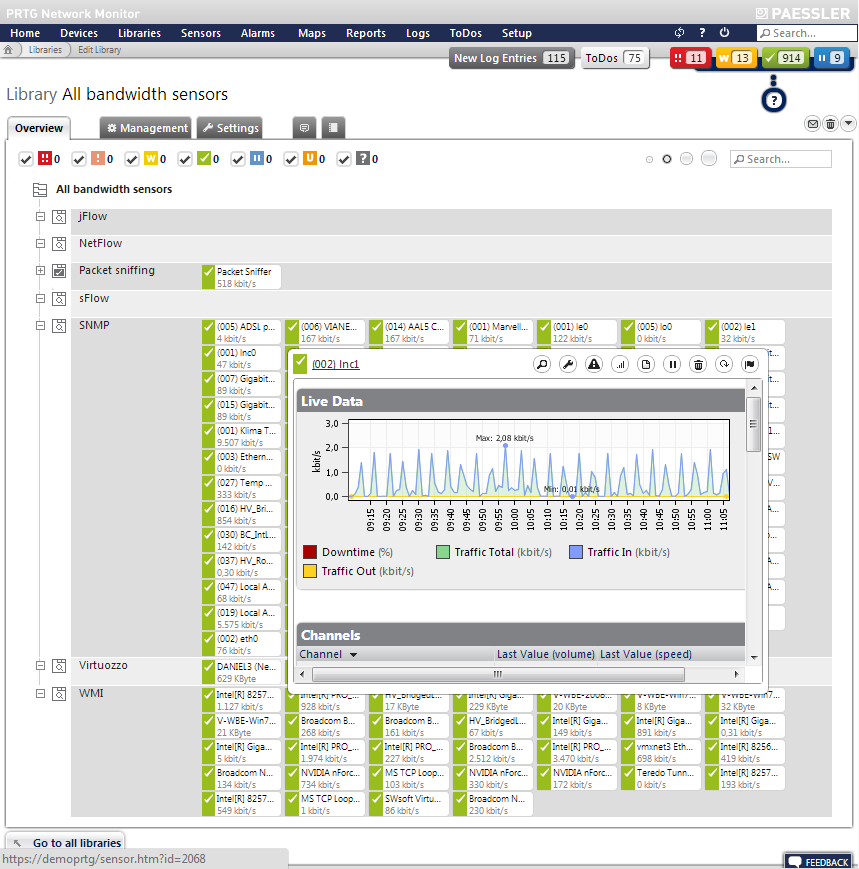
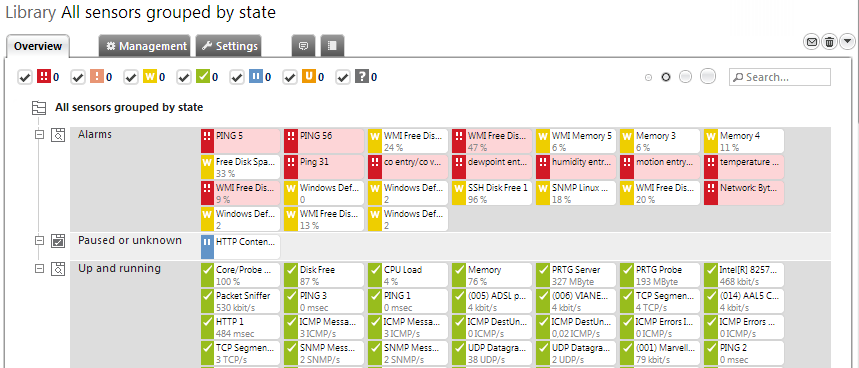
Libraries allow alternative views of the device tree, as well as further easy filtering options. This enables you, for example, to create lists of sensors used to monitor one dedicated application or service and display these sensors together, regardless of what device they're originally running on. You can also tag the desired objects in your device tree and let PRTG put together your library automatically by displaying all objects with a specific tag. This way, new objects will be added automatically to existing libraries.
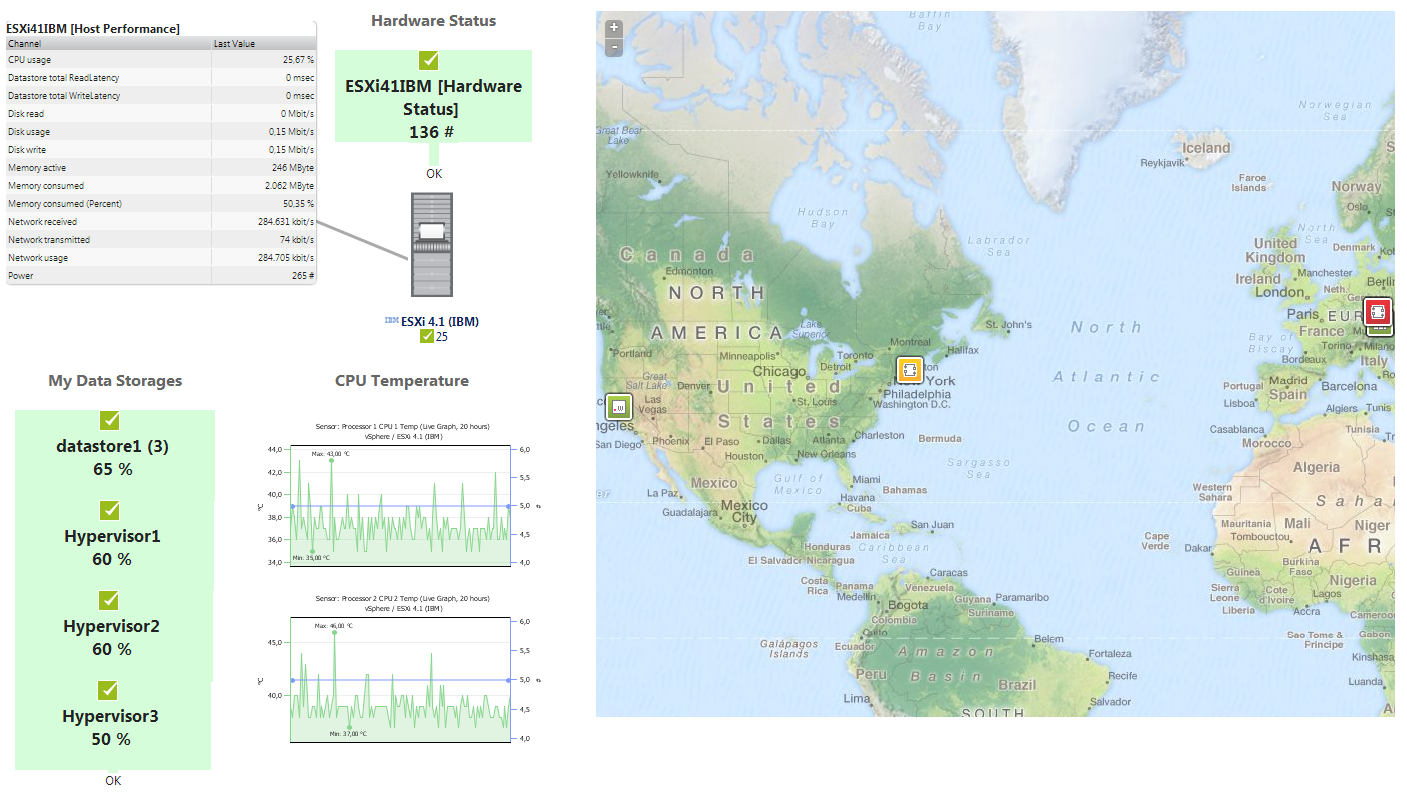
If you are looking for an even more general and easy to read presentation modus, the customizable PRTG Maps bring together live monitoring status, graphs, and tables of all sensors monitoring one application, using your personalized layout as well as lines, custom objects, or your own pictures.
Classic reporting is available, where you can schedule regular reports, e.g. in PDF format, and use them for demand analysis, or to prove SLAs. Reports can also be sent automatically, for example, quarterly reports on bandwidth usage for your CEO.
One central point of information for all applications
Paessler PRTG gives you an overview of your entire network, including devices and direct infrastructure, in addition to application servers and the performance statistics of these. Whenever a service is not reachable, or thresholds are breached, you can be alerted immediately. And if you do not hear anything from PRTG, no news is good news and the network should be running perfectly.
Curious? Start monitoring your network immediately and download your free trial version of PRTG today!