 Originally published on March 25, 2009 by Dirk Paessler
Last updated on March 03, 2022
•
4 minute read
In order to provide graphs that show a quick status overview of your complete network (or a part of it) PRTG computes so-called "index" values based on the measurements of all sensors.
The "index" graphs are synthetic values between 0% and 100% based on current sensor measurements and their historic maximum values. The calculation of these index values works similar to a stock index which is computed using the current values of selected stocks. For each group and device PRTG shows four values in a graph.
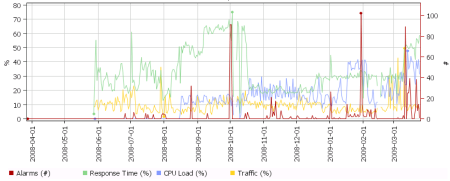
They are based on the measurements of all sensors in that group (or device). The "Alarms" graph simply shows the number of alarms at a given moment in history. Then there are three index values:
- "Response Time Index"
- "CPU Load Index"
- "Traffic Index"
Examples
A CPU Load Index value of 10% for a group means that the average CPU load for all CPU sensors of this group currently is at 10% of the highest ever measured CPU usage value of that group. For response times usually the historic maximums are much higher than the average value. E.g. for pings in a LAN a "normal" time might be 2-10ms while a maximum of several hundred Milliseconds is not unusual. This is the reason that most Response Time Index readings are usually between 10% and 20%. The following two charts show the traffic index for two switches for 48 hours: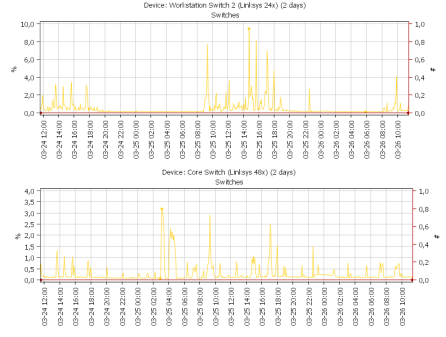
How Does It Work?
- During the normal network monitoring process PRTG records the highest value ever measured for each sensor
- The current measured value is weighted with this boundary values to compute an index value for a sensor between 0% and 100%
- For each device the index values for CPU load sensors, traffic sensors and sensors that measure response times are combined
- For each groups the index values of all devices are combined