 Originally published on January 19, 2016 by Thomas Timmermann
Last updated on March 03, 2022
•
7 minute read
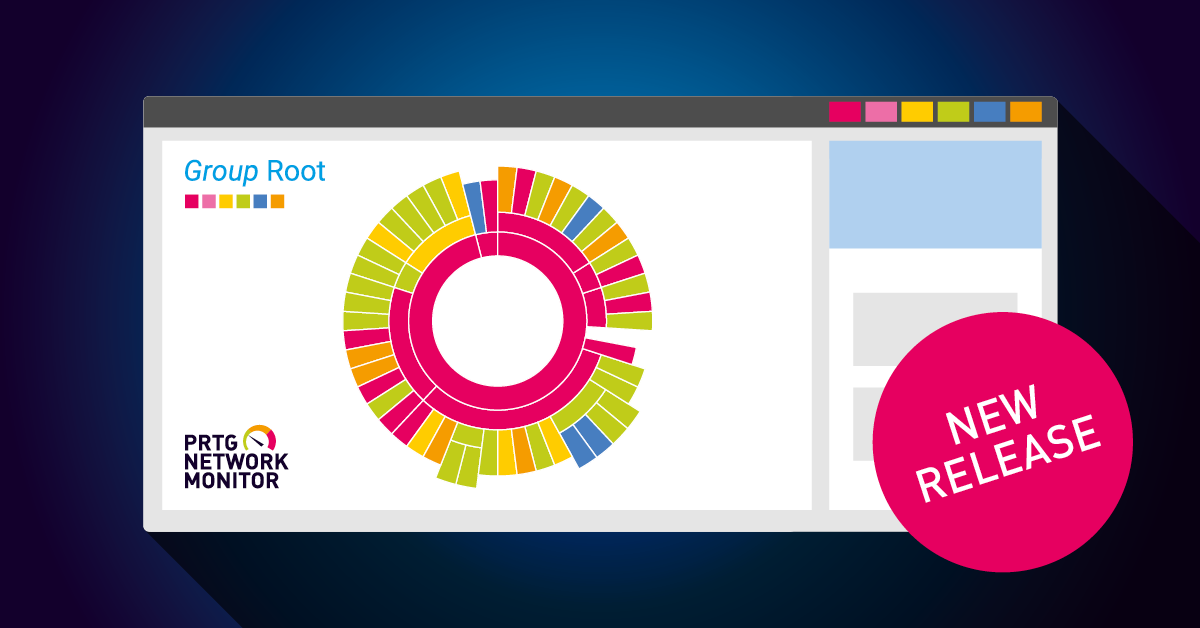
PRTG Network Monitor offers a comprehensive overview of the performance and availability of your entire IT infrastructure. Each PRTG sensor provides information on individual aspects of a device or service, while some of them, such as the email round trip sensors, monitor entire, predefined processes.
With the Business Process Sensor, PRTG now goes one step further. It allows you to combine several sensors in one, defining your own, more complex processes, and display them in PRTG.
Example Process Website
Monitoring a website is a great example of our new business process sensor. Take the example of a website backend, designed here to be deliberately simple as an example. We have a Load Balancer that distributes incoming user requests to four Web servers, which are filled from two databases. We only use ping sensors, so only have the status of "accessible" or "unreachable".
The process consists of three tasks (load balancers, web servers, databases), including redundancies for the web servers and databases. For this website backend process, three Web servers and a database could fail and the process would still work, meaning the website would still be available for your customers. To display this within the business process sensor, we add a ping sensor to the load balancer, to each Web server and to each database. These objects we summarize in the channels of the Business Process sensor and name the channels accordingly: Load Balancer, Web Servers and Database.
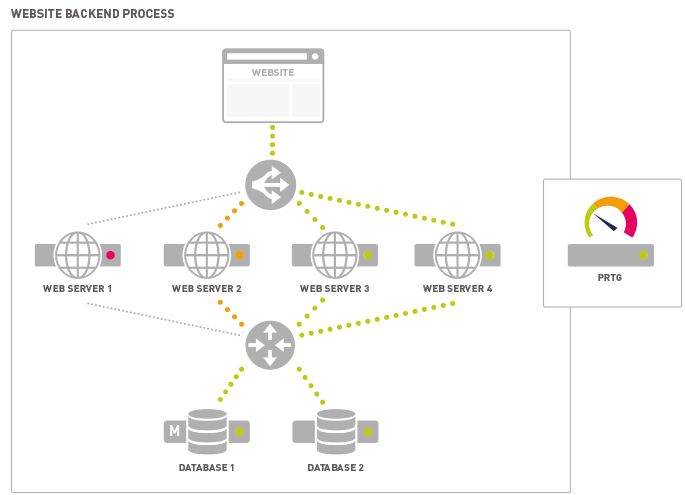
Now we define percentage values for alerts and alarms. For the four Web servers, we put 75% for a notification (Warning) and 50% for a fixed alarm (Error). That means that for the task Web Servers, at least 3 web server (75%) must be available, otherwise the whole process goes into the Warning status and a message is sent. If one web server fails (75% availability), the process stays green and no alerts or alarms are sent. If less than 50% are available, the business process sensor goes into error status and sends appropriate alerts. As only one Load Balancer is available, the failure of it would paralyze the entire process. For the corresponding channel in the Business Process sensor that means that we define a required availability of 100%, for both Warning and for Error. You can find this process in detail in the PRTG Knowledge Base.
Green Light for Your Business
The Business Process sensor is flexible, capable of providing as much or as little detail as needed. For example, if your only concern is that the website is available, you can set the values for Warning and Error to 100% for the load balancer, 25% for the Web servers and 50% for the databases. As long as those thresholds aren't crossed, the Business Process Sensor would show green. For you as an administrator to be informed if single servers fail, you can define individual notification and alerting thresholds for the sensors of each server.
A Small Investment for a Big Insight
While website monitoring serves as a simple example, you can use the Business Process sensor for more complex processes. You can use all types of predefined sensors in PRTG, you can create your own sensors based on the PRTG Custom Sensors, and integrate them, and you can even merge several Business Process sensors into a parent sensor. Therefore, it is important that you model the particular process in the run-up thoroughly and weight the individual tasks adequately.
The reward for setting up Business Process sensors is clear to see: You can tell at first glance whether your core business processes work or whether you have to intervene anywhere.