


Custom alerts and data visualization let you quickly identify and prevent network connection issues.
Paessler PRTG makes it easy to keep an eye on server problems, faulty switches, router disruptions, modem issues, and more. Our software gives you access to more than 250 preconfigured sensors for all the biggest manufacturers, as well as customizable, user-defined sensors.
PRTG comes with alerting and reporting, custom dashboards, easy tutorials, and expert support out of the box. Our all-in-one monitoring and network troubleshooting software is designed with all the features you need to monitor your entire IT infrastructure.
Continuously monitor and troubleshoot your network with PRTG to uncover security breaches due to malware and other culprits. Moreover, you can avoid expensive downtime by detecting minor issues before they escalate into major, costly problems that require extensive repairs.
Diagnose network issues by continuously tracking and troubleshooting network connectivity, availability, health, and performance. Show hardware parameters, bandwidth usage, network traffic, and other network performance monitoring metrics in real time. Visualize monitoring data in clear graphs and dashboards to identify problems more easily. Gain the overview you need to troubleshoot all components of your network.
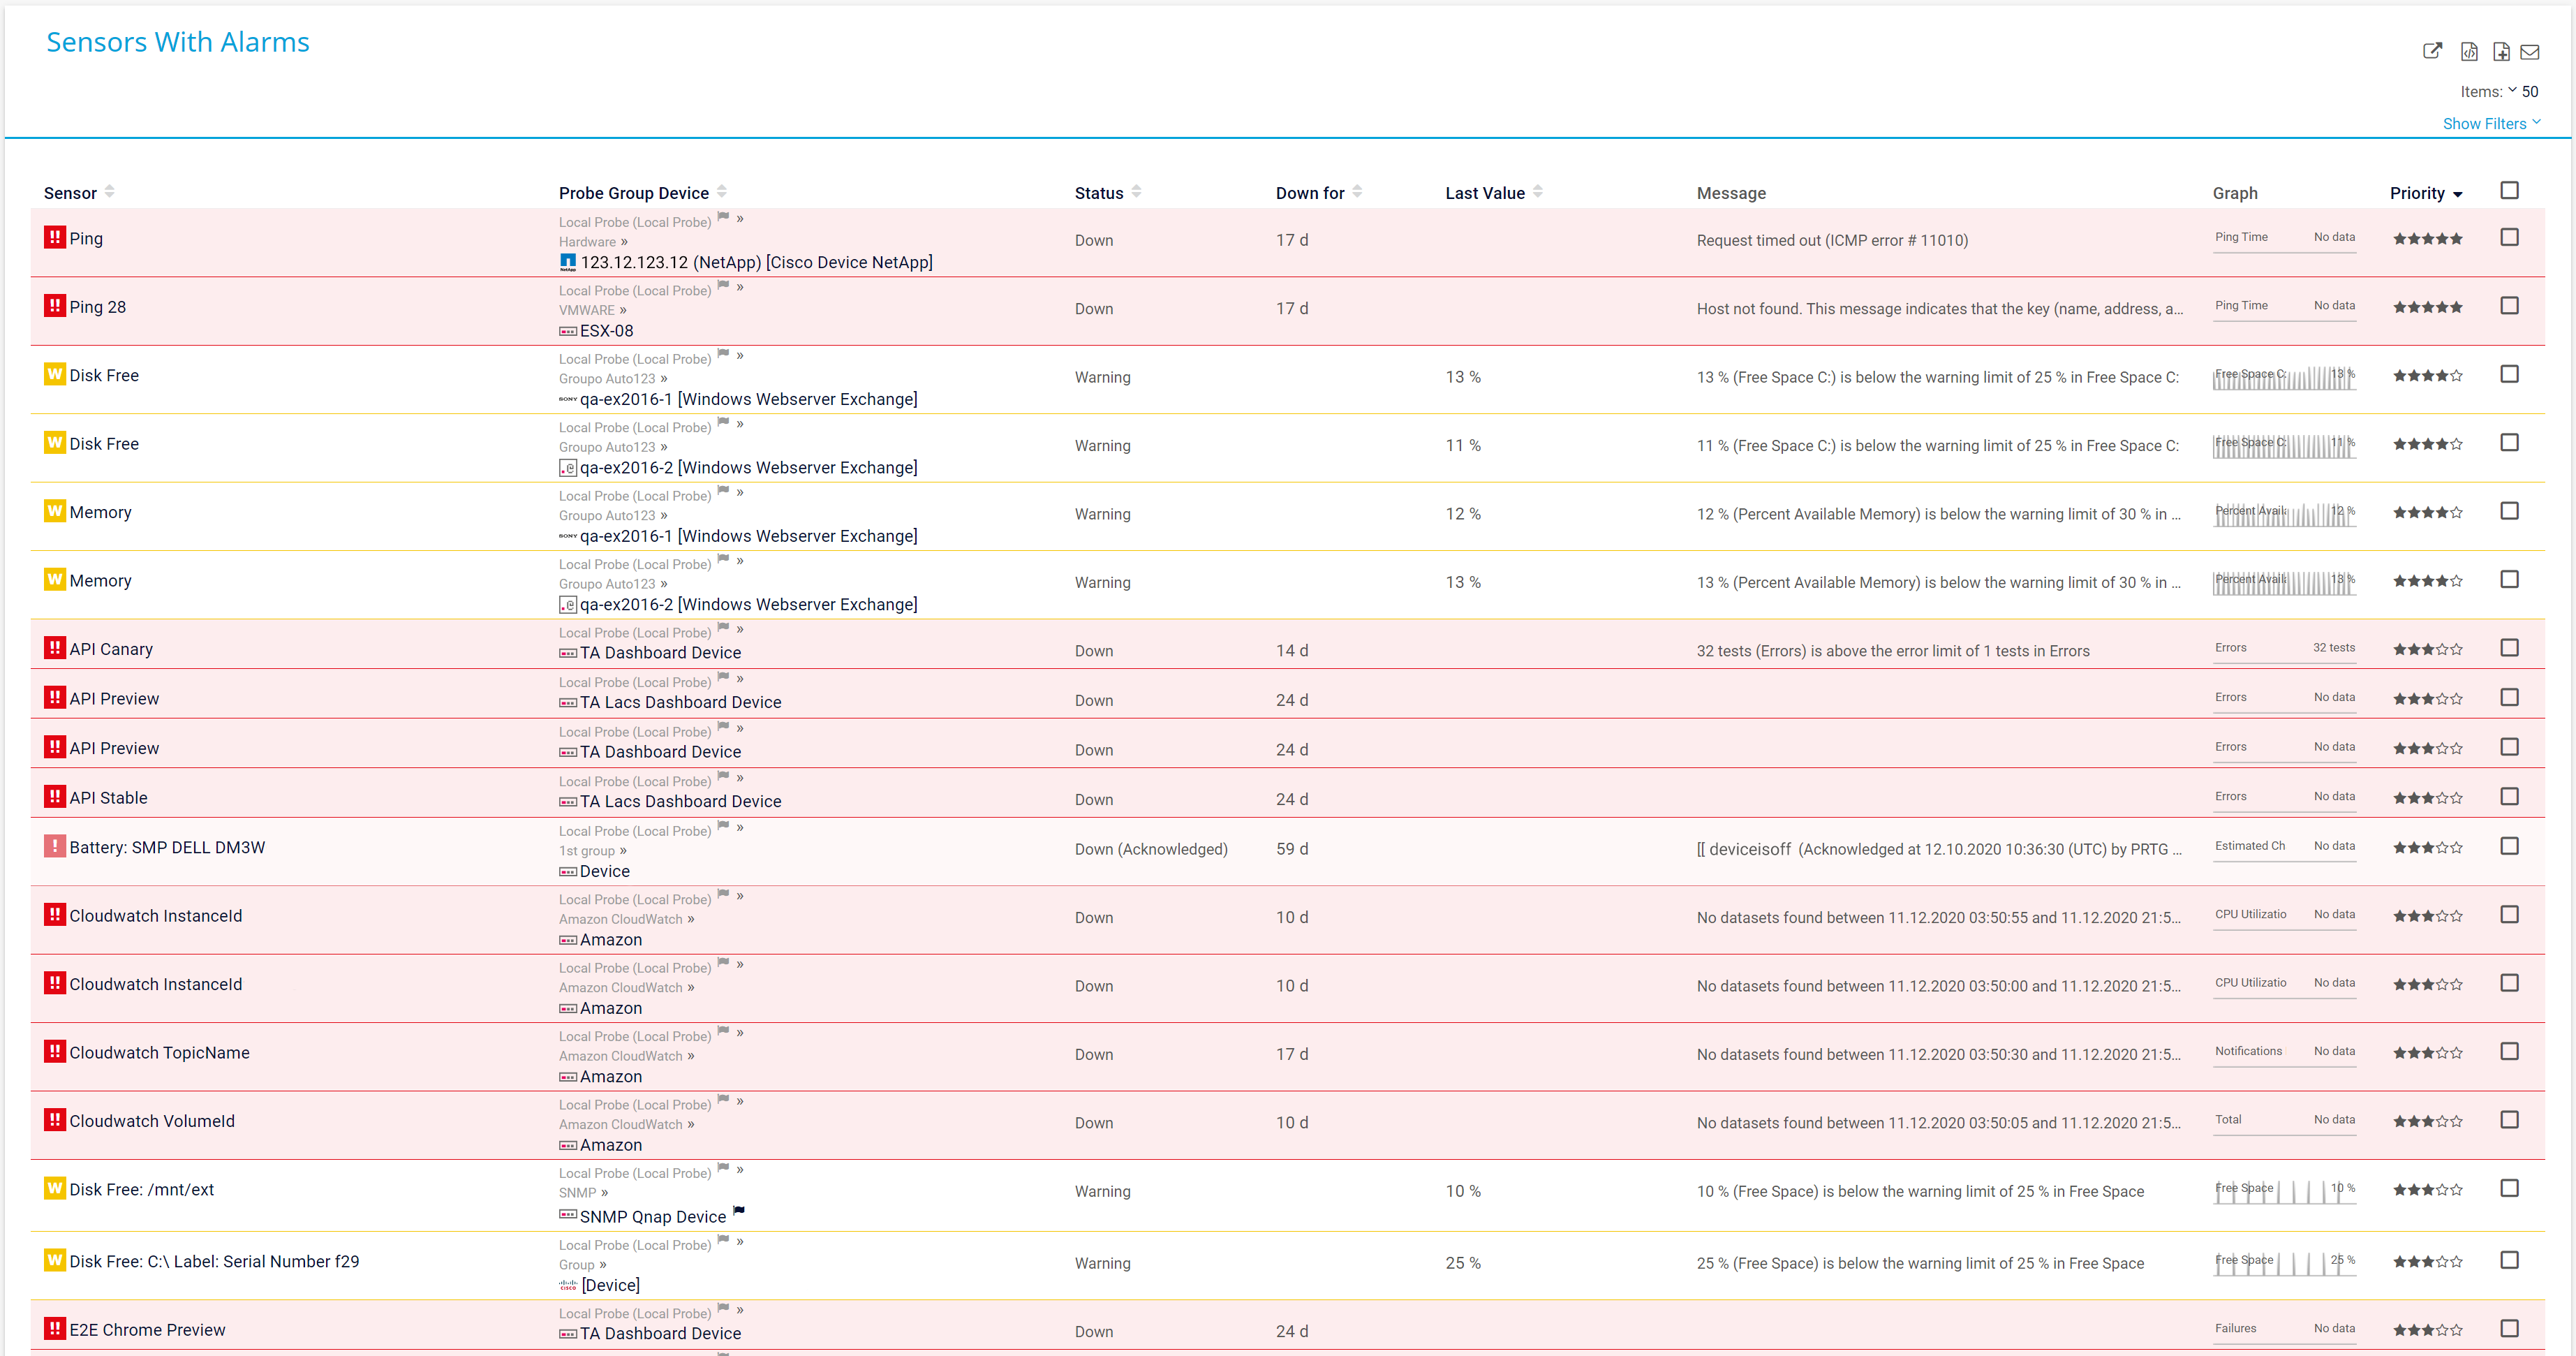
Sensors with alarms overview
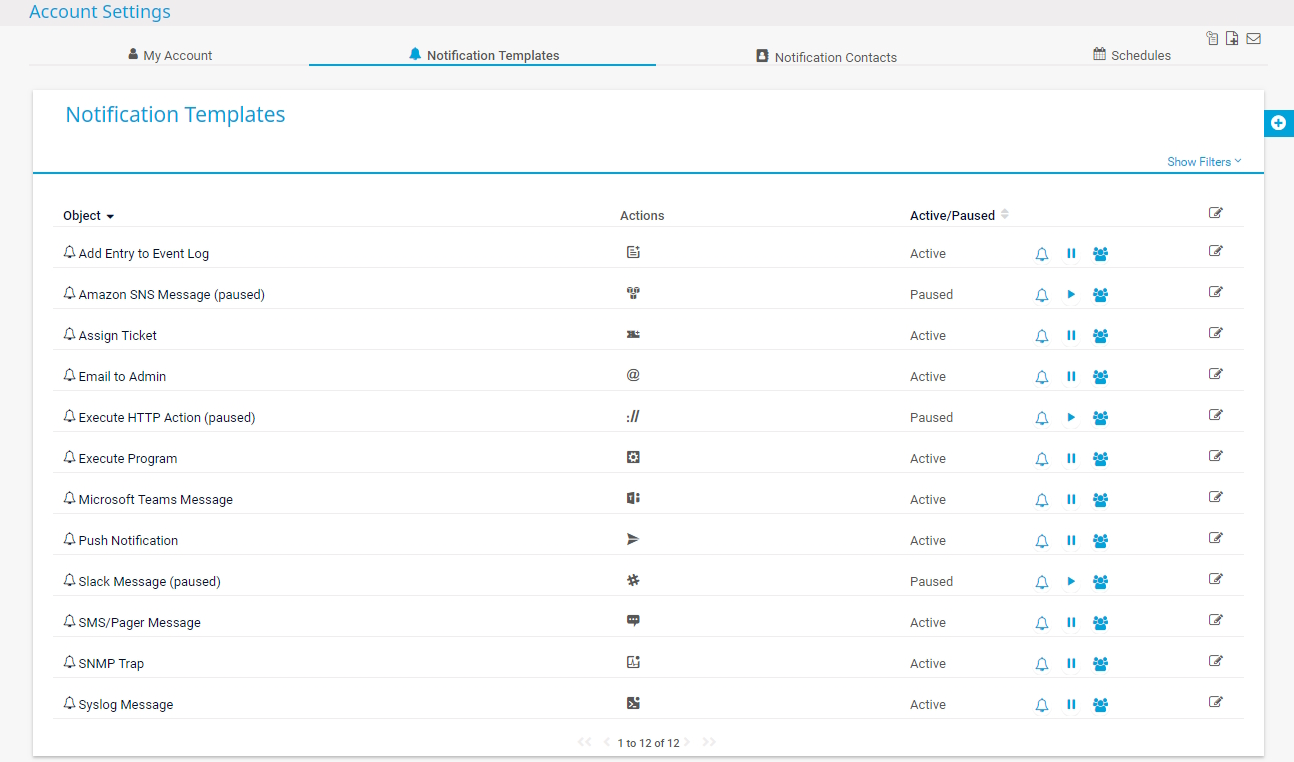
PRTG notification methods

Device tree view of the complete monitoring setup

Custom PRTG dashboard for keeping an eye on the entire IT infrastructure

Live traffic data graph in PRTG
“All-around winning
network monitor”
“The real beauty of PRTG is the endless possibilities it offers”
“PRTG Network Monitor
is very hard to beat”
Errors, disruptions, failures… When a network problem occurs, your Technical Support team gets inundated with complaints – most of which are vague (“My connection is down”).
The cause is often unknown, and can lie in many different places: network devices, bandwidth, applications, or security software. For network administrators, the stress has just begun.
The more complex the IT infrastructure, the more vulnerable it is to errors. Sooner or later, sysadmins have to find a way to maintain the performance and availability of their network. This requires a constant overview of the network’s processes and components.
Our network monitoring tool helps you quickly narrow down the search. Its sensors provide information and clues that enable you to exclude certain causes, saving you time and effort.
PRTG monitors your IT infrastructure 24/7 and alerts you to potential problems before they bring your network down.
Our network troubleshooting tool helps you immediately recognize unusual network loads and minor malfunctions, empowering you to intervene before network problems become network emergencies.
Here are three network troubleshooting steps to identify and resolve all kinds of network issues.
Sysadmins can quickly identify a problem due to the fast, customizable alerts included with the PRTG network monitoring tool.
Most network errors are overlooked until they become critical and cause more serious disruptions.
The quicker you spot a problem, the better. To do so, you’ll need the kind of network overview provided by PRTG.
IT managers usually start out by entering commands such as ping or traceroute in their command line.
Sometimes these methods can quickly root out possible causes – but if not, you’ll need to check if there are connectivity issues like problems with the internet configuration.
However, you can make it all easier by using a comprehensive network troubleshooting tool like PRTG.
Every network problem can be traced to an underlying cause. For example, a hard disk running at full capacity can cause a server to fail, or an overloaded internet connection can lead to Wi-Fi and Ethernet connectivity problems.
A reboot is the most popular solution to these problems, but they do not always address the underlying causes of problems.
However, PRTG network monitor helps you narrow down the causes so you can act faster to solve the issue.
Real-time notifications mean faster troubleshooting so that you can act before more serious issues occur.

Your network may use switches from a variety of different manufacturers, and some are inevitably outdated. All switches must be continually updated or serviced – when they’re not, they’re often at the root of problems.
Malfunctioning switches tend to serve as bottlenecks and can lead to connectivity issues, causing your entire network to suffer. PRTG keeps a constant eye on your switches using, for example, the SNMP Hardware Status or the SNMP Traffic sensor so you can keep them functioning properly.
Many networks use different types of routers from different manufacturers. If a router fails, your LAN and WLAN connections will immediately suffer. Individual ports can also be affected.
PRTG monitors open and closed ports around the clock with the Port v2 sensor. If a port is affected, PRTG will notify you immediately with fast, customizable alerts so you can act before a real emergency occurs.
Set up PRTG in minutes and use it on almost any mobile device.

Partnering with innovative IT vendors, Paessler unleashes synergies to create
new and additional benefits for joined customers.
Paessler and Plixer provide a complete solution adding flow and metadata analysis to a powerful network monitoring tool.
baramundi and PRTG create a secure, reliable and powerful IT infrastructure where you have everything under control - from the traffic in your firewall to the configuration of your clients.
Rhebo and PRTG offer a comprehensive monitoring solution for IT and OT environments: from condition monitoring through to anomaly and threat detection.
Custom alerts and data visualization let you quickly identify and prevent network connection issues.
Network Monitoring Software – Version 26.1.116.1532 (February 9th, 2026)
Download for Windows and cloud-based version PRTG Hosted Monitor available
English, German, Spanish, French, Portuguese, Dutch, Russian, Japanese, and Simplified Chinese
Network devices, bandwidth, servers, applications, virtual environments, remote systems, IoT, and more
Choose the PRTG Network Monitor subscription that's best for you


Network troubleshooting, or network debugging, is the systematic process of identifying, diagnosing, and resolving problems within a computer network, for example performance issues. The aim is to ensure the smooth and efficient operation of the network by addressing issues that can affect network connectivity, performance, and security.
Troubleshooting your local network or WAN is essential for several reasons:
A network monitoring tool like PRTG can significantly accelerate the troubleshooting process by providing real-time insights, historical data, and automated alerts.
Find typical command prompts on Windows in the following:
In PRTG, “sensors” are the basic monitoring elements. One sensor usually monitors one measured value in your network, for example the traffic of a switch port, the CPU load of a server, or the free space on a disk drive. On average, you need about 5-10 sensors per device or one sensor per switch port.
Paessler conducted trials in over 600 IT departments worldwide to tune its network monitoring software closer to the needs of sysadmins. The result of the survey: over 95% of the participants would recommend PRTG – or already have.

Paessler PRTG is used by companies of all sizes. Sysadmins love PRTG because it makes their job a whole lot easier.
Bandwidth, servers, virtual environments, websites, VoIP services – PRTG keeps an eye on your entire network.
Everyone has different monitoring needs. That’s why we let you try PRTG for free.