![]()
WAN monitoring with PRTG:
a hub for distributed networks

Centralized monitoring
Agentless software
Alarm feature included
Customizable
WAN monitoring with PRTG
Two main PRTG components for successful WAN monitoring
![]()
Local probe for your hub
Install PRTG in the environment which is primarily used to manage your IT infrastructure. Once the PRTG server has been installed, a local probe will automatically be created on the same computer. This local probe performs the monitoring and transfers data to the underlying core server.
![]()
Remote probe for your WAN
Install a remote probe on a computer in another location. This remote probe will monitor the network in that location and send data back to the PRTG core server. The installation takes a few short minutes.
Simple local networks to those spanning the globe: 3 best practices
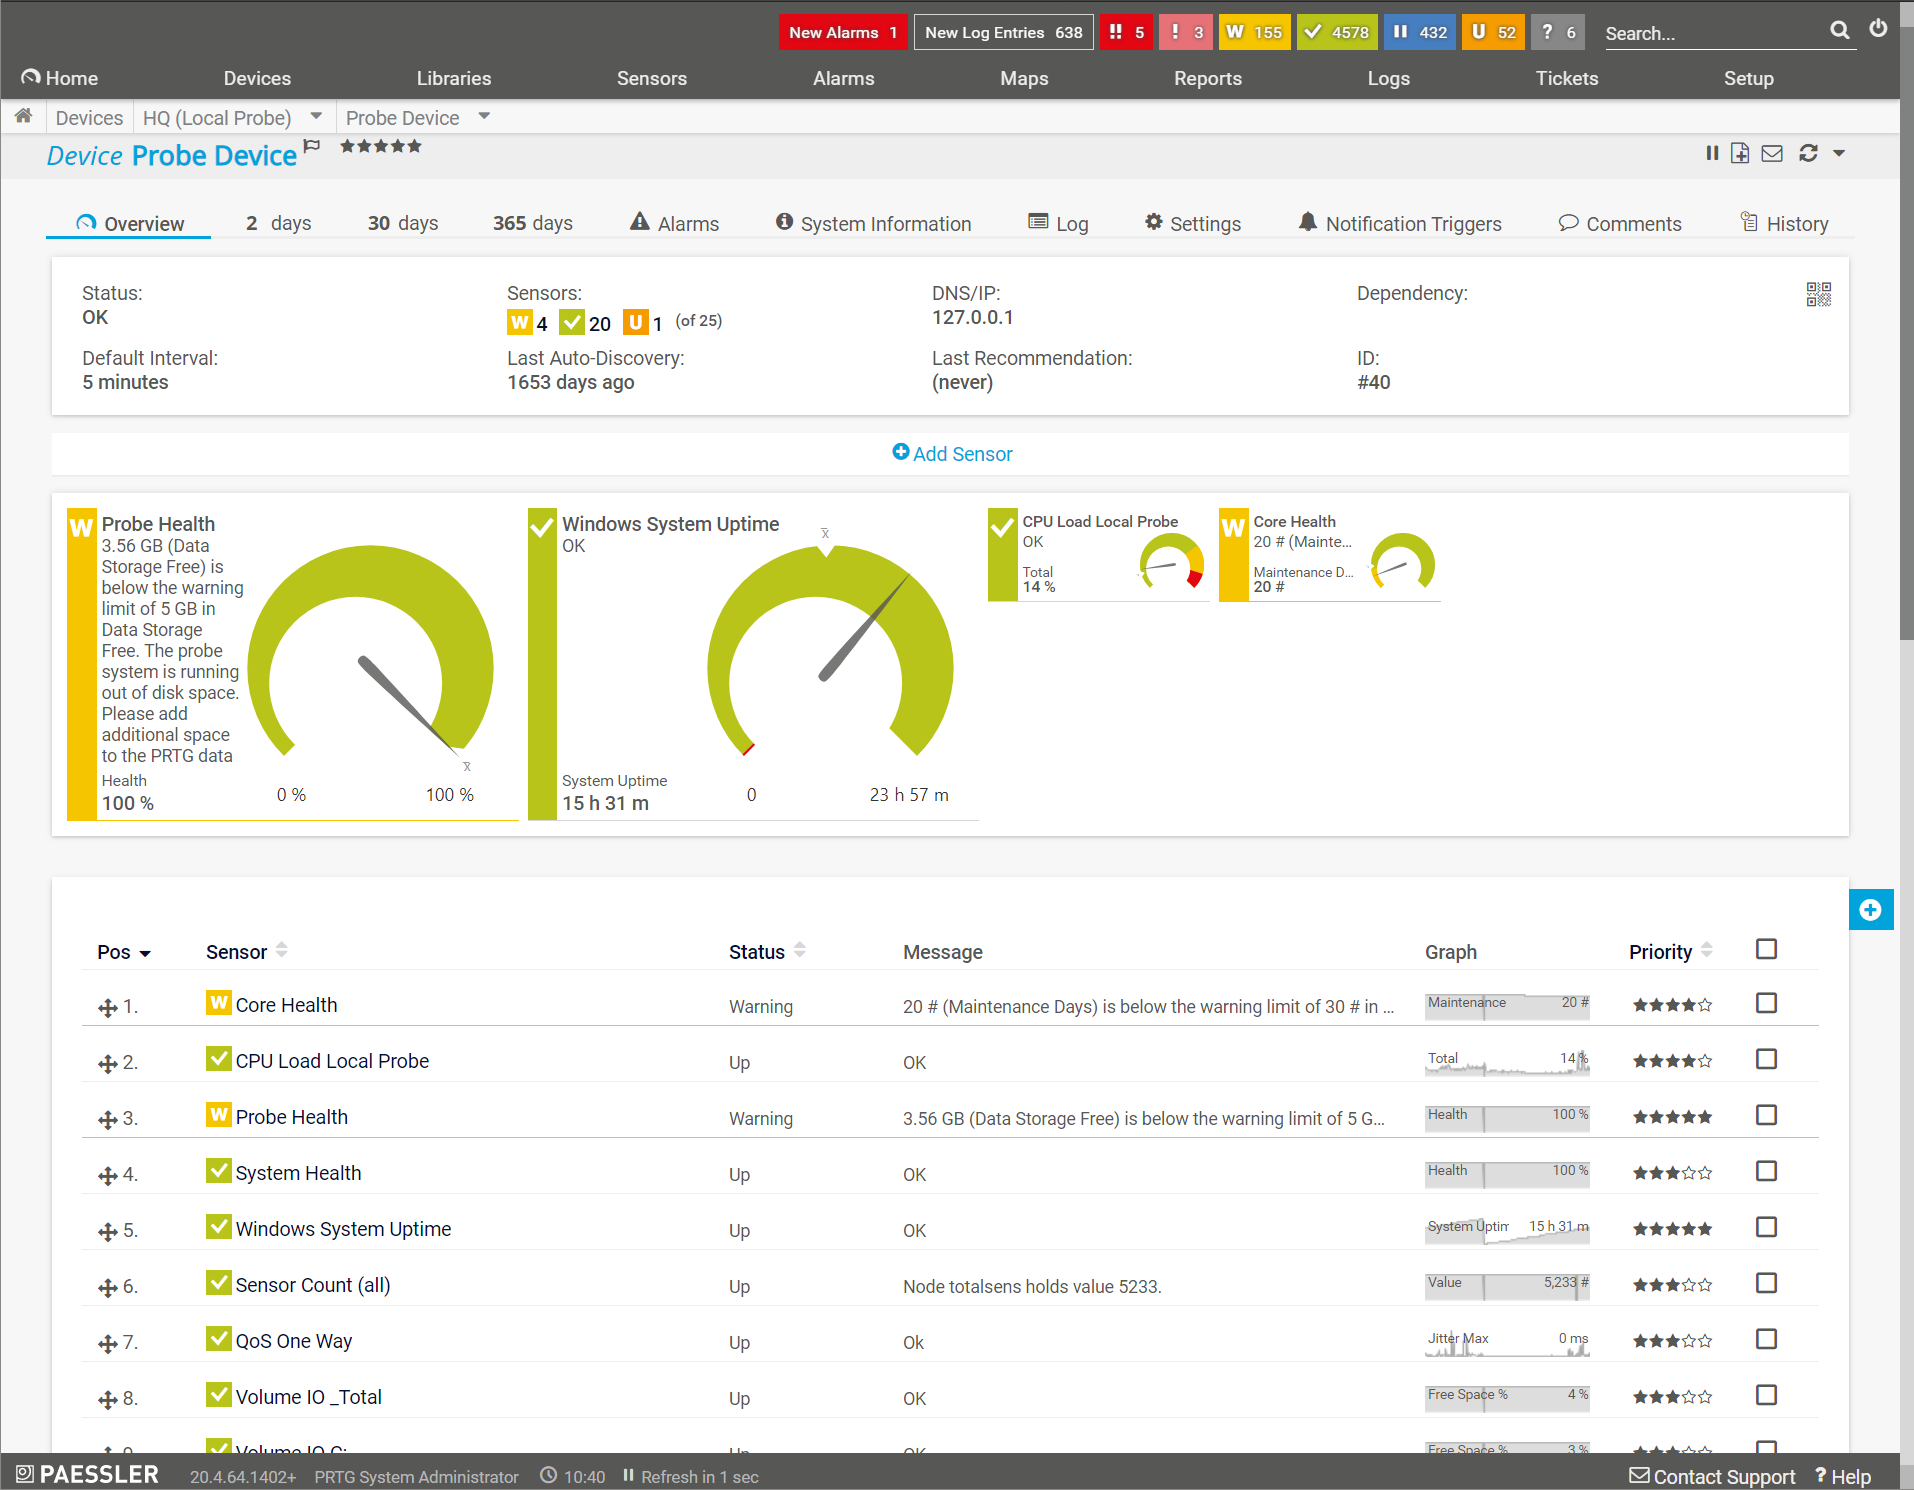
![]() How PRTG defines sensors
How PRTG defines sensors
In PRTG, “sensors” are the basic monitoring elements. One sensor usually monitors one measured value in your network, e.g. the traffic of a switch port, the CPU load of a server, the free space of a disk drive. On average you need about 5-10 sensors per device or one sensor per switch port.
![]()
Organizations
Many colleges, cities, and public utilities have distributed infrastructures that are confined to a specific area. One such example is Stadtwerke Frankenthal in southern Germany, which is responsible for the region’s waterworks and swimming pools. PRTG is used to monitor this organization’s 80 servers and 200 devices. ➔ To the case study [German/l]
![]()
Companies
Many companies have locations around the world, which they wish to monitor with a single WAN monitor tool. One such company is Pepe Jeans, whose IT department uses more than 6,000 PRTG sensors to monitor its LAN – as well as its WAN in over 350 locations worldwide. ➔ To the case study
![]()
IT service providers
Even IT service providers use PRTG. Example: managed service providers (MSPs), who monitor customer networks remotely and are responsible, among other things, for VoIP, network security, and other technical support. Many MSPs use PRTG for their monitoring ➔ More information for MSPs
Why WAN monitoring makes sense
![]()
Maximize availability
Distributed networks are infamous for crashing. When crashes occur, all work at the respective location comes to a halt. WAN monitoring software lets you keep a constant eye on all your networks and optimize your WAN. You'll therefore maximize the uptime and availability of your entire IT infrastructure, and ensure your company works with the utmost efficiency.
![]()
Save time, energy, and money
When the network is down or malfunctioning, it doesn’t take long before the first help tickets start piling in. Most administrators access the computers and systems of a location remotely. But sometimes it’s not that easy. Certain problems make it necessary for sysadmins to travel to the location, which can cost a great deal of time and money. This expense can be reduced with WAN monitoring tools.
![]()
Take prompt action
Most problems start small. Let’s look at hardware: it’s quite common for routers or switches to fail for short periods of time. But these malfunctions accumulate – until the network crashes entirely. With PRTG, you'll recognize the very first signs of errors or disruptions and can take action at once. At the same time, you can configure the alarm feature to ensure you are not notified for every little disturbance.
![]()
“We can all work with greater peace of mind knowing
that our systems are constantly being monitored.”
Markus Puke, Network Administrator, Schüchtermann Klinik, Germany
Why PRTG is the perfect WAN monitoring tool
![]()
A hub for your WAN
PRTG is a centralized WAN monitoring tool for your entire IT infrastructure. It monitors systems, devices, bandwidth, and applications. All information is consolidated on an easy-to-read dashboard. You can therefore keep a constant eye on your network.
![]()
Agentless WAN monitoring
PRTG is agentless WAN monitoring software. You don’t have to install any software on your target computers. Simply install a remote probe on a computer in one of your distributed networks. This remote probe will collect your data and send it to the core server upon which PRTG is installed.
![]()
Customizable
PRTG WAN monitoring is fully customizable. You get to decide which – and to what extent – hardware and applications in your wide area network get monitored. PRTG licenses can be upgraded at any time. This means you won’t have to set up your monitoring all over again.
![]() LPWA stands for Low-Power Wide-Area. It does not refer to any one specific technology, but rather serves as a generic term for any network designed to communicate wirelessly with lower power than other networks such as cellular, satellite, or WiFi. Moreover, LPWANs communicate over greater distances than other low-power networks that use Bluetooth or NFC, for example.
LPWA stands for Low-Power Wide-Area. It does not refer to any one specific technology, but rather serves as a generic term for any network designed to communicate wirelessly with lower power than other networks such as cellular, satellite, or WiFi. Moreover, LPWANs communicate over greater distances than other low-power networks that use Bluetooth or NFC, for example.
Read more
Monitoring WAN traffic and devices: Some sensors for immediate results
SNMP sensors
SNMP sensors allow you to monitor all your hardware, including servers, routers, and switches. PRTG comes with a variety of preconfigured SNMP sensors designed for several different manufacturers.
More on SNMP monitoring
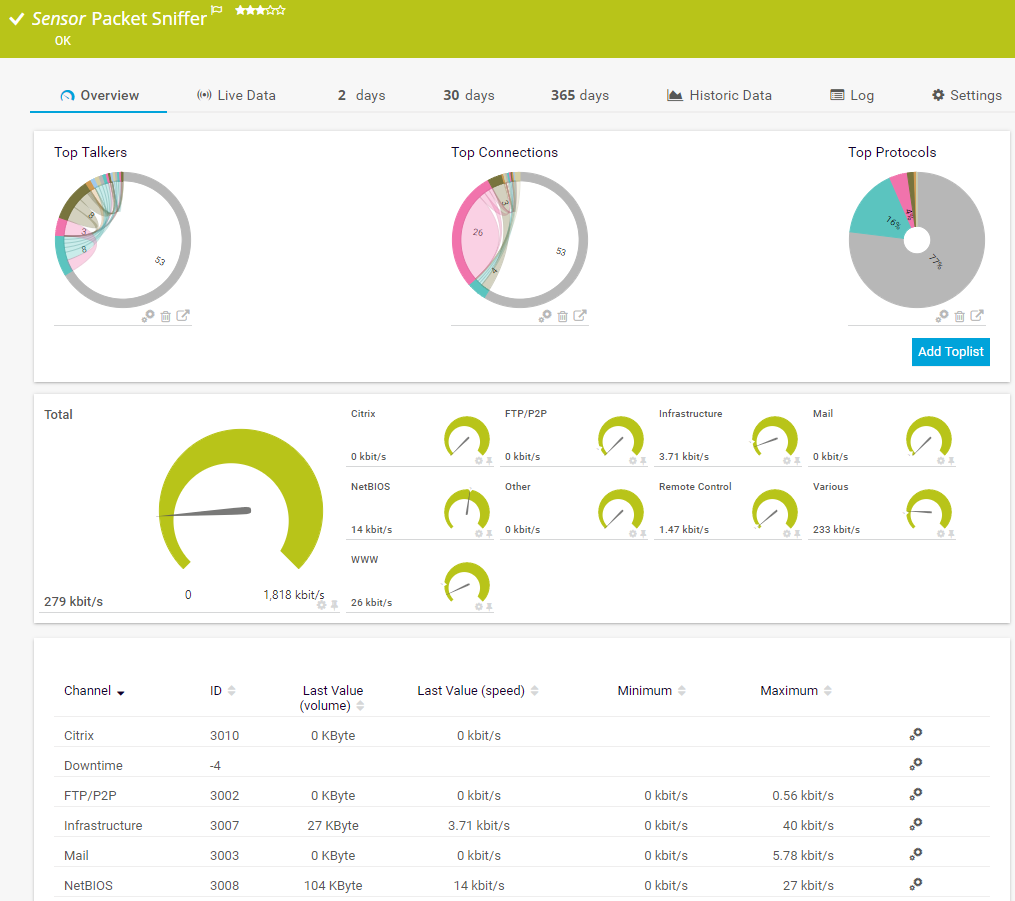
Packet Sniffer sensor
The Packet Sniffer sensor lets you monitor data packets and filter according to IP addresses, protocols, and types of data.
More on packet sniffing
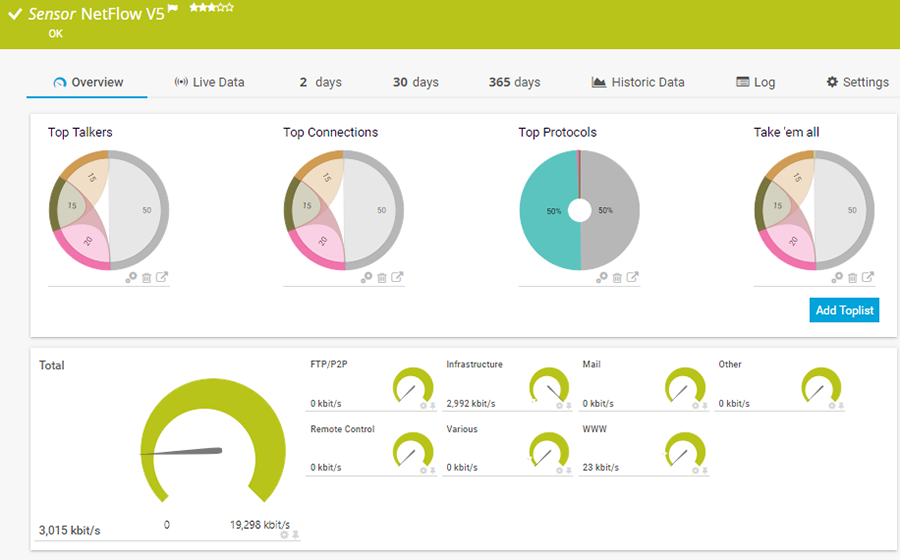
NetFlow sensors
PRTG NetFlow sensors let you monitor your bandwidth and traffic. The NetFlow protocol is mainly used on Cisco devices. PRTG is also compatible with other Flow technologies.
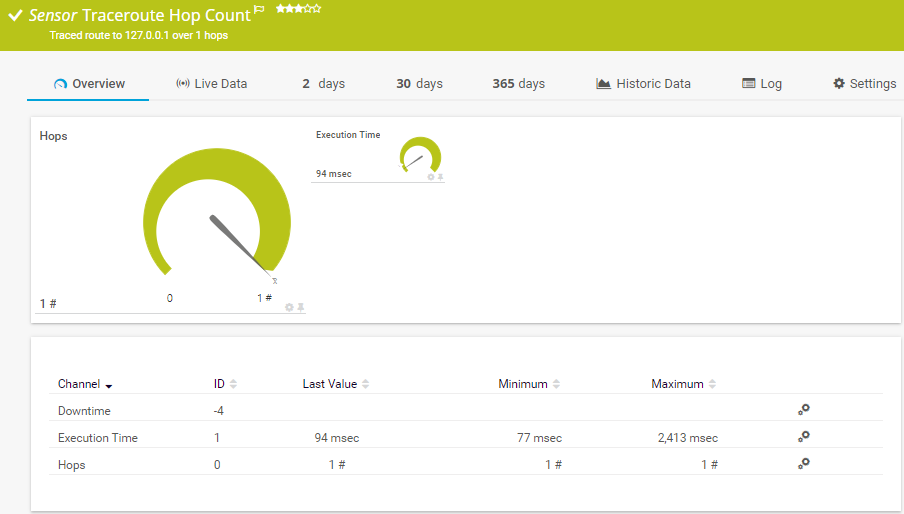
Traceroute Hop Count sensor for your WAN
How many hops does a data packet need to reach its destination? This is especially valuable information when dealing with wide area networks – for if data packets take “detours,” then delays are bound to arise. The Traceroute Hop Count sensor lets you monitor these "hops.”
3 easy steps for installing a remote probe
![]()
Set up your PRTG core server
To configure your probe connections, first click on “Core & Probes” in “System Administration.” Then set the PRTG server to allow remote probe connections.
![]()
Install the remote probe
Search for the “Remote Probe Installer” in Setup | Download and Tools. Download the installer on a computer in the part of your WAN where you wish to set up your monitoring, then run the program. The remote probe automatically connects to the PRTG server once you have confirmed the connection in PRTG. Be sure the firewall isn’t blocking the remote probe. The default port number is 23560.
![]()
Start monitoring
Finally, set up your monitoring in the location housing the remote probe. You will find the remote probes in your device tree. You can now create the devices from the target network and add the necessary sensors.
![]()
Additional information
A comprehensive description (including screenshots) can be found in the PRTG manual. We also offer helpful tips in our knowledge base, such as how to use multiple remote probes.
Trusted by 500,000 users and recognized
by industry analysts as a leader

“Fantastic network and infrastructure monitoring solution that is easy to deploy and easier still to use. Simply the best available.”

“Software is absolutely perfect, Support is superior. Meets all needs and requirements, this is a must have solution if you are needing any form of monitoring.”

“The tool excels at its primary focus of being a unified infrastructure management and network monitoring service.”
PRTG provides for a reliable WAN connection
Set up PRTG in minutes and use it on almost any mobile device.


FAQ: Four questions on WAN availability
How can I improve VoIP in the WAN?
Bad VoIP connections are usually a sign of insufficient bandwidth. If bandwidth is too low, the network can become overloaded by certain applications or programs. PRTG lets you identify the applications and data that are putting the greatest strain on your network. You can subsequently make a sound decision on the best way to improve your VoIP – e.g. by increasing your bandwidth.
More on VoIP monitoring with PRTG
How can I improve latency in the WAN?
Every sysadmin should know the latency values of their WAN, for latency is often the cause of poor WAN performance. Latency always has consequences. It must therefore be kept within reasonable limits. Latency spikes lead to malfunctions or lost connections. With PRTG, you can monitor latency continuously and be immediately alerted in the event of a drop in performance – giving you plenty of time to fix a problem before users catch on.
Is it possible to measure WAN latency via a simple ping test?
You can of course enter an individual ping command to obtain a one-time measurement of latency. But such a test will only provide you with a single measurement point. PRTG lets you monitor WAN latency around the clock, and thus gives you the bigger picture. You'll be able to tell, for example, if latency tends to spike at certain times and not at others.
With ping monitoring, you can monitor availability at any time of the day or night.
What should I do about packet loss in the WAN?
Data packets may get lost in a WAN as they make their way from one computer to another. Overloaded routers or switches are two possible causes of packet loss. But which router or switch should you replace in the WAN? You'll need an overview of your entire network to know for sure. That’s where PRTG comes in.
PRTG makes your job easier
Our monitoring software frees you to focus on other tasks by promptly notifying you of potential issues.
![]()
Save effort
PRTG gives you one central monitoring tool for your servers and entire network. Enjoy a quick overview of your whole infrastructure via our dashboard and app.
![]()
Save time
Getting started with PRTG is a breeze. Setting up or switching from another network monitoring tool is easy thanks to the auto-discovery and pre-configured device templates.
![]()
Save money
80% of our customers report substantial cost savings with network monitoring. Your costs of licenses will likely pay for themselves within weeks.
“Easy to implement and configure with good technical support.”
R. v. S., ICT Manager at Heinen & Hopman Eng BV

PRTG: The multi-tool for sysadmins
Adapt PRTG individually and dynamically to your needs and rely on a strong API:- HTTP API: Access monitoring data and manipulate monitoring objects via HTTP requests
- Custom sensors: Create your own PRTG sensors for customized monitoring
- Custom notifications: Create your own notifications and send action triggers to external systems
- REST Custom sensor: Monitor almost everything that provides data in XML or JSON format
We asked: would you recommend PRTG?
Over 95% of our customers say yes!
Paessler AG conducted trials in over 600 IT departments worldwide to tune its network monitoring software closer to the needs of sysadmins.
The result of the survey: over 95% of the participants would recommend PRTG – or already have.

Create innovative solutions with Paessler’s partners
Partnering with innovative vendors, Paessler unleashes synergies to create
new and additional benefits for joined customers.


ScriptRunner
With ScriptRunner, Paessler integrates a powerful event automation platform into PRTG Network Monitor.
Still not convinced?
![]()
More than 500,000 sysadmins love PRTG
Paessler PRTG is used by companies of all sizes. Sysadmins love PRTG because it makes their job a whole lot easier.
Still not convinced?
![]()
Monitor your entire IT infrastructure
Bandwidth, servers, virtual environments, websites, VoIP services – PRTG keeps an eye on your entire network.
![]()
Try Paessler PRTG for free
Everyone has different monitoring needs. That’s why we let you try PRTG for free. Start now with your trial.
|
PRTG |
Network Monitoring Software - Version 24.2.94.1400 (April 10th, 2024) |
|
Hosting |
Download for Windows and cloud-based version PRTG Hosted Monitor available |
Languages |
English, German, Spanish, French, Portuguese, Dutch, Russian, Japanese, and Simplified Chinese |
Pricing |
Up to 100 sensors for free (Price List) |
Unified Monitoring |
Network devices, bandwidth, servers, applications, virtual environments, remote systems, IoT, and more |
Supported Vendors & Applications |
|
Combining the broad monitoring feature set of PRTG with IP Fabric’s automated network assurance creates a new level of network visibility and reliability.