• Company
    • About Us
    • Case Studies
    • Press Center
    • Careers
    • Blog
    • Contact us
  • Contact us
  • Login
 
  • English
    • Deutsch
    • Español
    • Français
    • Italiano
    • Português
Paessler
                    - The Monitoring Experts
  • Products
    • Paessler PRTG
      Paessler PRTGMonitor your whole IT infrastructure
      • PRTG Network Monitor
      • PRTG Enterprise Monitor
      • PRTG Hosted Monitor
      • PRTG UVexplorer
      • PRTG extensionsExtensions for Paessler PRTGExtend your monitoring to a new level
    • Icon Features
      FeaturesExplore all monitoring features
      • Maps & dashboards
      • Alerts & notifications
      • Multiple user interfaces
      • Distributed monitoring
      • Customizable reporting
  • Solutions
    • Industries
      IndustriesMonitor various industry sectors
      • Industrial
      • Healthcare
      • Data Center
      • Education
      • Finance
      • Government
    • IT Topics
      IT TopicsMonitor all areas of IT
      • Network Monitoring
      • Bandwidth Monitoring
      • SNMP Monitor
      • Network Mapping
      • WiFi Monitoring
      • Server Monitoring
  • Pricing
  • Resources
    • Getting Started
      Getting StartedModules for self-paced learning
    • How-to Guides
      How-to GuidesGet the most out of PRTG
    • Videos & Webinars
      Videos & WebinarsLearn from Paessler experts
    • IT  Knowledge
      IT KnowledgeExpand your IT knowledge
    • PRTG Manual
      PRTG ManualFull documentation
    • Knowledge Base
      Knowledge BaseShare community knowledge
    • PRTG Sensor Hub
      PRTG Sensor HubGet sensors, scripts & templates
    • Trainings
      PRTG TrainingLearn how to work with PRTG
  • Partners
    • Icon Handshake
      Become a PartnerFor resellers and channel partners
    • Icon MSP
      Become an MSPDeliver monitoring as a managed service
    • icon partner
      Partner PortalLog in to your partner account
    • Deal Registration
      Deal RegistrationRegister your sales opportunities
    • icon search
      Find a PartnerFind partners selling Paessler products
    • icon technology
      Technology AlliancesSee Paessler technology partnerships
    • Partner HubTools for Your Success
  • Company
    • About Us
    • Case Studies
    • Press Center
    • Careers
    • Blog
    • Contact us
  • Contact us
  • Login
  • English
    • Deutsch
    • Español
    • Français
    • Italiano
    • Português
  • Get a quote
  • Free trial
  1. Home>
  2. IT Topics>
  3. Network>
  4. Uptime Monitoring Tool

Ensure Reliable Uptime Monitoring with PRTG

Ensure your network’s continued availability at all times

  • Continuously monitor and analyze uptime across your infrastructure
  • Get alerted promptly of unexpected downtimes in your network
  • Give customers real-time status updates in case of outages
Free download
PRODUCT OVERVIEW

Our Users Give Top Ratings for Monitoring With Paessler PRTG

Gartner peer insights
spiceworks
G2
Capterra

PRTG uptime monitoring: What you will find on this page

Table of content

    PRTG makes uptime monitoring as easy as it gets

    Custom alerts and data visualizations let you quickly identify and prevent slow response times, bottlenecks, downtime, and other network availability issues.

    Free download
    PRODUCT OVERVIEW

    Five nines for the uptime win

    It's the number every sysadmin strives for: 99.999% uptime. It doesn't get more stable and reliable than that.

    But, with so many variables that could impact your network's performance, hitting that mythical benchmark can seem as likely as becoming an overnight millionaire.

    With more than 250 preconfigured sensors for monitoring your entire network, Paessler PRTG uptime monitoring software can continuously track servers, routers, switches, applications, virtual machines, and every other component that could fail and cause disruption, alerting you as soon as your network's uptime is at risk.

    That means more availability, less unplanned downtime, and happier colleagues, higher-ups, and customers.

    Table of content

    4 reasons why to choose PRTG as your uptime monitoring software

    Icon setup

    Smart setup

    Just install PRTG with a few clicks and let the automatic network discovery ping your chosen IP address range. PRTG automatically detects any devices in that range that are connected to your network and adds the sensors you need to monitor their uptime and other key metrics for you to configure as needed later. Could it be any simpler?

    Icon Alarm

    Automatic alerts

    Get in front of potential issues, before they cause real problems. Set your preferred thresholds, and PRTG will sound the alarm via SMS, email, Slack message, in-app push notification, webhook, and other methods, as soon as a device is down. You can even automatically inform customers in real time if a potential outage might affect them – no false positives included.

    Icon Document

    Proactive planning

    Knowledge is power. PRTG's uptime monitoring service doesn't only help you spot and fix issues and optimize your network. Just as important, its wealth of historic data enables you to anticipate your network's medium and long-term needs. Which means you can have the peace of mind to plan ahead instead of scrambling to catch up.

    Icon compatibility

    Wide compatibility

    PRTG works with most major manufacturers and infrastructure providers, including AWS, Azure, Cisco, Dell, Oracle, and HPE, and uses standard protocols to collect data. Can't find a preconfigured sensor or other functionality for your preferred vendor or technology? Create your custom sensor using Python script or the PRTG API.

    What uptime monitoring looks like in PRTG

    Diagnose network issues by continuously tracking servers, routers, switches, applications, virtual machines, web servers, and other network components. Show uptime, page speed, SSL certificate expiry, bandwidth, hardware health, and other key metrics in real time. Visualize uptime monitoring data in clear graphs and dashboards to identify problems more easily. Gain the overiew you need to troubleshoot bottlenecks, downtime, and other network performance problems, and enhance overall end-user experience.

    PRTG Screenshot device tree view

    Device tree view of the complete monitoring setup

    PRTG screenshot map entire it infrastructure

    Custom PRTG dashboard for keeping an eye on the entire IT infrastructure

    PRTG screenshot graph live data traffic

    Live traffic data graph in PRTG

    Start uptime checks with PRTG and see how it can make your network more reliable and your job easier.

    Free download
    PRODUCT OVERVIEW

    IT experts agree: Paessler PRTG is a great solution for IT infrastructure monitoring

    PCMag

    “All-around winning
     network monitor”

    IT Brief

    “The real beauty of PRTG is the endless possibilities it offers”

    ITPro

    “PRTG Network Monitor 
    is very hard to beat”

    Explore our preconfigured PRTG sensors for uptime monitoring

    PRTG comes with more than 250 native sensor types for monitoring your entire on-premises, cloud, and hybrid cloud environment out of the box. Check out some examples below!

    Ping v2

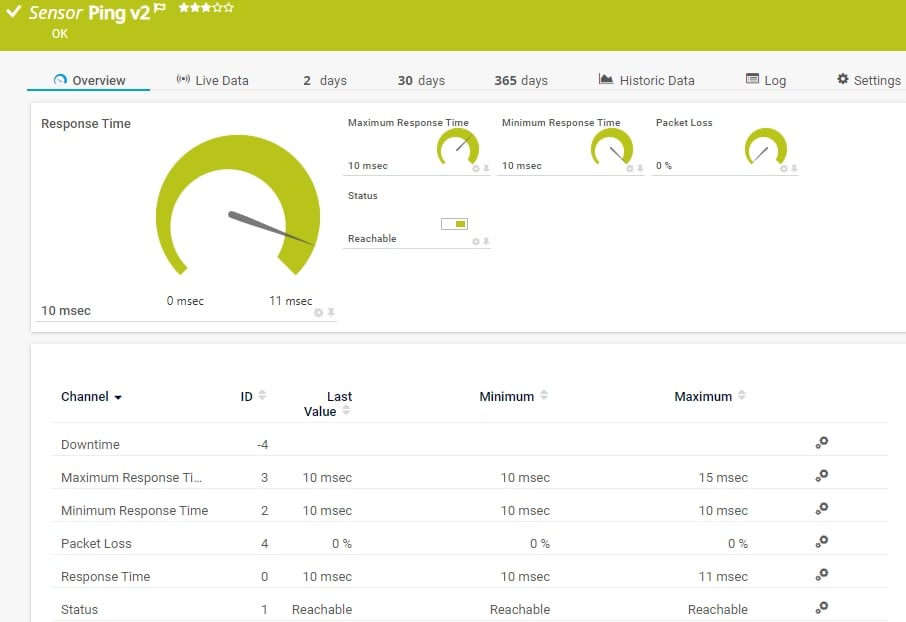
    The Ping v2 sensor sends an Internet Control Message Protocol (ICMP) echo request ("ping") from the probe system to the parent device to monitor its availability. It can show the following:

    • Response time

    • Packet loss

    • Target status

    • Minimum and maximum ping time

    Ping v2
    Ping v2

    Windows System Uptime

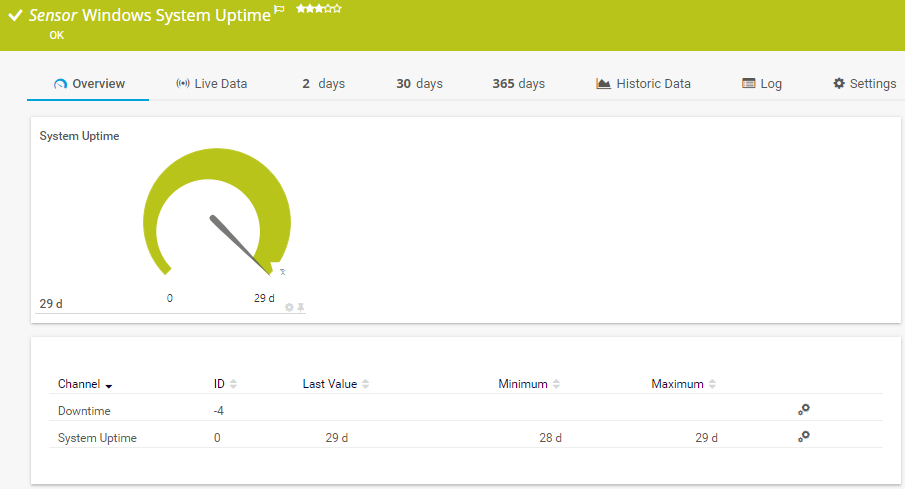
    The Windows System Uptime sensor monitors the uptime of a Windows system via Windows Management Instrumentation (WMI) or Windows performance counters. It can show the following:

    • Downtime
    • System uptime
    Windows System Uptime
    Windows System Uptime

    SNMP Uptime v2

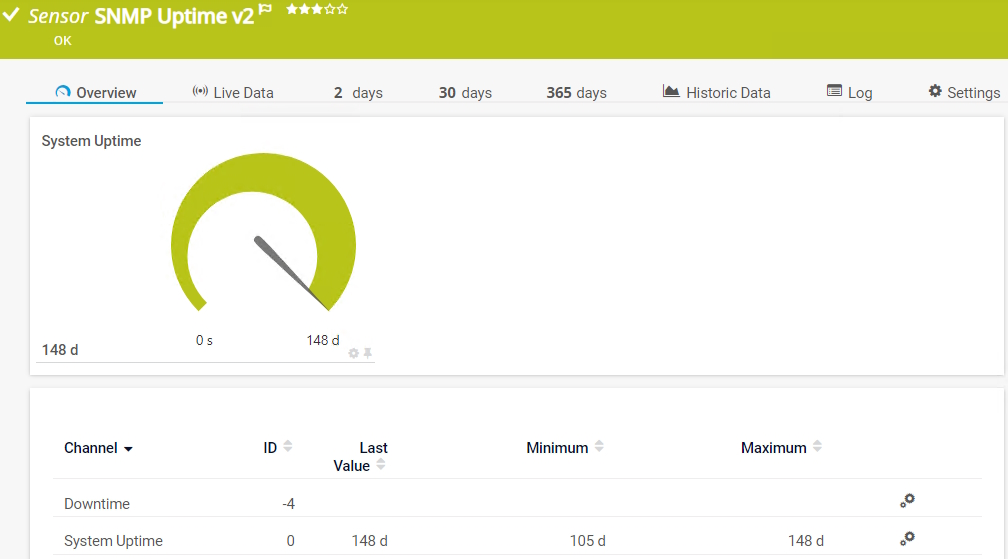
    The SNMP Uptime v2 sensor monitors the uptime of a device. It can show the following:

    • Downtime
    • System uptime
    SNMP Uptime v2
    SNMP Uptime v2

    Multi-Platform Probe Health

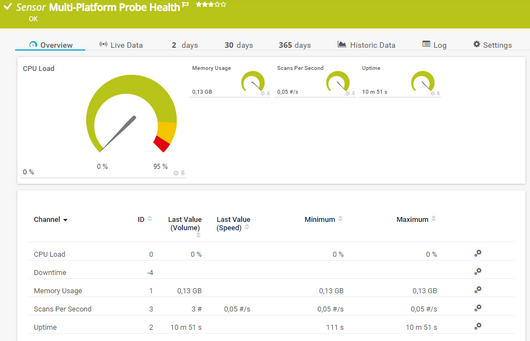
    The Multi-Platform Probe Health sensor monitors the status of a multi-platform probe device. It can show the following:

    • CPU load
    • Memory usage
    • Number of scans per second
    • Uptime
    Multi-Platform Probe Health
    Multi-Platform Probe Health

    See the PRTG Manual for a list of all available sensor types.

    PRTG Is Compatible With All Major Vendors, Products, and Systems

    compatible with all major vendors, products, and systems

    PRTG makes uptime monitoring as easy as it gets

    Custom alerts and data visualization let you quickly identify and prevent slow response times, bottlenecks, downtime, and other network availability issues.

    Free download
    PRODUCT OVERVIEW

    ”Adopting PRTG has been like going from being in the dark to being in the light. Before, we had limited visibility into what was happening in the infrastructure and in the network. Now, however, thanks to the comprehensive dashboard and real-time notifications, we receive constant updates on the status of facilities and services, and our way of working has gone from passive to proactive.”

    Luca Meneghesso, Senior IT infrastructure and Security Specialist
    Banca Profilo

    ”GESAC increasingly focuses on innovation to improve the quality of services offered and the experience of passengers handled every day by Naples Airport. Thanks to PRTG, we finally have unified, automatic, and continuous monitoring of the airport network and can guarantee quick and timely interventions.”

    Domenico Ciervo, GESAC ICT Manager
    Naples International Airport

    ”As an international company, PRTG is ideal for us. If something went down half way across the world, we wouldn’t be woken up – we can rely on PRTG to identify the problem and alert us before it occurs – enabling the right person, in the right time zone to resolve the problem. At the end of the day, if we’re to provide an internal network experience for our employees that meets expectations, we need a tool like PRTG to be successful.”

    Barry Kelly, Systems Engineer
    Skyscanner

    “I would recommend PRTG because it has helped us significantly improve service uptime by highlighting important alerts that would otherwise result in a system failure or service disruption if action was not taken. Thanks to PRTG, we can ensure that The Ritz London’s network and IT systems are five-star, just like the hotel.”

    Richard Isted, IT Manager
    The Ritz London

    Your uptime monitor at a glance – even on the go

    PRTG is set up in a matter of minutes and can be used on a wide variety of mobile devices.

    device overview
    Gartner peer insights

    “Great interface, intuitive, full REST support. custom scripts, rest sensors add extra value. We have been using PRTG for 10 years now in multiple environments and use cases. it has by far the best interface and very easy to setup without prior experience.”

    Read the complete review at Gartner Peer Insights

    Create innovative solutions with Paessler’s IT partners

    Partnering with innovative IT vendors, Paessler unleashes synergies to create
    new and additional benefits for joined customers.

    IP Fabric

    IP Fabric

    Combining PRTG’s broad monitoring feature set with IP Fabric’s automated network assurance creates a new level of network visibility and reliability.

    Read more
    Plixer

    Plixer

    Paessler and Plixer provide a complete solution adding flow and metadata analysis to a powerful network monitoring tool.

    Read more
    ScriptRunner

    ScriptRunner

    With ScriptRunner Paessler integrates a powerful event automation platform into PRTG Network Monitor.

    Read more

    Find the root cause of the problem with our PRTG uptime monitoring solution

    Real-time notifications mean faster troubleshooting so that you can act before more serious issues occur.

    Free download
    PRODUCT OVERVIEW
    Paessler PRTG

    Paessler PRTG

    Network Monitoring Software – Version 26.1.116.1532 (February 9th, 2026)

    Hosting icon

    Hosting

    Download for Windows and cloud-based version PRTG Hosted Monitor available

    Languages icon

    Languages

    English, German, Spanish, French, Portuguese, Dutch, Russian, Japanese, and Simplified Chinese

    test

    Monitor everything

    Network devices, bandwidth, servers, applications, virtual environments, remote systems, IoT, and more

    test

    Pricing

    Choose the PRTG Network Monitor subscription that's best for you

    Discover more monitoring insights and stories

    Content illustration

    Powerful stories from the monitoring world

    • Uptime vs Availability: Why IT Teams Need Both Metrics for True ...
    • Building network reliability: Beyond uptime to true resilience
    • Proactive IT Support: How Real-Time Monitoring Reduces ...
    Support illustration

    Resources to master your monitoring challenges

    • Device and Sensor Setup
    • How can I propose new features or sensors for PRTG?
    • Understanding Basic Concepts
    Solution illustration

    Solutions for all your monitoring needs

    • SNMP Monitoring
    • Database Monitoring
    • CPU Monitoring

    Monitor uptime: FAQ


    What is uptime?

    The term "uptime" is used in IT to define the period of time in which a computer system is functional and available. When referring to a network, uptime is defined in terms of the availability and reliability of servers and devices, or by domain and website availability. Most of the time, availability is displayed as a percentage. An availability of 90% measured over the course of a day means the system was functional and available for exactly 1296 minutes (21.6 hours) on that particular day.

    What is the PRTG uptime monitoring tool?

    PRTG is a proprietary software tool that tracks and analyzes uptime across your network. Available for Windows-based on-premises servers or as a cloud-hosted solution, it continuously monitors hardware and software availability, response times, latency, error rates, and other key performance metrics, so you can prevent bottlenecks and other network issues, and ensure you keep unplanned downtime to a minimum.

    What is the preferred uptime value?

    The gold standard is 99.999%. A network with 99.999% uptime has around 5.26 minutes of unplanned downtime in a given year. In practice, very few networks achieve that level of uptime consistently, with the most stable networks typically having 99.9% or 99.95% uptime – equal to around four to eight hours of unplanned downtime each year.

    Of course, the more closely you monitor your network, the easier it is to achieve a high level of uptime. PRTG is designed to sound the alarm as soon as there are potential issues, so you can fix them before they cause a network outage.

    Why should I monitor uptime?

    Monitoring uptime is crucial for maintaining the health and performance of your systems. Regular uptime monitoring helps ensure that your services are consistently available to users.

    Furthermore, by tracking uptime, you can quickly detect and address issues before they escalate. Monitoring uptime also provides insights into your system's performance, allowing you to identify and rectify bottlenecks or inefficiencies. Uptime metrics provide valuable data that can inform your IT and business strategies. With accurate uptime records, you can make informed decisions about capacity planning, resource allocation, and service improvements.

    In addition, many businesses have Service Level Agreements (SLAs) that require a certain level of uptime. Monitoring helps you meet these obligations, avoid penalties, and demonstrate compliance to stakeholders.

    Is there a free edition of PRTG?

    With our free plan, you get:

    • A freeware uptime monitoring solution for up to 100 sensors for life
    • Monitoring of hardware, software, network performance, data traffic included
    • Free alarm, reports, and mapping features

    With the freeware edition of PRTG, you can get started with network monitoring in a matter of minutes. Our auto-discovery function detects all the devices within a given IP address range and automatically incorporates them into your monitoring environment.

    You can upgrade to a paid subscription license anytime. See pricing

    What is a sensor in PRTG?

    In PRTG, “sensors” are the basic monitoring elements. One sensor usually monitors one measured value in your network, for example the traffic of a switch port, the CPU load of a server, or the free space on a disk drive. On average, you need about 5-10 sensors per device or one sensor per switch port.

    We asked: would you recommend PRTG? Over 95% of our customers say yes!

    Paessler conducted trials in over 600 IT departments worldwide to tune its network monitoring software closer to the needs of sysadmins. The result of the survey: over 95% of the participants would recommend PRTG – or already have.

    recommendation

    Still not convinced?

    Love

    More than 500,000 sysadmins love PRTG

    Paessler PRTG is used by companies of all sizes. Sysadmins love PRTG because it makes their job a whole lot easier.

    PRTG

    Monitor your entire IT infrastructure

    Bandwidth, servers, virtual environments, websites, VoIP services – PRTG keeps an eye on your entire network.

    test

    Try Paessler PRTG for free

    Everyone has different monitoring needs. That’s why we let you try PRTG for free.

    PRTG Logo

    Start uptime monitoring with PRTG and see how it can make your network more reliable and your job easier.

    Free download
    PRODUCT OVERVIEW

    Products

    • Paessler PRTG
      Paessler PRTGMonitor your whole IT infrastructure
      • PRTG Network Monitor
      • PRTG Enterprise Monitor
      • PRTG Hosted Monitor
      • PRTG UVexplorer
      • PRTG extensions
        Extensions for Paessler PRTGExtend your monitoring to a new level
    • Icon Features
      FeaturesExplore all monitoring features

    Monitoring with PRTG

    • Network monitoring
    • Bandwidth monitoring
    • SNMP monitoring
    • Network mapping
    • Wi-Fi monitoring
    • Server monitoring
    • Network traffic analyzer
    • NetFlow monitoring
    • Syslog server

    Useful Links

    • PRTG Manual
    • Knowledge Base
    • Customer Success Stories
    • About Paessler
    • Subscribe to newsletter
    • PRTG Support
    • PRTG Consulting
    • PRTG Feedback & Roadmap

    Contact

    Paessler GmbH
    Thurn-und-Taxis-Str. 14, 
    90411 Nuremberg 
    Germany

    [email protected]

    +49 911 93775-0

    • Contact us
    ©2026 Paessler GmbHTerms & ConditionsPrivacy PolicyImprintReport VulnerabilityDownload & InstallSitemap
    Finance Finance Finance