• Company
    • About Us
    • Case Studies
    • Press Center
    • Careers
    • Blog
    • Contact us
  • Contact us
  • Login
 
  • English
    • Deutsch
    • Español
    • Français
    • Italiano
    • Português
Paessler
                    - The Monitoring Experts
  • Products
    • Paessler PRTG
      Paessler PRTGMonitor your whole IT infrastructure
      • PRTG Network Monitor
      • PRTG Enterprise Monitor
      • PRTG Hosted Monitor
      • PRTG UVexplorer
      • PRTG extensionsExtensions for Paessler PRTGExtend your monitoring to a new level
    • Icon Features
      FeaturesExplore all monitoring features
      • Maps & dashboards
      • Alerts & notifications
      • Multiple user interfaces
      • Distributed monitoring
      • Customizable reporting
  • Solutions
    • Industries
      IndustriesMonitor various industry sectors
      • Industrial
      • Healthcare
      • Data Center
      • Education
      • Finance
      • Government
    • IT Topics
      IT TopicsMonitor all areas of IT
      • Network Monitoring
      • Bandwidth Monitoring
      • SNMP Monitor
      • Network Mapping
      • WiFi Monitoring
      • Server Monitoring
  • Pricing
  • Resources
    • Getting Started
      Getting StartedModules for self-paced learning
    • How-to Guides
      How-to GuidesGet the most out of PRTG
    • Videos & Webinars
      Videos & WebinarsLearn from Paessler experts
    • IT  Knowledge
      IT KnowledgeExpand your IT knowledge
    • PRTG Manual
      PRTG ManualFull documentation
    • Knowledge Base
      Knowledge BaseShare community knowledge
    • PRTG Sensor Hub
      PRTG Sensor HubGet sensors, scripts & templates
    • Trainings
      PRTG TrainingLearn how to work with PRTG
  • Partners
    • Icon Handshake
      Become a PartnerFor resellers and channel partners
    • Icon MSP
      Become an MSPDeliver monitoring as a managed service
    • icon partner
      Partner PortalLog in to your partner account
    • Deal Registration
      Deal RegistrationRegister your sales opportunities
    • icon search
      Find a PartnerFind partners selling Paessler products
    • icon technology
      Technology AlliancesSee Paessler technology partnerships
    • Partner HubTools for Your Success
  • Company
    • About Us
    • Case Studies
    • Press Center
    • Careers
    • Blog
    • Contact us
  • Contact us
  • Login
  • English
    • Deutsch
    • Español
    • Français
    • Italiano
    • Português
  • Get a quote
  • Free trial
  1. Home>
  2. IT Topics>
  3. Virtualization>
  4. Virtual Server Monitoring

Virtual Server Monitoring with PRTG

Secure your virtual machines’ continued reliability

  • Monitor your whole virtual environment from one place, including server hardware
  • Proactively detect and fix issues with custom real-time alerts and notifications
  • Compatible with VMware, Hyper-V, Citrix XenServer & other major virtualization platforms
Free download
PRODUCT OVERVIEW

Our Users Give Top Ratings for Monitoring With Paessler PRTG

Gartner peer insights
spiceworks
G2
Capterra

PRTG virtual server monitoring: What you will find on this page

Table of content

    PRTG makes virtual server monitoring easy

    Custom alerts and data visualizations make it easy to monitor, identify, and prevent latency, high CPU load, low memory, and other performance issues.

    Free download
    PRODUCT OVERVIEW

    Server virtualization = more efficiency + less downtime = happier admins


    Virtualization saves money and space, improves availability, and simplifies disaster recovery.

    But, because a virtual environment has both physical and virtual elements, keeping an eye on this critical part of today's enterprise data centers comes with its own unique set of challenges.

    Our all-in-one virtual network monitoring software Paessler PRTG handles all the complexity so you don't have to.

    Accurate, completely customizable, and designed to work with most major virtualization platforms, it can monitor every single variable you can think of round the clock, ensuring your virtual servers — and environment — run smoothly, so you and your colleagues can get on with your jobs.

    What virtual machine monitoring looks like in PRTG

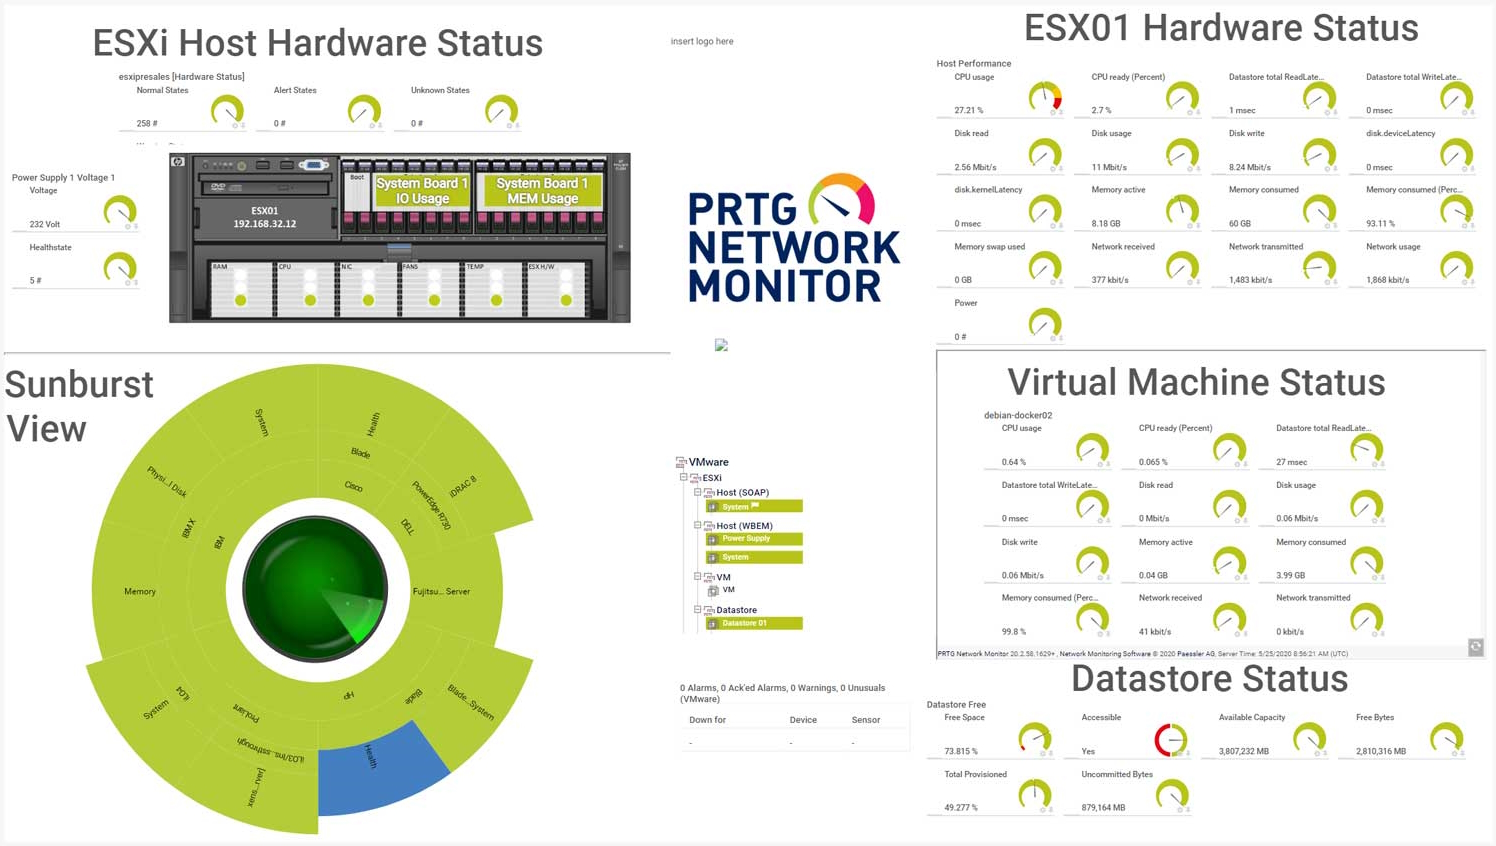
    Diagnose network issues by continuously tracking physical servers, hypervisors, VMs, and other virtual server components. Show CPU load, memory usage, server performance and capacity, and other key metrics in real time. Visualize monitoring data in clear graphs and dashboards to identify problems more easily. Gain the overview you need to troubleshoot what's causing latency, bottlenecks, and other performance issues.

    Map virtualization monitoring screenshot

    Map virtualization monitoring with PRTG

    PRTG Screenshot device tree view

    Device tree view of the complete monitoring setup

    PRTG screenshot map entire it infrastructure

    Custom PRTG dashboard for keeping an eye on the entire IT infrastructure

    PRTG screenshot graph live data traffic

    Live traffic data graph in PRTG

    Start monitoring virtual servers with PRTG and see how it can make your network more reliable and your job easier.

    Free download
    PRODUCT OVERVIEW

    IT experts agree: Paessler PRTG is a great solution for IT infrastructure monitoring

    PCMag

    “All-around winning
     network monitor”

    IT Brief

    “The real beauty of PRTG is the endless possibilities it offers”

    ITPro

    “PRTG Network Monitor 
    is very hard to beat”

    5 reasons why to choose PRTG as your virtual server monitoring tool

    End-to-end visibility

    Get a quick overview of your virtual servers' health, or zoom in to look at specific metrics up close. From overall performance to memory use, availability, and even the status of virtual machines and virtual desktops, PRTG can be as broad or as detailed as you need.

    Quick and easy setup

    With just a few clicks, you can add your virtual servers to PRTG and get started with your monitoring. Our preconfigured sensors receive all key data regarding your hosts, hypervisors, VMs, and applications. Neat, customizable dashboards ensure you constantly get the information you need.

    Automatic real-time alerts

    Pick your preferred thresholds and get on with your day. PRTG will monitor your virtual servers round the clock and let you know as soon as something's not right via SMS, email, push notification, or other methods, so you can fix it before any of your colleagues notice.

    Proactive capacity planning

    Is your virtual infrastructure reaching capacity? PRTG puts key performance data at your fingertips, making it easier to spot where you're under- or over-resourced, and plead the case for more investment with your less technical higher-ups.

    Wide compatibility

    PRTG works with most major virtualization platforms, including Citrix XenServer, Microsoft Hyper-V, Microsoft Azure, VMware vSphere, or Nutanix. We're even a VMware Certified Technology Partner, which means we’ve met VMware's incredibly high bar for technical excellence.

    Explore our preconfigured PRTG sensors for Virtual Server Monitoring

    PRTG comes with more than 250 native sensor types for monitoring your entire on-premises, cloud, and hybrid cloud environment out of the box. Check out some examples below!

    Microsoft Azure Virtual Machine

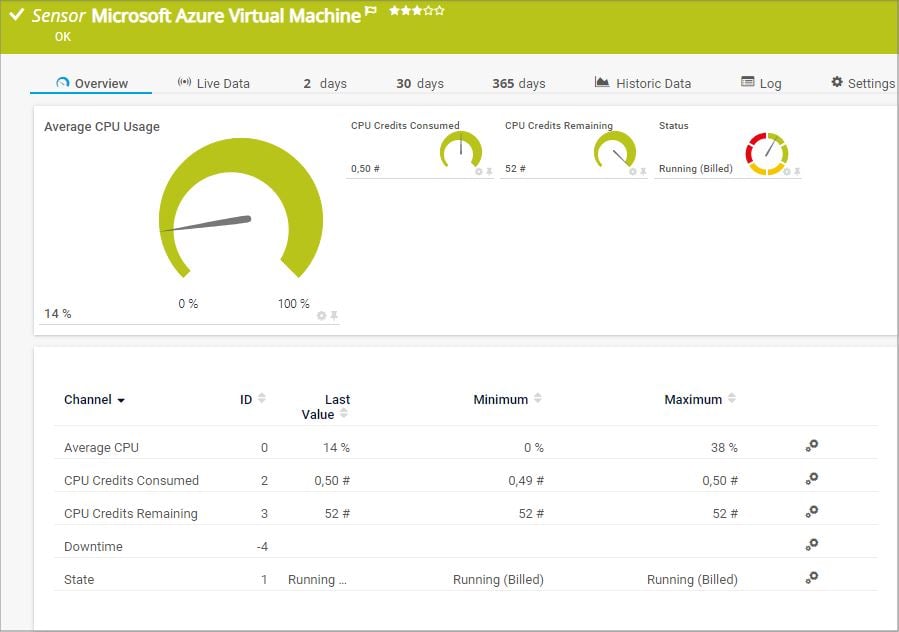
    The Microsoft Azure Virtual Machine sensor monitors the status of a virtual machine (VM) in a Microsoft Azure subscription. It can show the following:

    • Average CPU load
    • Number of consumed CPU credits
    • Number of remaining CPU credits
    • VM status
    Microsoft Azure Virtual Machine
    Microsoft Azure Virtual Machine

    Hyper-V Virtual Machine

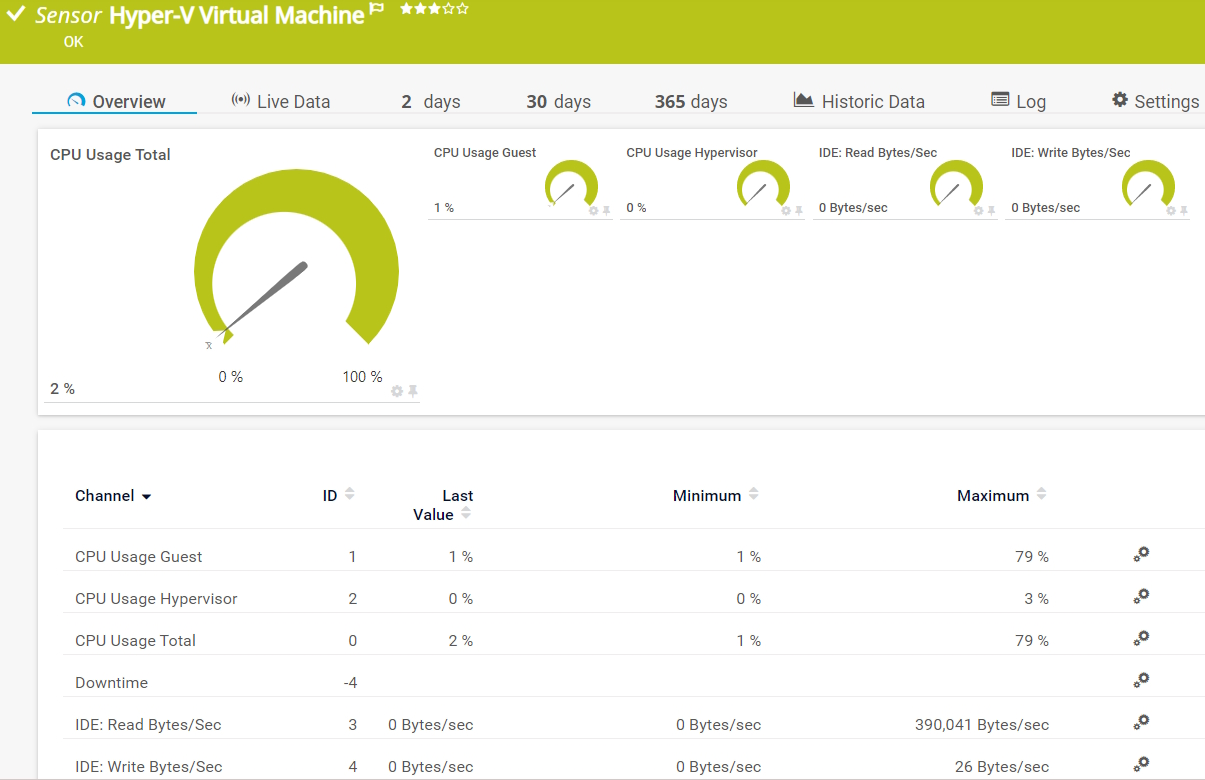
    The Hyper-V Virtual Machine sensor monitors a virtual machine that runs on a Microsoft Hyper-V host server via WMI or Windows performance counters. It can show the following:

    • CPU usage of the hypervisor, the guests, and in total
    • Disk read and write speed of the IDE
    Hyper-V Virtual Machine
    Hyper-V Virtual Machine

    Citrix XenServer Virtual Machine

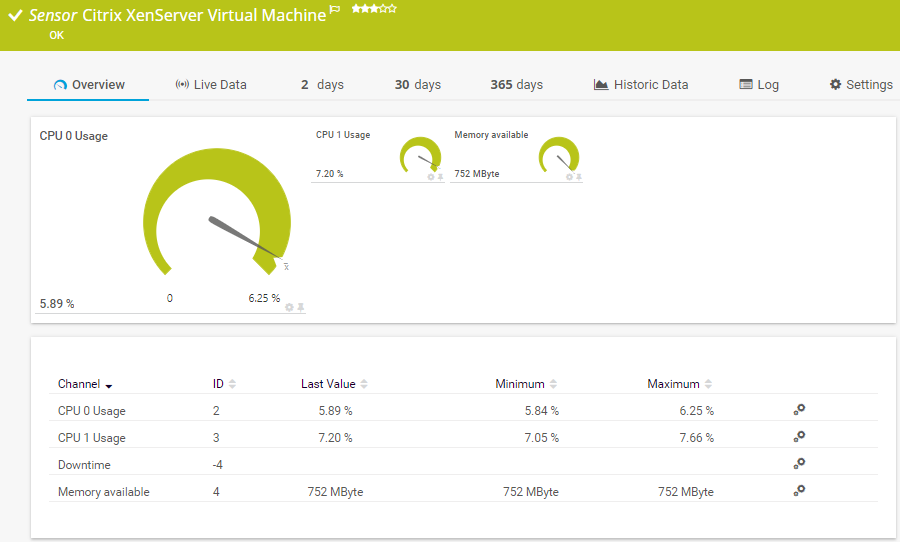
    The Citrix XenServer Virtual Machine sensor monitors a virtual machine (VM) on a XenServer via HTTP. It can show the following:

    • CPU usage
    • Available and used memory
    • Balloon driver target size
    Citrix XenServer Virtual Machine
    Citrix XenServer Virtual Machine

    Docker Container Status

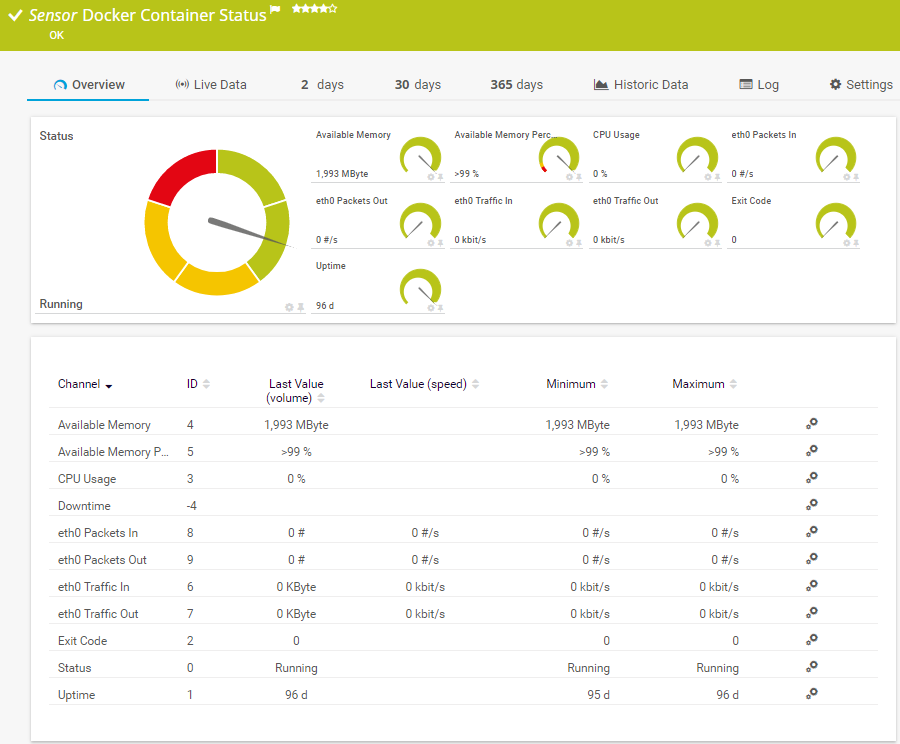
    The Docker Container Status sensor monitors the health and performance of a Docker container. It can show the following:

    • Available memory and CPU usage
    • Number of incoming and outgoing packets
    • Incoming and outgoing traffic
    • Overall status
    • Uptime
    Docker Container Status
    Docker Container Status

    See the PRTG Manual for a list of all available sensor types.

    PRTG Is Compatible With All Major Vendors, Products, and Systems

    compatible with all major vendors, products, and systems

    Find the root cause of the problem with our PRTG virtual server monitoring solution

    Real-time notifications mean faster troubleshooting so that you can act before more serious issues occur.

    Free download
    PRODUCT OVERVIEW

    “With PRTG, you get a centralized, intuitive, all-in-one tool that monitors the entire infrastructure. In the event of an error, the software immediately informs you by email. If you don’t hear from PRTG, you can sit back and relax, knowing everything is in order. Shortly after implementing PRTG, we were able to identify and eliminate performance bottlenecks in our VMware environment and load problems in our network.”

    Steffen Ille, Head of Infrastructure, Service Center for Computer Systems and Communication
    Bauhaus University Weimar

    “The demands on our entire IT infrastructure have grown steadily in recent years. An important step towards the optimization of this environment involved the virtualization of our digital landscape. In order to maintain the required transparency and the uninterrupted performance of all our systems, we needed a powerful network monitoring tool. For us, the most important selection criteria were price-performance ratio and ease of use. PRTG met all our expectations and has proven to be an indispensable part of our network management.”

    Daniel Baumgartner, Network Administrator
    Volkswind

    Your virtual server monitor at a glance – even on the go

    PRTG is set up in a matter of minutes and can be used on a wide variety of mobile devices.

    device overview
    vmware

    We are a VMware Technology Alliance Partner

    Paessler achieved VMware's highest level of endorsement due to our technological excellence, leading market position, and superior compatibility with VMware products.

    What does this mean for you?

    • Easy integration of VMware components with PRTG
    • State-of-the-art features for monitoring your virtual environment
    • Expert technical support around your VMware monitoring setup

    Create innovative solutions with Paessler’s IT partners

    Partnering with innovative IT vendors, Paessler unleashes synergies to create
    new and additional benefits for joined customers.

    IP Fabric

    IP Fabric

    Combining PRTG’s broad monitoring feature set with IP Fabric’s automated network assurance creates a new level of network visibility and reliability.

    Read more
    Plixer

    Plixer

    Paessler and Plixer provide a complete solution adding flow and metadata analysis to a powerful network monitoring tool.

    Read more
    Siemon

    Siemon

    Siemon and Paessler bring together intelligent building technology and advanced monitoring and make your vision of intelligent buildings and data centers become reality.

    Read more

    PRTG makes virtual server monitoring as easy as it gets

    Custom alerts and data visualization let you quickly identify and prevent latency, high CPU load, low memory, and other performance issues.

    Free download
    PRODUCT OVERVIEW
    Paessler PRTG

    Paessler PRTG

    Network Monitoring Software – Version 26.1.116.1532 (February 9th, 2026)

    Hosting icon

    Hosting

    Download for Windows and cloud-based version PRTG Hosted Monitor available

    Languages icon

    Languages

    English, German, Spanish, French, Portuguese, Dutch, Russian, Japanese, and Simplified Chinese

    test

    Monitor everything

    Network devices, bandwidth, servers, applications, virtual environments, remote systems, IoT, and more

    test

    Pricing

    Choose the PRTG Network Monitor subscription that's best for you

    Discover more monitoring insights and stories

    Content illustration

    Powerful stories from the monitoring world

    • Microsoft Azure Virtual Machine Sensor - PRTG Tutorial - Paessler
    • How to run a PRTG core server with >5,000 sensors in a virtual ...
    • Virtual Infrastructure Monitoring: Surviving the Layer Cake of Doom
    Support illustration

    Resources to master your monitoring challenges

    • PRTG Manual: Monitoring Virtual Environments - Paessler
    • PRTG Manual: Available Sensor Types - Paessler
    • PRTG Manual: Proxmox VE Virtual Machine Status Sensor - Paessler
    Solution illustration

    Solutions for all your monitoring needs

    • NetFlow Monitoring
    • LAN Monitoring
    • SNMP Monitoring

    Virtual Server Monitoring: FAQ


    What is virtualization?

    Virtualization is the process of creating a virtual version of something like computer hardware. It involves using specialized software to create a virtual or software-created version of a computing resource rather than the actual version of the same resource.

    What is a virtual server?

    A virtual server is a software-based environment that emulates the functionality of a physical server. It allows multiple virtual servers to run on a single physical server, sharing its resources while operating independently. Overall, virtual servers provide a flexible, efficient, and cost-effective way to manage and deploy server resources.

    Virtual servers are created using virtualization technology, which uses software called a hypervisor to create and manage virtual machines (VMs). The hypervisor sits between the hardware and the virtual servers, allocating resources such as CPU, memory, and storage to each VM.

    What are the advantages of virtual servers?

    Some advantages of virtual servers include:

    • Isolation and independence: Each virtual server operates independently of the others, with its own operating system, applications, and data. This isolation ensures that problems in one virtual server do not affect the others.
    • Resource efficiency: Virtual servers make more efficient use of physical server resources by allowing multiple VMs to run on a single piece of hardware. This reduces the need for additional physical servers, saving on costs and space.
    • Scalability: Virtual servers can be easily scaled up or down by adjusting the allocated resources or adding more VMs as needed. This flexibility makes it easier to handle varying workloads and growth.
    • Cost savings: By consolidating multiple virtual servers onto fewer physical servers, organizations can reduce hardware, energy, and maintenance costs.
    • Disaster recovery: Virtual servers can be backed up and replicated more easily than physical servers, improving disaster recovery and business continuity capabilities.
    What is the difference between a virtual server and a virtual machine?

    The terms "virtual server" and "virtual machine" (VM) are often used interchangeably, but there are subtle differences between them.

    A virtual machine is a broad concept that refers to any instance of an emulated computer. A virtual server is a specific use case of a VM, configured to perform server roles.

    Virtual machines can be used for various purposes, including running desktop environments, testing different operating systems, and application development. Virtual servers specifically refer to VMs that are configured and used for server-related tasks.

    In summary, all virtual servers are virtual machines, but not all virtual machines are virtual servers. The distinction lies in the intended use and configuration of the virtualized environment.

    What is PRTG virtual server monitoring?

    PRTG is a proprietary software tool that tracks and analyzes the availability and performance of hypervisors, virtual CPUs, virtual disks, RAM, and other virtual server components. Compatible with most major virtualization platforms, PRTG brings together critical health stats in one place, so you can easily optimize performance, troubleshoot issues, and keep your virtual environment running smoothly.

    How else can I improve my virtual servers' availability and performance?

    Alongside keeping an eye on critical parameters, it's also worth considering clustering — grouping virtualized servers so they work together as a single system. Clusters intelligently distribute network load, which is handy if your organization has high performance requirements. Clustering also helps avoid situations where there's a single point of failure. If one virtual server stops working, for whatever reason, another server in the cluster will swoop in and take over. 

    What is a sensor in PRTG?

    In PRTG, “sensors” are the basic monitoring elements. One sensor usually monitors one measured value in your network, for example the traffic of a switch port, the CPU load of a server, or the free space on a disk drive. On average, you need about 5-10 sensors per device or one sensor per switch port.

    We asked: would you recommend PRTG? Over 95% of our customers say yes!

    Paessler conducted trials in over 600 IT departments worldwide to tune its network monitoring software closer to the needs of sysadmins. The result of the survey: over 95% of the participants would recommend PRTG – or already have.

    recommendation

    Still not convinced?

    Love

    More than 500,000 sysadmins love PRTG

    Paessler PRTG is used by companies of all sizes. Sysadmins love PRTG because it makes their job a whole lot easier.

    PRTG

    Monitor your entire IT infrastructure

    Bandwidth, servers, virtual environments, websites, VoIP services – PRTG keeps an eye on your entire network.

    test

    Try Paessler PRTG for free

    Everyone has different monitoring needs. That’s why we let you try PRTG for free.

    PRTG Logo

    Start monitoring virtual servers with PRTG and see how it can make your network more reliable and your job easier

    Free download
    PRODUCT OVERVIEW

    Products

    • Paessler PRTG
      Paessler PRTGMonitor your whole IT infrastructure
      • PRTG Network Monitor
      • PRTG Enterprise Monitor
      • PRTG Hosted Monitor
      • PRTG UVexplorer
      • PRTG extensions
        Extensions for Paessler PRTGExtend your monitoring to a new level
    • Icon Features
      FeaturesExplore all monitoring features

    Monitoring with PRTG

    • Network monitoring
    • Bandwidth monitoring
    • SNMP monitoring
    • Network mapping
    • Wi-Fi monitoring
    • Server monitoring
    • Network traffic analyzer
    • NetFlow monitoring
    • Syslog server

    Useful Links

    • PRTG Manual
    • Knowledge Base
    • Customer Success Stories
    • About Paessler
    • Subscribe to newsletter
    • PRTG Support
    • PRTG Consulting
    • PRTG Feedback & Roadmap

    Contact

    Paessler GmbH
    Thurn-und-Taxis-Str. 14, 
    90411 Nuremberg 
    Germany

    [email protected]

    +49 911 93775-0

    • Contact us
    ©2026 Paessler GmbHTerms & ConditionsPrivacy PolicyImprintReport VulnerabilityDownload & InstallSitemap
    Finance Finance Finance